Franco Pintado-Castillo![]() | Franklin H. Fernandez-Zarate*
| Franklin H. Fernandez-Zarate*![]() | Mariela J. Quispe
| Mariela J. Quispe![]() | David Coronel-Bustamante
| David Coronel-Bustamante![]() | Luis Perez-Delgado
| Luis Perez-Delgado![]() | Jerson Tantalean
| Jerson Tantalean![]() | Luis Mariano Juarez-Alarcón
| Luis Mariano Juarez-Alarcón![]() | Azucena Chavez-Collantes
| Azucena Chavez-Collantes![]() | Victor H. Taboada-Mitma
| Victor H. Taboada-Mitma![]() | Juancarlos Cruz-Luis
| Juancarlos Cruz-Luis![]() | Alejandro Seminario-Cunya
| Alejandro Seminario-Cunya![]() | Annick E. Huaccha-Castillo
| Annick E. Huaccha-Castillo![]()
© 2025 The authors. This article is published by IIETA and is licensed under the CC BY 4.0 license (http://creativecommons.org/licenses/by/4.0/).
OPEN ACCESS
Litter decomposition is a fundamental process for the functioning of tropical ecosystems, as it regulates nutrient recycling and maintains soil fertility. This study evaluated the dynamics of litterfall degradation in three systems in northern Peru: forest (B), shaded coffee plantations (CCS), and unshaded coffee plantations (CSS), over a period of six months. Using in situ decomposition bags (n = 12 per system per month) and physicochemical analysis of soil and litter, it was determined that the forest had the highest decomposition rate (0.0028 day-1), followed by CSS (0.0018 day-1) and CCS (0.0015 day-1). These differences were associated with higher microbial activity and better substrate quality in the forest. Although the shaded coffee trees had lower decomposition rates, they showed the highest biomass accumulation (81.5 g), suggesting a favorable balance between productivity and organic matter conservation. Climatic analyses revealed that maximum temperature was the main driver of decomposition (r > 0.81), while relative humidity had an inhibitory effect (r ≈ -0.53). Furthermore, shaded coffee plantations replicated similar decomposition patterns to forest (r = 0.96), highlighting their potential as sustainable agroforestry systems. These findings underscore the importance of maintaining tree cover in coffee plantations to preserve key ecosystem services, such as carbon sequestration and soil fertility, in disturbed tropical landscapes. We recommend implementing 30-50% shade coverage using species adapted to each geographical area in order to optimize the nutrient cycle and mitigate the risks of degradation.
leaf litter decomposition, agroforestry, coffee plantations, nutrient cycling, soil sustainability
Litterfall and litter decomposition are key processes in ecosystem functioning, as they are the main mechanisms for nutrient return to the soil and organic matter formation, thus regulating the fertility and structure of forest and agricultural soils [1]. The quality and quantity of leaf litter, as well as its rate of decomposition, determine the rate of nutrient recycling and modulate related ecosystem services, including carbon sequestration and water regulation [2, 3]. These processes, however, are not uniform in space or time, as they depend on a suite of biotic and abiotic factors, whose interactions can vary widely among different cover types and land uses [4].
In agroforestry systems such as coffee plantations, the presence or absence of shade trees can significantly modify microclimatic and edaphic conditions, thus influencing litter dynamics and organic matter decomposition [5, 6]. Shade trees, by diversifying the litter input and modifying the conditions of light, humidity, and soil temperature, can favor a more efficient decomposition and a more balanced recycling of nutrients, compared to coffee plantations established without tree cover [7]. In this context, the comparison between natural forests and agricultural systems with different degrees of tree cover offers an ideal framework for analyzing how changes in land use affect nutrient cycling and soil sustainability.
The rate of litter decomposition is the result of the interaction between the quality of the leaf substrate, determined by its nutrient, lignin, and secondary metabolite content, and the activity of decomposer communities, which in turn is regulated by climatic factors such as temperature and soil moisture [4]. In tropical and subtropical environments, where seasonal rainfall and high thermal variability predominate, these interactions are particularly complex and sensitive to changes in vegetation cover [8-10]. In addition, the replacement of forest ecosystems with simplified agricultural systems tends to reduce the diversity of litter and associated microbial communities, with potential consequences for the rate and efficiency of decomposition [11, 12].
Studies in different tropical regions have documented that shaded coffee plantations have leaf litter decomposition rates intermediate between those of natural forests and unshaded monocultures, which translates into more balanced nutrient recycling and better soil quality indicators [13, 14]. However, in northern Peru, where coffee plantations are established in a mosaic of landscapes with varying degrees of intervention, the dynamics of leaf litter degradation under these contrasting systems have not yet been sufficiently characterized. This limits our understanding of the impacts of agroforestry management on nutrient cycling and soil conservation in this key region for Peruvian coffee growing. Moreover, the loss of tree cover in coffee plantations not only alters soil microclimate and litter quality but could also indirectly affect the composition and functionality of decomposer communities, generating a cascading effect on the decomposition and accumulation of organic matter [15, 16]. Understanding these processes is essential for the design of sustainable management strategies to maintain the productivity of coffee plantations and, at the same time, preserve the ecosystem services associated with nutrient cycling and soil quality.
Nevertheless, there is currently no robust, spatially explicit national estimate of the percentage of Peruvian coffee plantations experiencing soil or productivity degradation. Although national studies have quantified deforestation and general land-cover changes (e.g., Peru lost ~3.4 million ha of forest between 2000 and 2020) [17], these analyses do not disaggregate data to identify the share of degraded coffee areas specifically. This gap in national-scale data limits the capacity to contextualize local decomposition studies within broader degradation trends.
Similarly, no validated “land-use change trend map” exists specifically for Peru’s coffee-growing regions that can track (a) expansion or contraction of coffee areas, (b) land conversions such as forest → coffee or coffee → pasture, and (c) spatial hotspots of potential degradation. Remote sensing reviews emphasize that mapping coffee at large scales is methodologically challenging due to structural heterogeneity and spectral similarity with other land uses [18], and existing efforts remain mostly regional or exploratory.
Addressing these gaps would enable researchers to link local litter decomposition dynamics to macro-scale land-use trajectories and degradation patterns. We therefore recommend integrating a dedicated coffee-specific LULC mapping module—leveraging annual products such as MapBiomas Peru, high-resolution satellite imagery, and classifiers trained to identify coffee systems—validated with field data from representative plots. Such integration would support both policy-making and adaptive management by revealing the spatial extent and temporal trends of degradation in coffee landscapes.
In this context, this study seeks to analyze the dynamics of litter degradation in three contrasting systems in northern Peru: forest, coffee plantations under agroforestry systems, and coffee plantations without tree cover. The objective is to compare decomposition rates and their possible determinants under these systems, in order to provide evidence on the role of tree cover in the maintenance of essential ecological processes in the agricultural landscapes of the region. The results of this work seek to contribute to the development of agricultural practices that harmonize coffee productivity with the conservation of ecosystem functionality. Furthermore, we explicitly acknowledge the absence of a national degradation estimate and a coffee-specific LULC trend map as current limitations, and propose a methodological pathway to incorporate them into future research expansions.
2.1 Location of study area
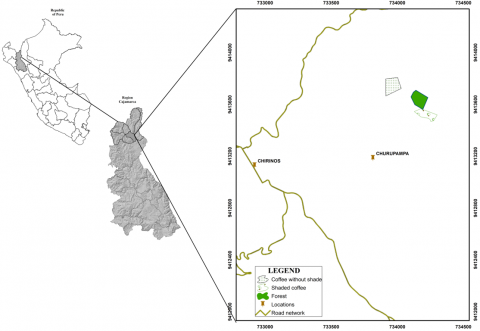
The research was carried out in the district of Chirinos, which belongs to the province of San Ignacio in the department of Cajamarca, Peru (Figure 1). It is located at an average altitude of 1858 m above sea level between the coordinates 5°17'42'' south latitude and 8°51'15'' west longitude, with a warm climate in the lower part, temperate in the middle part, and cold in the upper part. It is bordered on the north by the district of San Ignacio, on the south by the province of Jaén, on the east by the district of Huarango, and on the west by the district of La Coipa.
Figure 1. Location of the study area
2.2 Experimental setup and design
The experiment was conducted over a period of six (06) months, from January to June 2024. Three plots were identified: 1) Coffee without tree cover (CSS), 2) Coffee with tree cover (CCS), and 3) Forest (B). Each plot consisted of at least 10000 m² of soil. In each plot, a systematic distribution was carried out by segmenting it into 25 quadrats of 20 × 20 m, from which 12 quadrats/plot were selected (Figure 2). To quantify the litter decomposition rate, an in-situ experiment of the litter bag technique was used. Freshly fallen leaves were collected from each study plot specifically during January 2024.
Figure 2. Diagram of experimental plots and placement of litter bags for the decomposition study
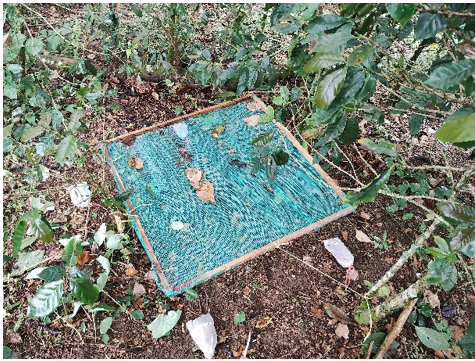
At each monitoring point, one 1 m2 leaf litter collector was installed at 50 cm above the ground, which was made of wood and had a 1 mm mesh opening (Figure 3). One month after the collectors were installed, five leaf litter decomposition bags were installed around each of the collectors with the collected and dried leaf litter.
Figure 3. Installation of collectors and litter decomposition bags
The leaf litter collected in the plots was air-dried at room temperature. All tools and work surfaces were cleaned and disinfected with 70% ethanol between samples to avoid cross-contamination. Then, 14 × 25 cm nylon bags were prepared, the mesh size was 0.26 × 0.80 mm, to which 10 grams of dry leaf litter (specifically from January) were added, and then placed 20 cm from the collector, at ground level, to facilitate its degradation [19]. In each bag, 10 grams of leaf litter in dry weight were placed, and its degradation was evaluated monthly. Twelve bags of leaf litter were collected monthly from each plot and transported to the laboratory. Adhering soil, plant debris, and roots growing inward were excluded, and the bags were oven-dried at 80℃ to constant weight to determine the remaining weight of the litterfall.
For each treatment × mesh size × sampling date, 2–3 blank (empty) litterbags were also deployed to act as controls for bag mass changes, contamination, or soil particle ingress. These blanks were processed identically to litter-containing bags, and their mean mass change was used to correct decomposition data according to: Corrected mass = Observed mass − Mean blank change [20].
Physicochemical analysis
Soil samples were taken at the beginning and end of the trial at a depth of 10 centimeters with a soil sampler, mainly from the areas designated for each litter decomposition bag. Soil pH was measured using a digital pH meter at a sample-to-water ratio of 1:2.5. Organic matter was performed using the method of Walkley and Black [21], total nitrogen was estimated following the digestion method proposed by Kjeldahl [22], available phosphorus was determined using the extraction method by Bray and Kurtz [23], available potassium was determined ammonium acetate proposed by Hanway and Heidal [24] and organic carbon (%C) was calculated from the equation %C = %MO/1.724 [25], these analyses were performed at the Soil, Water and Foliar Laboratory of the National Institute for Agrarian Innovation (INIA).
Calculation
The litter mass loss (%ML) for each month was determined from the mass (M1) of the remaining litterfall and the initial litter mass values (M0) using the formula [26].
$\% \mathrm{ML}=\left(\frac{M_0-M_1}{M_0}\right) \times 100$
The remaining weight was determined through the following equation:
$\% \mathrm{PR}=\left(\frac{P_t}{P_0}\right) \times 100$
where,
%PR: proportion of remaining weight
Pt: weight at time t (days)
P0: weight at time zero
The decomposition rate was calculated using the formula proposed by Olson [26]:
$k=\frac{-\ln \left(\frac{P}{P_0}\right)}{t}$
where,
k: decomposition rate
P: weight of litterfall at a given time
P0: initial weight of litterfall at time zero
t: time (days)
The percentage of nutrients remaining in the undecomposed litterfall at time 't' was calculated using the formula [27]:
(C/C0)× (L/L0) × 100
where, C is the concentration of nutrients in the litterfall samples at the time of sampling, C0 is the nutrient concentration of the initial litterfall, L is the dry matter mass at the time of sampling, and L0 is the initial dry mass of the litterfall sample.
Climatic data collection and analysis
Climatic data on precipitation, temperature, and humidity were collected from the Chirinos Meteorological Station - National Service of Meteorology and Hydrology of Peru (SENAMHI), located in the district of Chirinos, province of San Ignacio, department of Cajamarca (latitude 5°18'30.59'' S, longitude 78°53'51.32'' W, altitude 1772 m a.s.l.). These records were used to analyze the evaluation between climatic conditions and leaf litter degradation indices using Pearson's correlation coefficient, according to the distribution of the data.
Statistical analysis
Pearson's correlation coefficient was applied to evaluate the relationship between climatic variables (maximum and minimum temperature, relative humidity, and precipitation) and litter degradation indices (percentage of mass lost and decomposition rate) in each system. Additionally, correlations between the systems (CSS, CCS, and B) were calculated to identify similarities in their decomposition patterns. To strengthen the analysis, a multivariate analysis (RDA) integrating climatic and litter composition data was performed.
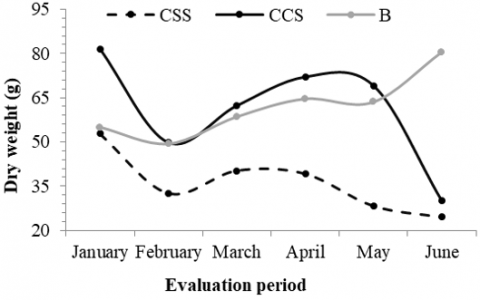
Litter accumulation showed marked variations among the systems evaluated. The CCS system presented a higher biomass accumulation during almost the entire evaluation period, consistently surpassing CSS and B, with a peak in January of 81.5 g. In contrast, the CSS system showed the lowest accumulation values, possibly due to the lower vegetation cover and lower contribution of organic material to the soil. The forest (B) presented an intermediate accumulation, with less temporal fluctuation, suggesting a more stable input rate (Figure 4).
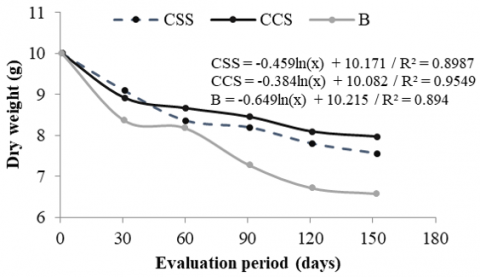
Litter decomposition followed a decreasing logarithmic trend in the three systems, adjusting with high coefficients of determination (R² > 0.89). The forest system (B) presented the highest degradation rate (slope = -0.649), followed by CSS (-0.459) and CCS (-0.384), indicating that plant residues in the forest decompose faster. This difference can be explained by higher microbial activity and better litter quality. Although the CCS system presented higher litter accumulation (Figure 4), its lower decomposition rate could favor the accumulation of organic matter in the soil, which represents a potential benefit in terms of soil carbon. In contrast, in CSS, degradation was more accelerated than in CCS, which could limit the formation of a protective organic layer (Figure 5).
Figure 4. Accumulation of leaf litter in collectors
Figure 5. Litter degradation
The results suggest that shade coffee (CCS) promotes greater litter production, which contributes to the input of organic matter into the system. However, the forest remains more efficient in terms of degradation, which is evidence of its intrinsic capacity to recycle nutrients rapidly. These findings highlight the importance of maintaining complex vegetation cover as a strategy to conserve critical ecological functions in tropical agroecosystems.
Differences in final weight reflect significant variations in decomposition rates associated with each system. Forest (B) showed the greatest mass loss, with a final weight of 6.6 g, representing a 34% reduction. In contrast, the coffee systems showed lower biomass loss: CSS reached 7.6 g and CCS 8.0 g, corresponding to reductions of 24% and 20%, respectively. These differences suggest higher decomposition efficiency within the forest ecosystem, probably related to more favorable conditions for microbial activity, greater decomposer diversity, and better litter quality. In the agroecosystems (CSS and CCS), the lower biomass loss may be attributed to more limiting microclimatic conditions or lower functional biological diversity in the soil (Figure 6).
Figure 6. Average weight at the beginning and end of the trial
The calculated decomposition rate confirms the trend observed in weight loss. Forest (B) reached the highest decomposition rate (0.0028 day-¹), exceeding coffee systems by approximately 50%. CSS and CCS presented rates of 0.0018 day-¹ and 0.0015 day-¹, respectively, indicating a slower mineralization process in these systems. It should be noted that, although CSS had a higher decomposition rate than CCS, this did not translate into a higher absolute biomass loss, possibly due to differences in the quality of the material (e.g., a higher proportion of more easily degradable leaves in CSS). Alternatively, conditions such as direct solar exposure and higher soil temperature in CSS could have accelerated physical processes without necessarily promoting efficient biological decomposition (Figure 7).
Figure 7. Litter decomposition rate
Figure 8 presents a comparison of various soil chemical parameters between the beginning and the end of the trial. An increase in pH is observed in all three systems at the end of the trial. The increase was most notable in CSS (5.20 to 5.70), indicating an improvement in soil acidity. This change is relevant in agricultural systems with acid soils, favoring nutrient availability and microbial activity. With respect to EC, there was a marked reduction in the three systems, highlighting a decrease from 40.40 to 11.66 mS/m in CCS. This decrease may reflect a lower accumulation of soluble salts at the end of the trial, which is positive to avoid salinity problems.
Figure 8. Soil chemical properties at the beginning and end of the test
Available phosphorus values show slight increases at the end of the trial, particularly in treatment B (2.95 to 3.40 mg/kg), although with overlapping error bars. This suggests a trend towards improved phosphorus bioavailability, which could be attributed to both organic matter mineralization and pH stabilization. With respect to potassium, a considerable increase is observed in CSS (158.11 to 243.49 mg/kg), compared to more modest increases in CCS and B.
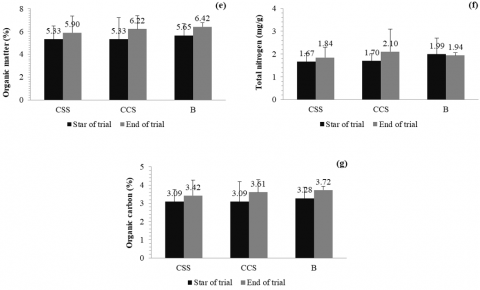
The CSS and CCS systems show sustained increases in organic matter, with system B reaching values of up to 6.42%. This indicates an improvement in soil fertility and water retention capacity, which is fundamental for sustainable agricultural productivity. Total nitrogen content increased slightly in CSS (1.67 to 1.84 mg/g) and CCS (1.70 to 2.10 mg/g), suggesting progressive leaf litter mineralization. These increases may enhance plant growth and reflect a higher efficiency of the system in nutrient supply. Finally, organic carbon showed an increasing trend in all treatments, especially in B (3.28 to 3.72%).
Figure 9. Leaf litter properties at the beginning and end of the trial
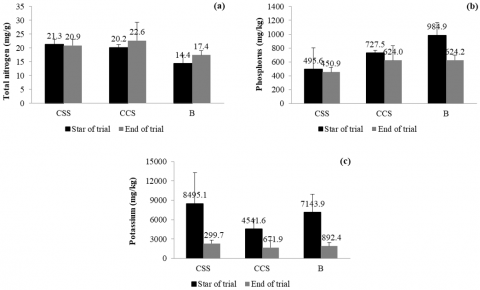
Figure 9 shows the changes in three essential macronutrients (total nitrogen, phosphorus, and potassium) present in the leaf litter of each system evaluated. In general, total nitrogen contents remained stable throughout the trial, with slight increases in CCS (20.2 to 22.6 mg/g) and B (14.4 to 17.4 mg/g), and a marginal decrease in CSS (21.3 to 20.9 mg/g). Although the changes are not drastic, the CCS treatment showed a superior capacity to increase total nitrogen, probably due to a higher rate of mineralization and availability of organic nitrogen. Regarding phosphorus, a general decrease was observed at the end of the trial in all treatments, especially in CCS (727.5 to 624.0 mg/kg) and B (984.9 to 624.2 mg/kg). This trend suggests a high rate of plant uptake or immobilization of phosphorus in unavailable forms. However, the CSS treatment maintained relatively stable levels (495.6 to 450.9 mg/kg), which could reflect a better retention of phosphorus in the system.
Finally, potassium showed a marked decrease in CSS (8495.1 to 299.7 mg/kg), which could be interpreted as a rapid initial release followed by intense extraction or leaching. The pattern was similar, although less extreme, in CCS and B, with decreases from 4541.6 to 671.9 mg/kg and from 7143.9 to 892.4 mg/kg, respectively. These results indicate that potassium was highly mobile and possibly more susceptible to washout losses.
Figure 10 shows the climatic variables during the study period. Figure 11 shows that maximum temperature (T_max) has a strong positive correlation with the three systems CSS (r = 0.93), CCS (r = 0.84), and B (r = 0.81).
Figure 10. Climatic variables in the study area during the period from January to June 2024
Figure 11. Correlation heat-map of climatic variables and litter degradation in the three systems evaluated (CSS, CCS, and B)
This indicates that higher temperatures accelerate litterfall degradation. This aligns with ecological theory that indicates that higher temperatures favor microbial and enzymatic activity. Regarding minimum temperature (T_min), a moderate relationship was observed with decomposition in CSS (r = 0.64), but weak with CCS (r = 0.32) and B (r = 0.35), suggesting that nighttime temperature has a more relevant impact in open environments, while in systems with cover (shade or forest), thermal buffering reduces its influence.
Relative humidity (H) presents a negative correlation with all systems, especially in CCS (r = -0.59) and B (r = -0.53), suggesting that, in humid and shaded environments, excess humidity may limit the oxygenation of the material or promote the presence of less efficient microorganisms in decomposition. It could also be associated with the accumulation of less degraded material in cooler and more humid environments. Precipitation (PP) has little positive correlation with CSS (r = 0.37), and a negative correlation with CCS (r = -0.09) and B (r = -0.12).
If we analyze the relationships between the three systems evaluated, we can observe that between CSS and CCS (r = 0.85), there is a strong correlation between degradation in shaded and unshaded coffee systems, which may indicate that, although they differ in coverage, they maintain a similar climatic response, especially if they are in spatial proximity or on comparable soils. In the case of CSS and B (r = 0.48), there is a moderate correlation, suggesting that the decomposition processes in coffee without shade share certain patterns with the forest, possibly due to factors such as light input or substrate characteristics. Finally, CCS and B (r = 0.96) show a very high correlation, indicating that the decomposition dynamics in coffee with shade are significantly similar to those of the forest, reinforcing the ecological value of the agroforestry system as a functional bridge to more conserved ecosystems.
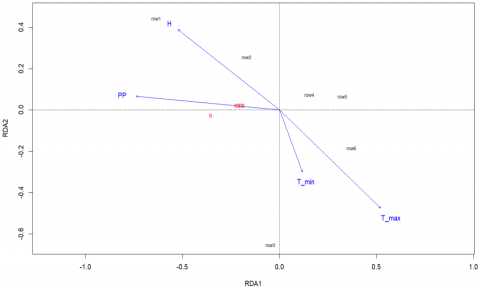
Figure 12 presents the order resulting from the redundancy analysis (RDA), which was used to evaluate the influence of climatic variables on the degradation patterns observed at the sampling sites. The analysis was structured in two principal components, RDA1 and RDA2, which together explain the largest proportion of the total variance in the response variables.
The explanatory variables included were maximum temperature (T_max), minimum temperature (T_min), relative humidity (H), and precipitation (PP), represented in the biplot as blue vectors. The direction and length of the vectors indicate the orientation and magnitude of the contribution of each variable to the environmental gradient. It is observed that T_max and T_min present the longest vectors and project in the same direction within the canonical space, suggesting a positive correlation between the two and a strong influence on the RDA1 axis. This association indicates that thermal conditions, particularly extreme temperatures, constitute the main drivers of degradation patterns at the evaluated sites. In contrast, relative humidity (H) projects in the opposite direction to temperatures, suggesting an inverse relationship, where wetter conditions would be associated with less degradation. Precipitation (PP) has a smaller contribution to the model, with a shorter vector oriented negatively on the same axis, reflecting a reduced or possibly inverse influence.
The red dots represent the sample units (degradation assessment sites), which are clustered with low dispersion in the center of the graph, which could indicate a homogeneous response between sites or a moderate and combined influence of the environmental variables considered.
Figure 12. Redundancy analysis (RDA) between litterfall degradation of B, CCS, and CSS in relation to climatic variables
Taken together, these results suggest that temperature constitutes the main environmental factor associated with degradation processes, while relative humidity and precipitation play secondary or buffering roles. This information is critical for the design of differentiated management strategies in the face of climate change in vulnerable ecosystems.
The results of the present study show that litter decomposition dynamics vary significantly among the three systems evaluated, with the forest (B) having the highest degradation rate. This finding is consistent with previous studies indicating that conserved forest ecosystems maintain a greater functional diversity of decomposers and a better nutritional quality of litter, which favors more efficient mineralization processes [3, 4]. The dense vegetation cover and microclimatic stability of the forest create optimal conditions for microbial activity and aerobic decomposition, critical elements in biogeochemical cycling of carbon and nutrients [1, 15].
In contrast, agricultural systems, particularly the unshaded coffee plantation (CSS), showed intermediate decomposition rates, while the shaded coffee plantation (CCS) had the lowest rate, despite having the highest litter accumulation. This pattern can be attributed to differences in substrate quality and microclimatic conditions. Although CCS contributes more biomass, its slower decomposition suggests a progressive accumulation of organic matter in the soil, which could have beneficial medium-term effects on soil fertility and water retention capacity [14]. These results highlight the role of agroforestry systems as ecological intermediaries between monocultures and natural ecosystems, promoting critical soil functions without completely compromising agricultural productivity.
More accelerated decomposition in SSC could be influenced by more extreme conditions of solar exposure and higher temperatures, which, although it could accelerate mass loss by physical or photooxidative processes [8], does not necessarily imply a higher biological efficiency of the system. In fact, rapid degradation in CSS could lead to nutrient losses by leaching or volatilization before they are utilized by soil biota, which in the long term would compromise soil quality. These results confirm that not only the rate of decomposition is important, but also the final destination of the released nutrients and their integration into soil cycles [11].
Soil physicochemical analysis showed an increase in pH and organic matter in all systems, with particularly marked effects in CSS. This suggests that even in the absence of tree cover, leaf litter incorporation can have an ameliorative effect on acid soils, improving conditions for root growth and soil enzyme activity [10]. The increase in available nutrients such as potassium and phosphorus, although variable among systems, also reinforces the idea that leaf litter plays a central role in the recycling of essential elements. However, the high loss of potassium observed in CSS and B also points to a high mobility of this nutrient, which raises the need for management strategies to avoid its leaching. From a foliar perspective, the results indicated a general stability in nitrogen and phosphorus levels, but a marked reduction in potassium, especially in CSS. This dynamic may be associated with both the rapid initial mineralization and the low capacity of the system to retain cations, which limits the sustained availability of the nutrient. In that sense, systems such as CCS, with slower decomposition rates but progressive biomass accumulation, could offer a more gradual and efficient release of nutrients to the soil, which is key for low-intensity agricultural systems [7, 13].
Climate correlation analyses and RDA showed that temperature, both maximum and minimum, was the most determinant factor in litterfall degradation, while relative humidity and precipitation had secondary or even negative effects. This confirms the importance of temperature as the main driver of enzymatic and microbial activity, in agreement with global studies on decomposition [12, 16]. However, the negative effect of relative humidity in shaded systems suggests that, under high humidity conditions, decomposition could be limited by the lack of oxygen, favoring less efficient anaerobic processes [9].
The high correlation between CCS and B in terms of response to climatic variables reinforces the functional value of the agroforestry system as a partial ecological substitute for the forest. This similarity is not only expressed in degradation patterns, but also in nutrient retention and improvement of soil properties. Therefore, promoting agroforestry management with shade in coffee plantations can be an effective strategy to reconcile productivity and conservation, mitigating the negative effects of land use change and maintaining key ecosystem services in tropical agricultural landscapes [2, 6].
Finally, given the observed rapid depletion/mobilization of K in CSS and the lower soil K adjacent to deployed bags, we recommend the following mitigation measures for immediate and medium-term recovery of plant-available K in CSS:
a. Apply composted coffee pulp or coffee husk compost as surface mulch or incorporated organic amendment (rates and composition should be informed by soil tests); composted pulp increases soil K pools and reduces soluble losses relative to raw pulp [28, 29].
b. Adopt split K fertilization (multiple small doses across the cropping cycle) and, where appropriate, complement with foliar K sprays at critical phenological stages to correct acute shortages while reducing leaching risk [30].
c. Increase soil organic matter through cover crops and green manures (particularly species that contribute K or improve cation-holding capacity) to improve K retention [29].
d. Monitor soil K with routine tests and evaluate on-farm trials comparing CSS vs CCS to quantify yield and economic outcomes.
To optimize nutrient return, microclimate control, and diversified services (income and biodiversity), we recommend a mixture of N-fixing species and productive local species as a shade backbone: Inga edulis (N-fixing, rapid source of leaf litter) [31, 32], Erythrina spp. (rapid biomass contribution and fixation) [33] or forest species (Calycophyllum spruceanum, Pinus tecunumanii, Cordia alliodora) or fruit trees (orange, cherimoya, avocado, lemon, banana, etc.) [34] depending on availability. This combination balances rapid nutrient contribution, moderate shade, and economic diversification options.
The forest system (B) showed greater efficiency in leaf litter degradation, measured quantitatively by the decomposition rate (k) and mass loss. The values obtained were k = 0.0028 day-¹ and 34% mass loss in B, compared to k = 0.0018 day-¹ and 24% in full sun coffee (CSS) and k = 0.0015 day-¹ and 20% in shade-grown coffee (CCS). In relative terms, the forest outperformed CSS by 55.6% in k and 41.7% in mass loss, and CCS by 86.7% and 70.0%, respectively. Shade-grown coffee plantations, although slower to decompose, accumulated greater leaf litter biomass and showed a degradation pattern highly correlated with the forest (r = 0.96), indicating functional similarity in nutrient recycling. Maximum temperature was identified as the main driver of decomposition, while relative humidity had a limiting effect in shaded systems, suggesting that climate change could accelerate nutrient mineralization but also increase the risk of leaching in open systems.
We recommend the planned integration of shade trees, prioritizing native and nitrogen-fixing species (Inga edulis, Erythrina sp.), complemented by local timber and fruit trees (Calycophyllum spruceanum, Pinus tecunumanii, Cordia alliodora, citrus, palta, banana), with densities and pruning management adapted to the context to optimize coverage (≈30-50%) and balance productivity, soil fertility, and conservation of ecosystem services.
The authors thank the Instituto Nacional de Innovación Agraria (INIA) through the Investment Project with CUI N° 2472675 entitled: Improvement of Research Services and Transfer of Agricultural Technology at the Baños del Inca Agricultural Experimental Station, Baños del Inca, located in the district of Baños del Inca, province of Cajamarca, department of Cajamarca.
[1] Giweta, M. (2020). Role of litter production and its decomposition, and factors affecting the processes in a tropical forest ecosystem: A review, Journal of Ecology and Environment, 44(1): 11. https://doi.org/10.1186/s41610-020-0151-2
[2] Zhang, D., Hui, D., Luo, Y., Zhou, G. (2008). Rates of litter decomposition in terrestrial ecosystems: Global patterns and controlling factors. Journal of Plant Ecology, 1(2): 85-93. https://doi.org/10.1093/jpe/rtn002
[3] Prescott, C.E. (2010). Litter decomposition: What controls it and how can we alter it to sequester more carbon in forest soils? Biogeochemistry, 101(1): 133-149. https://doi.org/10.1007/s10533-010-9439-0
[4] Cornwell, W.K., Cornelissen, J.H.C., Amatangelo, K., Dorrepaal, E., et al. (2008). Plant species traits are the predominant control on litter decomposition rates within biomes worldwide. Ecology Letters, 11(10): 1065-1071. https://doi.org/10.1111/j.1461-0248.2008.01219.x
[5] Beer, J., Muschler, R., Kass, D., Somarriba, E. (1997). Shade management in coffee and cacao plantations. Agroforestry Systems, 38(1): 139-164. https://doi.org/10.1023/A:1005956528316
[6] Soto-Pinto, L., Villalvazo-López, V., Jiménez-Ferrer, G., Ramírez-Marcial, N., Montoya, G., Sinclair, F.L. (2007). The role of local knowledge in determining shade composition of multistrata coffee systems in Chiapas, Mexico. Biodiversity and Conservation, 16(2): 419-436. https://doi.org/10.1007/s10531-005-5436-3
[7] Muschler, R.G. (2001). Shade improves coffee quality in a sub-optimal coffee-zone of Costa Rica. Agroforestry Systems, 51(2): 131-139. https://doi.org/10.1023/A:1010603320653
[8] Austin, A.T., Vivanco, L. (2006). Plant litter decomposition in a semi-arid ecosystem controlled by photodegradation. Nature, 442(7102): 555-558. https://doi.org/10.1038/nature05038
[9] Liu, J., Wang, Q., Yuan, J., Zhang, T., Ye, S., Li, W., Li, Z., Gui, J. (2018). Integrated rice-field aquaculture in China, a long-standing practice, with recent leapfrog developments. In Aquaculture in China: Success Stories and Modern Trends, pp. 174-184. https://doi.org/10.1002/9781119120759.ch2_6
[10] Liu, Y., Zhang, A., Li, X., Kuang, W., Islam, W. (2024). Litter decomposition rate response to multiple global change factors: A meta-analysis. Soil Biology and Biochemistry, 195: 109474. https://doi.org/10.1016/j.soilbio.2024.109474
[11] Wardle, D.A., Bardgett, R.D., Klironomos, J.N., Setälä, H., van der Putten, W.H., Wall, D.H. (2004). Ecological linkages between aboveground and belowground biota. Science, 304(5677): 1629-1633. https://doi.org/10.1126/science.1094875
[12] Schwieger, S., Dorrepaal, E., Petit Bon, M., Vandvik, V., et al. (2025). Environmental conditions modulate warming effects on plant litter decomposition globally. Ecology Letters, 28(1): e70026. https://doi.org/10.1111/ele.70026
[13] Haggar, J., Barrios, M., Bolaños, M., Merlo, M., Moraga, P., Munguia, R., Ponce, A., Romero, S., Soto, G., Staver, C., de M. F. Virginio, E. (2011). Coffee agroecosystem performance under full sun, shade, conventional and organic management regimes in Central America. Agroforestry Systems, 82(3): 285-301. https://doi.org/10.1007/s10457-011-9392-5
[14] Powers, J.S., Peréz-Aviles, D. (2013). Edaphic factors are a more important control on surface fine roots than stand age in secondary tropical dry forests. Biotropica, 45(1): 1-9. https://doi.org/10.1111/j.1744-7429.2012.00881.x
[15] Krishna, M.P., Mohan, M. (2017). Litter decomposition in forest ecosystems: A review. Energy, Ecology and Environment, 2(4): 236-249. https://doi.org/10.1007/s40974-017-0064-9
[16] Zhao, X., Tian, Q., Michelsen, A., Ren, B., Feng, Z., Chen, L., Jiang, Q., Zhao, R., Liu, F. (2025). Global pattern in terrestrial leaf litter decomposition: The effects of climate, litter chemistry, life form, growth form and mycorrhizal association. Agricultural and Forest Meteorology, 362: 110368. https://doi.org/10.1016/j.agrformet.2024.110368
[17] Móstiga, M., Armenteras, D., Vayreda, J., Retana, J. (2024). Two decades of accelerated deforestation in Peruvian forests: A national and regional analysis (2000–2020). Regional Environmental Change, 24(2): 42. https://doi.org/10.1007/s10113-024-02189-5
[18] Hunt, D.A., Tabor, K., Hewson, J.H., Wood, M.A., Reymondin, L., Koenig, K., Schmitt-Harsh, M., Follett, F. (2020). Review of remote sensing methods to map coffee production systems. Remote Sensing, 12(12): 2041. https://doi.org/10.3390/rs12122041
[19] García-Domínguez, A., del Carmen Cámara Cabrales, L., van der Wal, J.C., Sánchez, J.L.M. (2020). Producción y tasa de descomposición de hojarasca en acahuales de Tabasco, México. Madera y Bosques, 26(1): e2611694. https://doi.org/10.21829/myb.2020.2611694
[20] Graça, M.A.S., Bärlocher, F., Gessner, M.O. (2005). Methods to Study Litter Decomposition. Springer-Verlag, Berlin/Heidelberg. https://doi.org/10.1007/1-4020-3466-0
[21] Walkley, A., Black, I.A. (1934). An examination of the Degtjareff method for determining soil organic matter, and a proposed modification of the chromic acid titration method. Soil Science, 37(1): 29-38.
[22] Kjeldahl, C. (1883). A new method for the determination of nitrogen in organic matter. Analytical and Bioanalytical Chemistry, 22: 366. https://doi.org/10.1007/BF01338151
[23] Bray, R.H., Kurtz, L.T. (1945). Determination of total, organic, and available forms of phosphorus in soils. Soil Science, 59(1): 39-46.
[24] Hanway, J.J., Heidal, H. (1952). Soil analysis methods as used in the Iowa state college soil testing laboratory. Iowa Agriculture, 57: 1-31.
[25] Correa, G.V., Blanco, J.L., de Lourdes Rodríguez Gamiño, M. (2012). Total organic carbon levels in the conservation soil of the Federal District, central Mexico. Investigaciones Geográficas, 2012(77): 18-30. https://doi.org/10.14350/rig.31007
[26] Olson, J.S. (1963). Energy storage and the balance of producers and decomposers in ecological systems. Ecology, 44(2): 322-331. https://doi.org/10.2307/1932179
[27] Bockheim, J.G., Jepsen, E.A., Heisey, D.M. (2011). Nutrient dynamics in decomposing leaf litter of four tree species on a sandy soil in northwestern Wisconsin. Canadian Journal of Forest Research, 21(6): 803-812. https://doi.org/10.1139/x91-113
[28] Cole, R.J., Zahawi, R.A. (2021). Coffee pulp accelerates early tropical forest succession on old fields. Ecological Solutions and Evidence, 2(1): e12054. https://doi.org/10.1002/2688-8319.12054
[29] Takala, B. (2021). Utilization of coffee husk and pulp waste as soil amendment. A review. Journal of Natural Sciences Research, 12(11): 10-16.
[30] da Mota, R.P., de Camargo, R., Franco, M.H.R., de Assis, G.A., Ferraz-Almeida, R., Lemes, E.M. (2025). Sources and splitting of special fertilizers application in coffee crop. Journal of Plant Nutrition, 48(6): 1067-1081. https://doi.org/10.1080/01904167.2024.2422069
[31] Piato, K., Subía, C., Lefort, F., Pico, J., Calderón, D., Norgrove, L. (2022). No reduction in yield of young Robusta coffee when grown under shade trees in Ecuadorian Amazonia. Life, 12(6): 807. https://doi.org/10.3390/life12060807
[32] Nygren, P., Leblanc, H.A. (2015). Dinitrogen fixation by legume shade trees and direct transfer of fixed N to associated cacao in a tropical agroforestry system. Tree Physiology, 35(2): 134-147. https://doi.org/10.1093/treephys/tpu116
[33] Chatterjee, N., Nair, P.K.R., Nair, V.D., Bhattacharjee, A., de Melo Virginio Filho, E., Muschler, R.G., Noponen, M.R.A. (2020). Do coffee agroforestry systems always improve soil carbon stocks deeper in the soil?—A case study from Turrialba, Costa Rica. Forests, 11(1): 49. https://doi.org/10.3390/f11010049
[34] Koutouleas, A., Sarzynski, T., Bordeaux, M., Bosselmann, A.S., et al. (2022). Shaded-coffee: A nature-based strategy for coffee production under climate change? A review. Frontiers in Sustainable Food Systems, 6: 877476. https://doi.org/10.3389/fsufs.2022.877476