Mohammed Kareem Sameer![]()
© 2025 The author. This article is published by IIETA and is licensed under the CC BY 4.0 license (http://creativecommons.org/licenses/by/4.0/).
OPEN ACCESS
Geographic Information Systems (GIS) play a vital and important role in supporting green buildings, which are among the most important global trends in the field of construction. Introducing modern technology in supporting and designing green buildings will contribute to achieving a balance between the environment and the economy in society. One of the most prominent of these technologies is the deep learning tool within Geographic Information Systems. The analysis of area and location criteria using GIS and deep learning tools aims to identify the most suitable sites for establishing green buildings. By employing artificial intelligence models—such as large language models (LLMs)—to interpret GIS outputs, it becomes possible to classify land use more accurately and determine the optimal utilization of available resources in accordance with the characteristics of the Earth's surface. The study revealed that vacant and barren areas constituted 93% of the total area of 45 square kilometers. The weighted overlay method was used to support site selection and land suitability modeling. The land was planned and the vacant areas utilized, allocating 20% for green spaces, 46% for residential development, and 7% for water features. These ratios reflect the sustainable planning framework for the study area, as the analysis in GIS contributes significantly to the development of green spaces, the strengthening of the city's green belt, and the support for formulating future plans for land allocation and spatial distribution within the study area, with the classification of sites based on their intended use.
GIS, AI, deep learning, green building, site suitability analysis, weighted overlay
With the rapid advancement of technology, it has become necessary to integrate modern spatial technologies into the field of urban development [1]. In the past few years, the integration of remote sensing (RS) technology and artificial intelligence tools in data collection and signal processing to obtain the required information has emerged, enabling the automatic extraction of the required features [2, 3].
In order to develop comprehensive geospatial databases that include land uses, environmental values, population distribution, and the main infrastructure network, Geographic Information Systems (GIS) have added to increasing analytical capabilities and advanced predictive modeling through their tools (deep learning), to identify optimal infrastructure locations [3, 4]. Decision-makers have resorted to adopting modern technologies in the field of urban planning to make the planning process smarter and more adaptive in order to achieve future goals. Artificial intelligence technology has proven to be a robust approach in redistributing resources, preserving environmental resources, and reducing environmental impacts, all of which are reflected in sustainable development in refining the quality of urban life [5]. The urban extension and human settlement that have increased recently, which has led to rapid urban growth and rural migration to the city, have contributed to an increased demand for services, which requires intervention and the use of modern architectural methods in planning and designing modern cities and distributing and expanding services [6].
To achieve these goals of improving environmental comfort, improving the quality of living, developing built spaces, and achieving a qualitative leap in sustainable and green architecture, this was done using a deep learning tool with GIS [7, 8].
The integration of artificial intelligence and Geographic Information Systems develops researchers' ability to analyze big data, assess the condition and vulnerability of urban buildings, and predict natural disasters. This combination leads to more reliable decisions, providing a stronger foundation for informed decision-making during the response and planning phases [9, 10].
In light of this, and to understand the term urban sustainability and promote decisions regarding the preservation of its resources, spatial information systems and deep learning technologies have emerged as pivotal tools to assist in interpretation and analysis [11]. To achieve this, the construction and urban planning sectors must cooperate with decision-makers to prepare environmentally and energy-friendly urban planning and design [12]. To ensure environmental protection and minimize energy consumption, it is essential that planning efforts are conducted within a unified and collaborative framework [13]. For the generation of precise and comprehensive analyses and interpretations of spatial information, GIS serves as the fundamental platform [14].
The enhanced framework offers intuitive access to a wide range of professional image analysis capabilities powered by external artificial intelligence (AI) [15, 16]. The study relied on integrating AI, GIS, and high-resolution DEM, using aerial laser scanning data to create polygonal models of the cultivated areas, and this was done with the aim of accurately measuring the actual areas and calculating the proportion of embankments to the total field area. However, it lacks the actual absence of testing the model in areas with different topographical characteristics or different agricultural environments, and the absence of temporal factors and details about the type of model used (such as neural networks or support vectors), which reduces the transparency of the research [17]. The study relied on the integration of Geographic Information Systems and artificial intelligence within a unified technical framework known as Geo-AI techniques to analyze the cooling effect of urban parks. Land surface temperature (LST) and normalized vegetation index (NDVI) data were obtained from Landsat 8-OLI satellite images. Then, the researcher used a Support Vector Machine (SVM) algorithm to classify and identify different surface features such as vegetation cover and water surfaces, but it was spatially specific and focused on satellite data – it was not field validated and lacked comparison with other traditional or hybrid models [18]. The study depends on a combination of field surveys, GIS mapping, stakeholder interviews, and AI-based analysis. These techniques were used to identify land use types and assess green spaces. Machine learning models have also been used to analyze spatial and environmental data and predict the role of green spaces in mitigating urban heat islands. However, they lack the ability to expand spatial and temporal scales and integrate social and economic aspects into the analysis, which calls for more comprehensive future studies to enhance the sustainability of cities [19]. The study aimed to analyze the spatial and temporal changes in land use and land cover (LULC) among three different Pakistani cities in their planning models, for the period from 1990 to 2020. Landsat 5 and Landsat 8 satellite images were used within the Google Earth Engine (GEE) platform, with the help of high-resolution images, to verify the results. The Supervised Classification method was modified, but the reason for this change was not mentioned, and the changes were not directly and in detail linked to specific planning decisions, with the absence of actual environmental impact [20]. Using multi-temporal Landsat satellite imagery, RS and GIS technologies, as well as AI techniques to analyze trends in environmental indicators. However, without detailing or explaining precisely how “AI techniques” are used in these programs to analyze trends in environmental indicators, which reduces the transparency of the methodology and reproducibility [21].
The study aims to monitor and analyze spatial changes in mangrove forest cover along the Mumbai coast during the period from 2014 to 2019. Using the Classification and Regression Tree (CART) model for classification, and with the help of remotely sensed geospatial data, and analysis via the powerful cloud computing platform Google Earth Engine (GEE). Data analysis was limited to the area scale and did not take into consideration the qualitative scale or analysis of environmental causes [22].
The objective of this study is to use GIS and AI tools represented by deep learning to ascertain and assess the optimal sites for the development of green buildings. The research aims to explore the possibility of integrating artificial intelligence tools within GIS, specifically deep learning and the application of spatial analysis techniques (weighted superposition method), to classify land use, evaluate environmental suitability, and improve the distribution of urban assets. This integration provides an effective tool for promoting sustainable urban planning. This study contributes to this field by demonstrating how artificial intelligence can help improve the interpretation of GIS outputs and provide a data-driven framework for sustainable site selection and urban development.
Deep learning is an artificial intelligence tool within the GIS environment that contributes significantly to spatial interpretation and helps increase the accuracy of land use classification and the analysis of large datasets to determine optimal environmental and climatic conditions for selecting suitable locations for sustainable green buildings. Through these advanced tools, it becomes possible to predict temperature levels, wind speeds, and rainfall amounts, as well as to diagnose key soil problems, thereby helping to minimize potential natural and environmental risks and to forecast their occurrence in advance, as shown in Figure 1.
Figure 1. Methodology of work
2.1 Study area
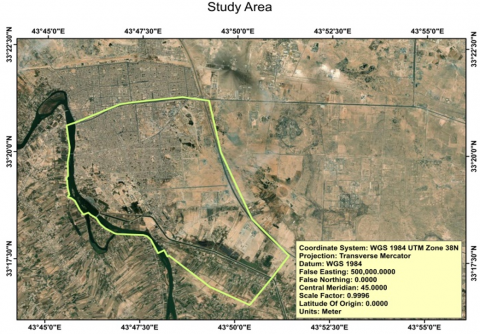
Figure 2 shows the boundaries of the study area, which lies within the geographical coordinates Latitude 33.337048°, Longitude 43.812410°. The area is estimated at about 45 square kilometres within the borders of the city of Fallujah, which is administratively affiliated with Anbar Governorate, and which is about 60 kilometres away from the capital city of Baghdad. The land is mostly flat (elevation from 41 to 55 m) and free of natural and man-made obstacles, except for the presence of a large industrial area that actually exists, which is land adjacent to the city of Fallujah.
Figure 2. Study area projected with WGS1984 datum
2.2 Preparing and collecting data
The study employed Landsat 8 OLI/TIRS imagery with a 30-meter spatial resolution, acquired in 2023, to evaluate environmental and spatial characteristics of the study area. The satellite images were obtained from the USGS Earth Explorer platform. At this stage, the first step after preparing the satellite image, the geometric correction is processed using ground control points (GCPs), which are obtained locationally using a GPS device (GPSMAP 67), with a total of 6 points. Then, the image is defined and projected with the coordinate system as shown in Table 1.
With rapidly advancing technology, collecting and analyzing data has become more accurate and effective for understanding climate change, air quality, and significant environmental damage through satellite imagery. To analyze criteria and automatically determine the importance of each criterion in satellite imagery using computer vision or deep learning techniques to accurately extract features. These features are then used in GIS software for evaluation purposes.
Table 1. GCPs taken by GPS
|
Point |
Easting (m) |
Northing (m) |
Z-Value |
|
1 |
389664.71 |
3689600.57 |
49 |
|
2 |
389947.62 |
3687455.65 |
48 |
|
3 |
386375.88 |
3687628.09 |
42 |
|
4 |
390638.97 |
3686439.02 |
47 |
|
5 |
388101.1 |
3685456.97 |
41 |
|
6 |
387364.35 |
3688947.15 |
44 |
2.3 Data analysis and natural resource evaluation
This step is done within a GIS program by performing spatial analyses such as overlay, buffer, and spatial statistics, coding, and mapping. The task of artificial intelligence in this step is to help interpret the phenomena present in the satellite imagery to identify Earth classifications in order to determine patterns and relationships between different variables. Criteria are identified that are compatible with the conditions of the study area, and then the weighted overlay tool is used within the GIS environment to reclassify land uses and assess their suitability to the predefined criteria for achieving sustainable development.
2.4 Environmental impact assessment and economic feasibility with final verification and urban planning
Multi-Criteria Decision Analysis (MCDA) is applied within a Geographic Information System (GIS) environment using the weighted overlay method, by multiplying the suitability value (reclassified) of each pixel by the weight of its layer, and then summing the results to produce a final suitability map and linking it to an easily updatable and modifiable geographic database. At this stage, the Geographic Information System (GIS) classifies the impacts on the Earth's surface, then represents them on environmental layers and maps.
GIS plays a major role in data analysis and prediction when combined with artificial intelligence, forming an integrated structure in geographic and spatial data analysis. Population density also plays a crucial role in shaping the quality of life within an area and, therefore, must be carefully considered during the planning and development process [23, 24]. GIS can be used to analyze geographic information, such as topographic maps, satellite images, and weather maps. This technique helps to identify the best places that meet all the requirements, as shown in Table 2.
Table 2. The role of GIS and AI in identifying the optimal location for sustainable buildings
|
Step |
Role of GIS |
Role of AI |
|
1. Defining Sustainability Criteria |
Creating spatial layers (soil, water, infrastructure). |
Use a deep learning tool inside GIS to help in classification |
|
2. Collecting Spatial Data |
Data used is represented by satellite imagery and databases. |
automatically process satellite images and recognize patterns |
|
3. Data Analysis and Natural Resource Evaluation |
Collect and analyze spatial data, such as Overlay and Spatial Statistics. |
Evaluating resources such as water |
|
4. Comparison of Alternatives & Final Planning |
Applying MCDA within GIS to select the most suitable site. |
Use a deep learning tool to analyze satellite images |
4.1 Area classification
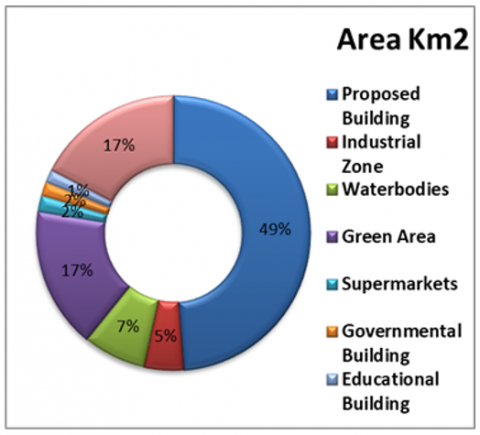
Figure 3 illustrates the land distribution and planning ratios according to the required needs. Next, create the shapefile (vector data) that will be used later in the deep learning tool. This area lacks adequate services and green spaces, which currently account for 17%, with the ambition of reaching 20–25% in accordance with international standards. Its location overlooking the Euphrates River and its proximity to a highway make it an ideal location for planning and achieving sustainable development. The efficiency of green spaces was evaluated by analysing area and location criteria, as well as climate temperatures. The spatial criterion serves as a constructive indicator of the capacity to employ green areas in environmentally beneficial ways. The examined region was categorized based on patterns of land utilization and the availability of natural and physical resources, as shown in Table 3.
Figure 3. Area of classified classes
Table 3. Classified classes and their area
|
Class |
Area, km2 |
|
Proposed Building |
20.78 |
|
Industrial Zone |
2 |
|
Water Bodies |
3.169 |
|
Green Area |
9.083 |
|
Supermarkets |
0.81 |
|
Governmental Building |
0.68 |
|
Educational Building |
0.66 |
|
Residential Area |
7.44 |
4.2 Application of the deep learning tool in GIS
The deep learning tool in ArcGIS was employed to automatically classify satellite imagery using artificial intelligence techniques. The main inputs included the target satellite image (Landsat 8) and deep learning model representative samples for the land cover categories (vector data), as illustrated in Figure 4. The process generated a classified raster output that visually and quantitatively represents land cover classes such as urban areas, vegetation, water bodies, and bare soil, as shown in Figure 5. These outputs were further utilized for spatial and statistical analyses, including change detection and area estimation, thereby enhancing the accuracy and interpretability of the spatial results. Access to the deep learning tool within GIS is one of the options for spatial analysis tools to use the image. The results and outputs from the analysis process are subsequently used in the weighted overlay process to determine the suitability of the predefined criteria for land use classifications.
Figure 4. Deep learning process
Figure 5. Land use map
4.3 Land use classification
The integration of diverse factors (e.g., environmental, social, and economic) into a single analytical process (such as the weighted superposition method, which will be discussed later). It would help create a balance between economic growth and the preservation of environmental resources, and planning decisions would be focused and accurate, as several layers of detailed information according to land uses are integrated, which supports the control of urban sprawl and the protection of vital ecosystems. The model promotes transparency and objectivity through reliance on modern technology. The industrial zone occupied 2% of the study area. It is an existing area and is distinguished by its strategic location along a transportation corridor. The site is situated on nearly flat, undeveloped land, with direct access to the highway and the main road network, giving it a sense of isolation toward the northern border, likely reducing pollution, noise, and traffic impact on residential areas. Highways and accessibility are among the most important factors that contribute to the commercial transport process and the logistical and industrial support for the city, due to the flexibility they provide in transporting goods and other items. Water bodies also occupy approximately 7% of the western and southwestern part of the study area, which gives it an opportunity for agricultural, tourism, and recreational investments, or water reservoirs can be built due to the area’s elevations that facilitate the water collection process. Furthermore, these bodies of water do not pose a risk of future flooding due to their suitable distance from the city's infrastructure.
This section focuses on managing green spaces and developing new parks or implementing urban afforestation initiatives to improve the urban environment in line with urban culture. The study revealed that the central-western region has a high percentage of dense green cover (60-70%) and a gradually moderate percentage of green cover (40-50%). This helps in identifying arid areas with low green spaces and in seeking to develop and strengthen the green belt.
4.4 Weighted overlay method
It is one of the most important spatial analysis tools within the Geographic Information System. It is an effective tool for detecting suitable locations based on multiple criteria defined by the user. These criteria include (height, slope, land uses, etc.), and each criterion has a weight according to its relative and spatial importance. Satellite imagery and GIS data were used to extract the values shown in Table 4. The digital elevation model is created because of its importance in identifying and extracting the elevations and slopes of the study area. This model revealed that the lowest point was 41 meters above sea level and the highest point was 56 meters. The weighted superposition method requires giving each criterion a certain weight according to its impact and importance to determine the optimal location for sustainability. This weighting method reflects the nature of the environmental characteristics in the studied area, in addition to the principles of sustainable planning upon which this research is based.
Table 4. Land sustainability development criteria
|
Constraints |
Criteria/ Attributes |
Points |
Suitability Class |
Influence % |
|
Elevation |
41 - 47 |
1 |
1st degree |
30% |
|
48 - 50 |
2 |
2nd degree |
||
|
51 - 53 |
3 |
3rd degree |
||
|
54 - 56 |
4 |
4th degree |
||
|
Slope |
< 0.029 |
1 |
1st degree |
20% |
|
0.03 - 0.058 |
2 |
2nd degree |
||
|
0.059 - 0.087 |
3 |
3rd degree |
||
|
0.088 - 0.12 |
4 |
4th degree |
||
|
Water proximity |
55 - 67 |
1 |
1st degree |
25% |
|
41 - 54 |
2 |
2nd degree |
||
|
28 - 40 |
3 |
3rd degree |
||
|
14 - 27 |
4 |
4th degree |
||
|
Land use |
Roads < 15% |
1 |
1st degree |
25% |
|
Water < 40% |
2 |
2nd degree |
||
|
Built-up: 20 - 50% |
3 |
3rd degree |
||
|
Veg.: 20 - 40% |
4 |
5th degree |
The Global Positioning System (GPS) was used to obtain elevation data for the study area. To establish appropriate criteria for spatial analysis, the elevation data were processed, and the digital elevation model was reclassified. The elevation factor was given higher weight due to its significant impact on the sustainability and stability of the infrastructure and the ecological balance of the site.
Previous studies that specialized in geographical and environmental planning contributed to determining the weights shown in Table 4, with the help of the researcher’s field survey and review of the site conditions of the study area [25, 26].
Determining the weight of each criterion depends on the importance of this element and the extent of its impact. When determining an impact factor for height (30%), it comes within its important to the safety of infrastructure and the efficiency of the use of environmental resources. It is a long-term, effective element as it is one of the foundations of infrastructure. According to LEED and ISO 14001 standards for low-impact design and energy efficiency, the lowest natural height within safe hydrological and geological limits is considered ideal.
As for slopes, their importance lies in balancing water drainage and building foundations. The high construction costs are among the things that must be taken into consideration, and an accurate engineering feasibility study that suits sustainable development must be prepared. The slope factor is one of the elements that must be determined to be suitable for planning, and acceptable ratios have been determined between 0.03 and 0.087, and the percentage of its impact has been determined (20) because of its impact on soil erosion and the lateral slopes that determine the direction of sewage.
Water proximity (25%) reflects the balance between accessibility and flood risk; areas within safe buffer distances (55–67 m) were rated most suitable to ensure sustainable water use and minimize hazard exposure.
Finally, land use (25%) incorporates spatial compatibility, where proximity to existing roads and moderate vegetation cover indicate high development potential with minimal ecological disruption.
Collectively, these criteria were standardized and integrated in the Weighted Overlay Tool in ArcGIS to derive the final land suitability index, ensuring that both environmental safety and sustainable design objectives were addressed systematically.
4.5 Seasonal distribution of precipitation in the study area
Figure 6 illustrates the rainfall rate in the study area, with the wettest period being from November to April and the driest period being from May to October. April records the highest rainfall (26.8 mm). Based on this information, the focus should be on collecting and storing water during the rainy season for use during the dry season, given the arid desert climate of the study area.
Figure 6. Rainfall rate
5.1 Discussion
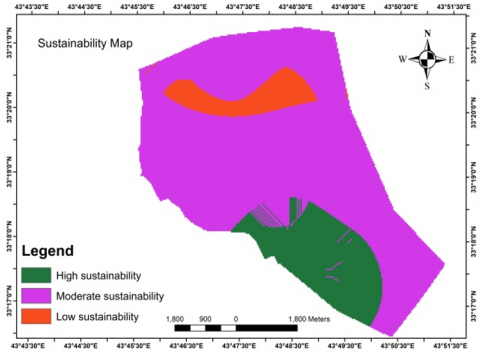
Figure 7 shows three main categories of spatial sustainability levels within the study area: 26% is highly suitable, 68% is moderately suitable, and 6% is of low suitability. Each level reflects the area’s ability to achieve sustainability according to the criteria used. These were obtained using a weighted superposition analysis method based on a set of environmental, social, and economic criteria (level, water bodies, land use, and slope). The use of deep learning, which is one of the artificial intelligence tools within GIS, was employed to increase the accuracy of land use classification, which proved effective in integrating many spatial and environmental criteria to produce a quantitative assessment of the level of sustainability, and thus provide a comprehensive picture of spatial sustainability. Highly sustainable areas are concentrated in the southeastern part of the study area. Landsat 8 satellite imagery from 2023, with a spatial resolution of 30 meters, was used, which contributed to improving the accuracy of the spatial analysis results. The percentages of the criteria were entered according to the importance of each criterion and its environmental and social impact. The largest percentage was adopted for elevations, as they play a major role in land use, and then the slopes, which reflect the nature of the land surface. Determining the locations of the slope analysis contributes to directing spatial planning towards the safest and most environmentally stable areas. When comparing this study with previous studies, it is distinguished by its focus on spatial information in addition to analyzing satellite images and by using the most influential ratios and weights in the study area through the weighted overlay method.
Figure 7. Suitability map
The study contributes to bridging a local knowledge gap by presenting a spatial model that can be applied in other Iraqi cities to assess sustainability according to measurable spatial criteria and analysis.
5.2 Conclusion
This study concludes the importance of integrating advanced technologies in the field of sustainable construction, including using a deep learning tool with GIS. This allows engineers and planners to provide more efficient and sustainable building designs, contributing to the construction of healthier and more resilient cities. It also provides accurate classification of land cover and land use, environmental change monitoring, mapping, and modeling using automated identification by deep learning in GIS. Using artificial intelligence sites (ChatGPT, Geminim, etc.) with GIS saves effort and time through automatic analysis and processing of data, unlike previous studies that focused on the subject of GIS only. The results revealed significant spatial variations in sustainability levels, highlighting areas with high environmental potential and others requiring improvement through sustainable planning interventions. The findings confirm that integrating geospatial techniques with sustainability indicators provides a reliable decision-support tool for guiding land-use planning and promoting environmentally responsible development. In this study, GIS, used to interpret and analyze spatial data, was integrated with deep learning tools to recognize satellite images and classify raster data layers exported from GIS software, which helped improve the analysis and interpretation process. GIS was primarily relied upon in interpreting spatial data, and artificial intelligence within the system contributed through systems known as deep learning, which is used to identify, interpret, and classify land uses within satellite imagery and to reclassify the raster data layers exported from GIS software. The use of this tool within the GIS environment is among the tools that achieve integration between modern technologies for the purpose of improving access accuracy in identifying spatial patterns, classifying usage of interest, and verifying visual outputs. For the purpose of achieving transparency in sustainable decision-making related to water management, land suitability, and non-human bias, the large language model (LLM) is one of the most important tools that has contributed to this. Its role in this research was limited to serving as an aid to analyzing environmental and spatial data descriptions, improving the accuracy of interpretation, and creating mutually validated analyses between rainfall distribution, elevation, slope, and land use classification.
Although this study provided valuable perceptions for evaluating spatial sustainability through weighted overlay analysis in GIS, the robustness and applicability of its results require addressing some methodological limitations. First, the reliance on Landsat 8 images with low spatial resolution (30 meters) limited the detection of subtle variations in land use. Second, the study relied on skilled opinions and individual knowledge to determine the classification and weighting of parameters in the weighted overlap analysis, which opens the door to human bias and reduces the objectivity of the results. Therefore, future studies are recommended to use higher-resolution data sources (such as Sentinel-2) and adopt structured quantitative approaches (such as AHP or machine learning) to determine the weights.
[1] Chen, G., Long, X., Wu, C., Zhao, J. (2024). Urban spatial pattern optimization based on "Double Evaluation": A case study of urban agglomeration in Central Yunnan, China. Sustainability, 16(24): 11031. https://doi.org/10.3390/su162411031
[2] Niravita, A., Suhadi, S., Wahanisa, R., Wedhatami, B., Arifin, R. (2022). Digitalization of spatial planning tourism village on minimizing spatial violations. AIP Conference Proceedings, 2573(1): 030020. https://doi.org/10.1063/5.0110472
[3] Abdullah, S., Hussain, N.H.M., Haron, N., Jalil, S.A., Osoman, M.A. (2023). GIS-Based interactive technology in demographic record management and mapping towards sustainable community. International Journal of Sustainable Construction Engineering and Technology, 14(3): 366-375.
[4] Yeh, A.G. (2024). From urban modelling, GIS, the digital, intelligent, and the smart city to the digital twin city with AI. Environment and Planning B: Urban Analytics and City Science, 51(5): 1085-1088. https://doi.org/10.1177/23998083241249552
[5] Sameer, M.K., Hamid, A.M. (2022). Evaluation of accuracy GPS and automatic level instruments in topographic surveying. International Journal on Technical and Physical Problems of Engineering, 14(4): 75-79.
[6] Frimpong, A., Kwabena Forkuo, E., Jnr, E.M.O. (2024). The effect of land use land cover types on MODIS land surface temperature in Ghana. Cogent Engineering, 11(1): 2411865. https://doi.org/10.1080/23311916.2024.2411865
[7] Sapitang, M., Dullah, H., Latif, S.D., Ng, J.L., Huang, Y.F., Malek, M.B.A., Elshafie, A., Ahmed, A.N. (2024). Application of integrated artificial intelligence geographical information system in managing water resources: A review. Remote Sensing Applications: Society and Environment, 35: 101236. https://doi.org/10.1016/j.rsase.2024.101236
[8] Ramos, K.S.G., Peramo, E.C. (2024). Optimizing Healthcare accessibility: An integration of GIS and machine learning for strategic hospital facility location planning. In 2024 International Conference on Artificial Intelligence in Information and Communication (ICAIIC), Osaka, Japan, pp. 158-163. https://doi.org/10.1109/ICAIIC60209.2024.10463219
[9] Zaroujtaghi, A., Mansourihanis, O., Tayarani, M., Mansouri, F., Hemmati, M., Soltani, A. (2025). A systematic review of GIS Evolution in transportation planning: Towards AI integration. Future Transportation, 5(3): 97. https://doi.org/10.3390/futuretransp5030097
[10] Oraiopoulos, A., Howard, B. (2022). On the accuracy of urban building energy modelling. Renewable and Sustainable Energy Reviews, 158: 111976. https://doi.org/10.1016/j.rser.2021.111976
[11] Yeo, I.A., Yoon, S.H., Yee, J.J. (2013). Development of an Environment and energy Geographical Information System (E-GIS) construction model to support environmentally friendly urban planning. Applied Energy, 104: 723-739. https://doi.org/10.1016/j.apenergy.2012.11.053
[12] Anand, A., Deb, C. (2024). The potential of remote sensing and GIS in urban building energy modelling. Energy and Built Environment, 5(6): 957-969. https://doi.org/10.1016/j.enbenv.2023.07.008
[13] Jin, X., Zhang, C., Xiao, F., Li, A., Miller, C. (2023). A review and reflection on open datasets of city-level building energy use and their applications. Energy and Buildings, 285: 112911. https://doi.org/10.1016/j.enbuild.2023.112911
[14] Deng, Z., Chen, Y., Yang, J., Chen, Z. (2022). Archetype identification and urban building energy modeling for city-scale buildings based on GIS datasets. Building Simulation, 15(9): 1547-1559. https://doi.org/10.1007/s12273-021-0878-4
[15] Ijaz, M.S., Awan, M.F., Ashraf, J., Ajaz, M., Iqbal, A., Rashid, H. (2023). The applications of artificial intelligence in data science, big data analytics, cybersecurity, GIS and nanotechnology. In 2023 2nd International Conference on Emerging Trends in Electrical, Control, and Telecommunication Engineering (ETECTE), Lahore, Pakistan, pp. 1-5. https://doi.org/10.1109/ETECTE59617.2023.10396814
[16] Campo-Ruiz, I. (2025). Artificial intelligence may affect diversity: Architecture and cultural context reflected through ChatGPT, Midjourney, and Google Maps. Humanities and Social Sciences Communications, 12(1): 1-13. https://doi.org/10.1057/s41599-024-03968-5
[17] Sudha, C., Bostani, A., Sudha, S. A., Elangovan, T., Nandhini, C., Kurbonov, Z. (2024). Innovations in geospatial data analysis: Applied nonlinear analysis, remote sensing, AI, and GIS for environmental sustainability. Innovations, 31(6s).
[18] Hamano, M., Shiozawa, S., Yamamoto, S., Suzuki, N., Kitaki, Y., Watanabe, O. (2023). Development of a method for detecting the planting and ridge areas in paddy fields using AI, GIS, and precise DEM. Precision Agriculture, 24(5): 1862-1888. https://doi.org/10.1007/s11119-023-10021-z
[19] Shen, Y., Xu, Y., Kong, W., Fei, F., Chen, X., Huang, C., Yao, J. (2023). Using GeoAI to reveal the contribution of urban park green space features to mitigate the heat island effect. In Proceedings of the 41st International Conference on Education and Research in Computer Aided Architectural Design in Europe (ECAADe).
[20] Kayusi, F., Chavula, P. (2025). Enhancing urban green spaces: AI-driven insights for biodiversity conservation and ecosystem services. LatIA, 3: 87.
[21] Farooqi, S.M., Kanwal, A., Zaman-ul-Haq, M., Saqib, Z., Akhtar, N., Tariq, A., Abdullah-Al-Wadud, M., Mubbin, M., Bokhari, S.A. (2025). Integrating Geo-AI with RS & GIS for comprehensive assessments of urban land cover transformations and integrated responses. Environmental Earth Sciences, 84(1): 3. https://doi.org/10.1007/s12665-024-12005-2
[22] Anand, S., Kumar, H., Kumar, P., Kumar, M. (2025). Analyzing landscape changes and their relationship with land surface temperature and vegetation indices using remote sensing and AI techniques. Geoscience Letters, 12(1): 7. https://doi.org/10.1186/s40562-024-00372-4
[23] Hajar, S. (2022). Visualization of road access using GIS based on GNSS observation at Taman Universiti Parit Raja, Batu Pahat. Recent Trends in Civil Engineering and Built Environment, 3(1): 222-232.
[24] Marey, A., Zou, J., Goubran, S., Wang, L.L., Gaur, A. (2025). Urban morphology impacts on urban microclimate using artificial intelligence–A review. City and Environment Interactions, 28: 100221. https://doi.org/10.1016/j.cacint.2025.100221
[25] Peduzzi, P., Lynggaard, J.R., Chuah, S. (2022). Sand and Sustainability: 10 Strategic Recommendations to Avert a Crisis. GRID-Geneva, United Nations Environment Programme: Geneva, Switzerland. https://discovery.ucl.ac.uk/id/eprint/10206341/.
[26] Hallas, N.E. (2024). LEED certification and sustainable building practices: A comprehensive guide to efficient and sustainable facilities. In Design Strategies for Efficient and Sustainable Building Facilities, pp. 124-161. https://doi.org/10.4018/979-8-3693-3200-9.ch006