Rizka Maria*![]() | Heri Nurohman
| Heri Nurohman![]() | Hilda Lestiana
| Hilda Lestiana![]() | Ernowo Ernowo
| Ernowo Ernowo![]() | Jakah Jakah
| Jakah Jakah![]() | Riostantieka Mayandari Shoedarto
| Riostantieka Mayandari Shoedarto![]() | Eki Naidania Dida
| Eki Naidania Dida![]() | Yudi Rahayudin
| Yudi Rahayudin![]() | Nurul Fahimah
| Nurul Fahimah![]() | Willy Cahya Nugraha
| Willy Cahya Nugraha![]()
© 2025 The authors. This article is published by IIETA and is licensed under the CC BY 4.0 license (http://creativecommons.org/licenses/by/4.0/).
OPEN ACCESS
This study investigates the origin, distribution, and ecological and health risks of heavy metals in soils within the Wayang Windu geothermal field, West Java, Indonesia. Significant sources of heavy metals were identified by analyzing geochemical interactions influenced by geothermal activity and anthropogenic factors, using Pearson’s correlation and principal component analysis (PCA). Four geogenic sources were determined: hydrothermal mineralization (Cu, Zn), lithogenic weathering (Cr, Pb), redox-sensitive mobilization (Fe, Mn), and geothermal emissions (As). Ecological risk was assessed using several indices—Contamination factor (CF), geo-accumulation index (Igeo), enrichment factor (EF), pollution load index (PLI), and potential ecological risk index (PERI)—which revealed arsenic as the dominant pollutant. The maximum arsenic concentration reached 151.92 mg/kg, particularly at high-risk sites such as W26 and W20. Moderate contamination levels were observed for Pb, Cr, and Cu, while Zn, Fe, and Mn remained below critical thresholds. Health risk assessments highlighted the elevated vulnerability of children to both non-carcinogenic and carcinogenic effects due to higher exposure to arsenic, lead, iron, and zinc. The Incremental Lifetime Cancer Risk (ILCR) values indicated that arsenic posed the greatest carcinogenic risk, with values of 6.20×10⁻⁴ for children and 6.64×10⁻⁵ for adults—both exceeding the acceptable risk threshold via ingestion. In contrast, dermal exposure posed significantly lower risks. These findings underscore the urgent need for targeted soil remediation and public health interventions, particularly in geothermal-agricultural interface zones.
heavy metal, soil, geothermal. ecological impact, health risk, hydrothermal mineralization, lithogenic weathering
Soil is an imperative resource for most organisms on the ground, an essential element of terrestrial ecosystems, and a critical asset for human survival and agricultural output [1]. Furthermore, natural sources, including parent materials and volcanic eruptions, can serve as substantial contributors to heavy metal contamination in agricultural soils [2, 3]. These sources are predominantly spread on a regional basis for particular geological formations [4]. Hydrothermal activity is capable of moving heavy metal-rich fluids underneath the earth to the surface, whereas volcanic eruptions could release particulate-associated metals into the surrounding environment [5]. However, although numerous studies in various countries have linked heavy metal contamination to volcanic and geothermal activities [6-9], similar research remains very limited in Indonesia [10, 11]. Yet, natural geochemical processes in these regions play a crucial role in the mobilization and transformation of heavy metals. Therefore, a more comprehensive understanding of the dynamics of heavy metal contamination in volcanic and geothermal environments in Indonesia is essential to assess its potential risks to ecosystems and human health.
Geothermal regions, recognised for their renewable energy potential, are frequently geochemically active areas where subsurface heat processes mobilise naturally occurring materials, including hazardous heavy metals [4]. Leaching from thermal water activities can significantly increase the deposition of heavy metals in adjacent soils due to the geochemical enrichment of these waters through subsurface interactions [12]. Heavy metals, such as cadmium, lead, arsenic, and mercury, have been recognized for their significant toxicity, environmental persistence, and propensity to bioaccumulate in organisms [13]. These pollutants could accumulate in adjacent soils, potentially changing microbial ecosystems, hindering plant growth, and infiltrating the food chain, thereby posing threats to both environmental integrity and public health [14].
Several researchers employ an extensive understanding of statistics, geology, ecology, and other fields to evaluate the degree of enrichment and ecological risk [1, 15-22]. The study utilises various geochemical indices, such as the contamination factor (Cf), geo-accumulation index (Igeo), and potential ecological risk index (PERI), to quantify the extent and severity of contamination, thereby evaluating the degree of pollution and its ecological impacts. Simultaneously, human health risk assessments utilise models like the Hazard Quotient (HQ) and Lifetime Cancer Risk (LCR) to predict the likelihood of negative health effects from exposure through ingestion and dermal pathways. Investigating the origins and paths of these contaminants is crucial for formulating sustainable land management plans that reconcile economic development with environmental care [23].
The Wayang Windu volcano in West Java, Indonesia, is located in a geologically active region affected by both historical and contemporary volcanic and geothermal phenomena [24]. The Wayang Windu geothermal field in Pangalengan, West Java, is located in an active volcanic region created by the subduction of the Indo-Australian plate beneath the Eurasian plate [25].
This area was selected as the study site based on the findings of Fahimah et al. [20], which indicated the presence of heavy metals associated with volcanic and geothermal activities in the Wayang Windu region. The presence of fault zones serves as migration pathways for hydrothermal fluids that transport heavy metal elements [26]. In addition, the high temperature and intense gas flux in the system can accelerate the geochemical mobilization and transformation of metals [27], thereby increasing the potential for heavy metal accumulation in agricultural areas. These heavy metals may pose risks to human health by entering the food chain [28].
This study aims to: (1) investigate the presence of heavy metals in soils within the Wayang Windu area; (2) identify the potential sources of these metals; and (3) assess the associated ecological and human health risks posed by these contaminants. The investigation attempts to deliver practical insights for policymakers, land managers, and local stakeholders by integrating environmental chemistry and public health frameworks. The focus of this project is to facilitate an adjustment to more resilient and sustainable land-use practices in pressured volcanic settings.
2.1 Study area
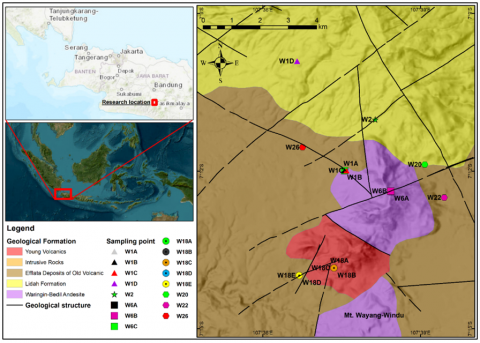
The research was conducted in the Wayang Windu region, located in the volcanic zone of South Bandung, West Java, Indonesia. This site is geographically situated between longitudes 107°32'E and 107°44'E, and latitudes 7°04'S and 7°16'S are displayed in Figure 1. The regional geological maps indicate the following rock units in the research area [29]. The geology of the Wayang Windu geothermal region in West Java is influenced by a complex volcanic history, consisting of young volcanic rocks from Mount Wayang and Mount Windu, intrusive andesitic-dioritic bodies contributing as heat sources, and older effusive deposits from prior eruptions. Stratigraphically, it includes the Lidah Formation, which consists of volcaniclastic deposits and paleosols, as well as the Waringin Bedil Andesite, a dense, fractured lava unit resulting from earlier volcanic activity.
Figure 1. Geological condition in Wayang Windu, West Java Province [29]
2.2 Sampling procedures, digestion, and determination
The sampling locations in this study were selected based on the proximity to geothermal outlets and accessible surface hydrothermal characteristics. This focused methodology attempted to identify regional variability resulting from geothermal discharges. Sixteen sampling sites were strategically positioned around the Wayang Windu geothermal region to encompass various geochemical zones.
Soil columns were obtained from each sub-unit and categorized by depth. The samples were obtained from a depth of 0 to 25 cm with stainless steel scoops. The quartile technique was employed to create representative samples for each depth layer. This internal replication facilitated statistical analysis and error estimation. Sampling occurred on April 12, 2025. The weather was arid and consistent, with no precipitation, an ambient temperature of around 22℃, and minimal wind activity. These conditions were optimal for reducing moisture-related variability and ensuring homogeneous sample quality.
The samples were subsequently preserved and analysed in accordance with the EPA Method 200.8 protocols for heavy metal elements [30]. During the transfer from the location to the laboratory for examination, sediment samples were contained in plastic bags. Soil samples were obtained from the field, underwent digestion before the detection of heavy metals [31]. The collected soil samples were dried at ambient temperature to avoid chemical losses. Dried materials were pulverized with a mortar and subsequently sieved through a 200 mesh (aperture 0.074 mm) shaker sieve to get a homogeneous sample. The digestion employed 25 ml of nitric acid (HNO₃). The combination of the acid and soil sample was heated to 100℃ for 10–15 minutes until the samples were completely diluted and the solution was entirely clear [32]. Completely elements used were of investigative quality above, and Milli-Q liquid was utilised consistently throughout the operation [33]. Atomic absorption measurements were conducted on a Shimadzu AA-7000.
The method was validated based on essential analytical parameters. The linearity for arsenic (As), chromium (Cr), copper (Cu), lead (Pb), zinc (Zn), iron (Fe), and manganese (Mn) was evaluated by calculating the correlation of determination (R²) from the calibration curve for each element, with the requirement ≥ 0.995. The calibration curve of these elements showed R² ≥ 0.995, indicating a strong correlation between concentration and element response.
Precision was assessed through repeatability (same analyst, day, instrument), measured as coefficients of variance (CV, %RSD). The repeatability of As, Cr, Cu, Pb, Zn, Fe, and Mn was obtained at 9.47% RSD, 6.81% RSD, 6.42% RSD, 4.34% RSD, 3.12% RSD, 4.52% RSD, and 1.35% RSD, respectively. Accuracy was determined using recovery (% recovery) from spiked samples: 100.55% for As, 99.95% for Cu, 104.7% for Cr, 92.7% for Pb, 93.12% for Zn, 91.12% for Fe, and 93.48% for Mn, respectively. All of the elements were found to be within the acceptable range of 90-110%. Based on this, the method performed accurately and precisely.
Limits of detection (LoD) of elements calculated by three standard deviations (3SD) of the blanks were 0.26 µg/kg for As, 0.01 mg/kg for Cr, 0.004 mg/kg for Cu, 0.03 mg/kg for Pb, 0.002 mg/kg for Zn, 0.01 mg/kg for Fe, and 0.04 mg/kg for Mn. Limits of quantitation (LoQ) determined as 10 standard deviations (10SD) of the blanks were 0.086 µg/kg for As, 0.03 mg/kg for Cr, 0.01 mg/kg for Cu, 0.08 mg/kg for Pb, 0.007 mg/kg for Zn, 0.03 mg/kg for Fe, and 0.01 mg/kg for Mn, confirming that the method can effectively quantify until this lowest concentration. Average concentrations of standard and sample were calculated in triplicate.
2.3 Statistical analysis for source identification
The interactions among heavy metals suggest that their presence could originate from similar sources or exhibit similar geochemical characteristics [34]. The Pearson correlation was applied to evaluate the correlation value between the heavy metals [35]. Principal component analysis (PCA) was applied to simplify the complexity indices into a simpler range of comprehensive indices, frequently used to investigate the pollution sources of heavy metals [36]. PCA and Pearson correlation analyses were conducted in SPSS 26.0. Prior to conducting PCA, all heavy metal concentration data were normalized using z-score standardization to ensure comparability across variables with different units and scales [37]. Principal components were extracted based on the Kaiser criterion, retaining components with eigenvalues greater than 1 [38-40]. These components were interpreted based on rotated factor loadings using Varimax rotation to enhance interpretability [38, 40].
2.4 Assessment of environmental contamination
Evaluating the heavy metal contamination necessitates an assessment of the potential influences on ecologies and human well-being [41]. Numerous methodologies are available for measuring and depicting the degree of heavy metal accumulation in sediments from polluted areas [42-44].
2.4.1 Contamination factor (CF)
The CF is an index used to assess heavy metal pollution in soil by comparing the concentration of each metal in a sample to its respective geochemical background value [42]. This index is calculated using Eq. (1).
$C F_{\mathrm{i}}=\frac{C_{\mathrm{i}}}{C b}$ (1)
where, Cᵢ: Concentration of heavy metal in soil (mg/kg or mg/L); Cb: Background concentration of heavy metal (natural or reference value, mg/kg or mg/L). The background concentrations for Pb, Zn, Cr, Fe, Mn, Cu, Hg, and As are 20 mg/kg, 95 mg/kg, 90 mg/kg, 47200 mg/kg, 850 mg/kg, 45 mg/kg, 0.4 mg/kg, and 13 mg/kg, respectively [45]. Contamination levels: CF < 1: low contamination, 1 ≤ CF < 3: moderate contamination, 3 ≤ CF < 6: considerable contamination, and CF ≥ 6: very high contamination.
2.4.2 Geo-accumulation index (Igeo)
The Igeo is utilised for soil assessment, taking into consideration both natural and anthropogenic influences [31]. Eq. (2) was developed to calculate this index [42].
${Igeo} =log _2\left(\frac{C_{{i}}}{1.5 \times C_b}\right)$ (2)
where, Cᵢ: concentration of heavy metals absorbed in the soil, Cb: the natural background level. The constant value of 1.5 is employed to mitigate the impact of lithologic variation [19]. The Igeo ≤ 0: unpolluted; 0 ≤ Igeo ≤ 1: slight pollution; 1 ≤ Igeo ≤ 2: moderate pollution; 2 ≤ Igeo ≤ 3: moderately to highly concerning. A range between 3 and 4 reflects strong pollution, between 4 and 5 means very strong pollution, and > 5 points indicate extreme pollution, signifying severe environmental contamination.
2.4.3 Enrichment factor (EF)
The EF can be employed to determine a certain metal in sediment originating from anthropogenic or natural sources [42, 46]. Eq. (3) was developed to calculate this index.
$E F=\frac{\left(C_{\mathrm{i}} / C_r\right)}{\left(B_{\mathrm{i}} / B_r\right)}$ (3)
where, Cr: the reference metal concentration, Bᵢ: heavy metal background concentration, and Br: the reference metal background concentration. The EF are categorized: EF ≤ 1: non-enrichment, 1 ≤ EF < 3: minor enrichment, 3 ≤ EF < 5: moderate enrichment, 5 ≤ EF < 10: moderately high, 10 ≤ EF < 25: high enrichment, EF > 25: very high enrichment.
2.4.4 Pollution load index (PLI)
The PLI provides the assessment of the overall contamination level of the soil at the examined location, predicated on the cumulative concentration of all analysed elements [31]. Eq. (4) is employed to compute this index.
$P L I=\left(C F_1 \times C F_2 \times C F n\right) 1 / n$ (4)
where, CF denotes the contamination factors for each element, and n represents the total number of elements. The PLI levels: PLI = 0: unpolluted soils, PLI = 1: pollution is present, PLI > 1: deteriorated site quality.
2.4.5 Potential ecological risk index (PERI)
The PERI is a methodology employed to evaluate the effects of heavy metal pollution on the environment [42]. PERI conducts a comprehensive assessment of heavy metal content and ecological sensitivity related to them [47]. Eqs. (5)-(7) is utilised to calculate this index.
$C_f^i=C_D^i / C_R^i$ (5)
$E_R^i=T_R^i / C_f^i$ (6)
$R I=\sum_{i=1}^m E_R^i$ (7)
This index integrates three fundamental components: contamination degree ($C_D^i$), toxic-response factor ($T_R^i$), and potential ecological risk factor ($E_R^i$). Contamination levels are categorized as follows: RI ≤ 90: low risk, 90 < RI ≤ 180: moderate risk, 180 < RI ≤ 360: signifies considerable risk, 360 < RI ≤ 720, and RI > 720: very high risk.
2.5 Human health risk assessment
Health risk assessment primarily entails evaluating the likelihood and attributes associated with health effects on diverse human populations potentially exposed to various toxic heavy metals from contaminated environmental sources, including soils, that might appear under current conditions or future scenarios [48, 49]. The health risk assessment is performed in four phases: 1) Hazard identification; 2) Dose-response assessment; 3) Exposure assessment; and 4) Risk categorisation [50]. This study assessed the health risks linked to children's and adults' exposure to potentially toxic heavy metals from anthropogenically affected soils, employing the non-carcinogenic risk indices Hazard Quotient (HQ) and Hazard Index (HI), along with the Incremental Lifetime Cancer Risk (ILCR) [50-53].
2.5.1 Exposure assessment
Risk assessment depends on the investigation of human exposure to soil via three specific pathways: ingestion, inhalation, and dermal contact [50-53]. The present research focused on the ingestion and dermal contact pathways, as these are regarded as the principal routes resulting in adverse human health effects from exposure to polluted soils [53]. The United States Environmental Protection Agency (USEPA) has developed a thorough approach for evaluating potential health concerns. In alignment with this paradigm, equations were utilized to compute the intake dosages for ingestion and dermal exposure, as detailed in references [51-54], with Eqs. (8) and (9) were formulated to facilitate this evaluation.
$A D I_{i n g}=\frac{C i \times I R s \times E F \times E D}{B W \times A T} \times C F$ (8)
$A D I_{ {der }}=\frac{C i \times S A \times A B S \times A F \times E D \times E F}{B W \times A T} \times C F$ (9)
The reference levels for heavy metal toxicity and the carcinogenic slope factors were derived from the cited materials to ensure consistency with internationally recognized risk assessment methodologies. These values were carefully selected to align with global standards and to facilitate meaningful comparisons with other assessments, as presented in Table 1 [51-54].
Table 1. Definitions and variable values utilised for human health risk assessment
|
Parameters |
Unit |
Definition |
Value |
|
ADIing |
mg/kg/day |
Average daily intake via ingestion contact exposure pathways |
- |
|
ADIder |
mg/kg/day |
Average daily intake via dermal contact exposure pathways |
|
|
Ci |
mg/kg |
Concentration of trace metals in sediment |
- |
|
IRs |
mg/day |
Ingestion rate of sediment |
200 for children and 100 for adults |
|
EF |
days/year |
Exposure frequency |
365 for children and 365 for adults |
|
ED |
years |
Exposure duration |
6 for children and 30 for adults |
|
CF |
unitless |
Conversion factor |
0.000001 |
|
ABS |
unitless |
Dermal absorption factor |
0.1 for all trace metals |
|
BW |
kg |
Average body weight |
15 for children and 70 for adults |
|
AT |
day |
Average lifetime |
2190 for children; 10,950 for adults |
|
AF |
mg cm2/day |
Skin adherence factor |
0.2 for children and 0.07 for adults |
|
SA |
cm2 |
The exposed skin surface area |
2100 for children and 5700 for adults |
|
RFDing. |
mg/kg/day |
Reference dosage (ingestion) |
Pb = 0.0035; Zn = 0.3; Fe = 0.7; Mn = 0.14; Cr = 0.003; Cu = 0.37; As = 0.0003 |
|
RFDder. |
mg/kg/day |
Reference dosage (dermal contact) |
Pb = 0.0052; Zn = 0.3 Mn = 0.0098; Cr = 0.003; As = 0.0003 |
|
CSFing |
(mg/kg/day)⁻¹ |
Cancer slope factor (ingestion) |
Pb = 0.0085, Cr = 0.5; As = 1.5 |
|
CSFder |
(mg/kg/day)⁻¹ |
Cancer slope factor (dermal contact) |
Pb = 0.0085, Cr = 2.8; As = 1.5 |
|
ILCR |
unitless |
Incremental Lifetime Cancer Risk |
2.5.2 Non-carcinogenic health risk assessment
The non-carcinogenic health risk of each metal was assessed by calculating its Hazard Quotient (HQ), derived from the ratio of the estimated intake value to the reference dose (RfD) [51-54]. The RfD denotes the reference dose for the consumption of a certain metal. The computation of this index utilized Eqs. (10) to (12), as advised in the referenced sources [51-54]:
$H Q_{i n g}=\frac{A D I_{i n g C i}}{R F D_{i n g C i}}$ (10)
$H Q_{{der }}=\frac{A D I_{ {der } C i}}{R F D_{ {der } C i}}$ (11)
$H I_{C i}=\sum H Q_{C i}=H Q_{i n g C i}+H Q_{d e r C i}$ (12)
where, $R F D_{{ingCi }}$ refers to the reference dose for chronic toxicity of heavy metals through ingestion, measured in mg/kg/day, while $A D I_{ {ingCi }}$ represents the average daily intake of heavy metals from soil ingestion, also expressed in mg/kg/day. $H I_{C i}$ is the hazard index indicates the non-carcinogenic risk of heavy metals in soil. Hazard Quotient (HQ) levels are categorized as follows: HQ ≤ 1 indicates no risk, 1 < HQ ≤ 10 indicates low risk, 10 < HQ ≤ 100 indicates moderate risk, and HQ > 100 indicates high risk. Similarly, Hazard Index (HI) levels are classified as: HI ≤ 10 for low risk, 10 < HI≤ 100 for moderate risk, and HI > 100 for high risk.
2.5.3 Carcinogenic health risk assessment
Exposure to contaminated soil can lead to carcinogenic effects in humans [51-56]. In this study, lead (Pb), chromium (Cr), arsenic (As), and mercury (Hg) were identified as carcinogenic agents, and the overall carcinogenic risk was assessed using Eqs. (13) and (14). Due to the absence of defined cancer slope factors (CSFs) for metals such as zinc (Zn), iron (Fe), manganese (Mn), and copper (Cu), carcinogenic risk assessment could not be conducted for these elements. The Incremental Lifetime Cancer Risk (ILCR) estimates the probability of developing cancer over a lifetime due to exposure to carcinogenic substances. ILCR values are typically classified into risk categories as follows: ILCR < 1×10⁻⁶ indicates negligible risk, 1×10⁻⁶ ≤ ILCR < 1×10⁻⁴ indicates acceptable or low risk, and ILCR ≥ 1×10⁻⁴ indicates high risk. These classifications support informed decision-making regarding the management and mitigation of risks associated with potential carcinogenic chemical exposure [51-56].
$I L C R_{( {ing;der})}=A D I_{\left({ing;der }_{C i}\right)} \times C S F_{\left({ing;der }_{C i}\right)}$ (13)
$I L C R_{C i}=\sum I L C R_{C i}=I L C R_{i n g C i}+I L C R_{d e r C i}$ (14)
3.1 Heavy metal concentrations of soils in Wayang Windu
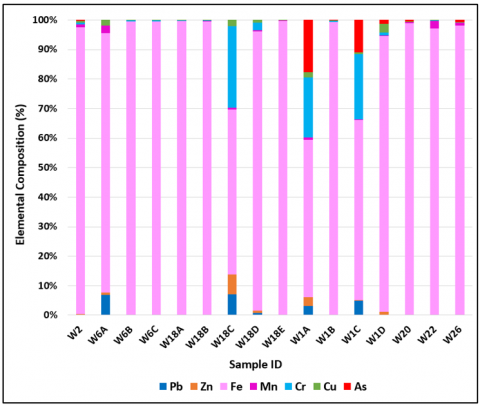
The soils of the Wayang Windu volcanic region exhibit a diverse array of heavy metal concentrations, indicative of both natural geochemical and anthropogenic processes. The average values derived from the examined metals exhibited the following trend: Fe > Mn > Cr > As > Cu > Pb > Zn, as present in Figure 2.
Figure 2. Heavy metal concentrations in the Wayang Windu
Iron (Fe) is the predominant element, with values between 47.6 and 33,727.8 mg/kg (mean: 14,031.38 mg/kg), signifying substantial geogenic contributions from geothermal processes and mineral-laden lithology. Manganese (Mn) exhibits significant diversity (0.5–452.1 mg/kg), indicating localized hydrothermal enrichment. Lead (Pb) and Chromium (Cr) are present in modest concentrations, with Pb reaching a maximum of 25.8 mg/kg and Cr at 116.5 mg/kg, likely attributable to both natural origins and mining activities. Zinc (Zn) and Copper (Cu) exhibit significant regional variability, with Zn levels attaining 41.34 mg/kg and Cu levels reaching 114.02 mg/kg. Arsenic (As), while not consistently identified, exhibits concerning peaks reaching 151.92 mg/kg, suggesting potential contamination, particularly at locations W6A, W1A, W1C, W20, and W26.
Several studies have also been published on the analysis of heavy metals in the soil of geothermal areas from various regions worldwide, as shown in Table 2. The concentrations of heavy metals in geothermal soil and sediments from Wayang Windu exhibit a unique geochemical profile influenced by volcanic and hydrothermal activities, with iron (Fe) as the predominant element (mean: 14,031.38 mg/kg), markedly exceeding levels found in Tibet, India, or Saudi Arabia, suggesting substantial geogenic enrichment [4, 57, 58]. Manganese (Mn) concentrations in Wayang Windu (62.15 mg/kg) are moderate relative to those in Odisha, India (466 mg/kg), indicating limited hydrothermal mobilization [57]. Chromium (Cr) and copper (Cu) contents (~46 mg/kg) are heightened compared to Iran (20.11 mg/kg) and Saudi Arabia (11.44–24.79 mg/kg), indicating lithogenic weathering and hydrothermal contributions. Arsenic (As) attains alarming concentrations (up to 151.92 mg/kg), exceeding values seen in Tibet (27.27 mg/kg), India (21.81 mg/kg), and Papandayan, Indonesia (17.08 mg/kg), establishing it as the predominant contaminant with considerable ecological and human risks [4, 57, 59]. Lead (Pb) and zinc (Zn) concentrations in Wayang Windu are comparatively low (13.54 and 8.76 mg/kg, respectively), in stark contrast to the increased levels observed in Saudi Arabia (Pb: 103.41 mg/kg, Zn: 113.01 mg/kg) and India (Pb: 71.5 mg/kg, Zn: 75.67 mg/kg), indicating a negligible anthropogenic impact [57, 58]. These comparisons emphasize Wayang Windu's distinctive geogenic signature and emphasize arsenic as a significant contaminant necessitating focused environmental management in geothermal areas.
Table 2. The concentrations of heavy metals in geothermal soil from Wayang Windu are compared with those in other parts of various regions worldwide
|
Location |
Pb |
Zn |
Fe |
Mn |
Cr |
Cu |
As |
|
Wayang Windu, Indonesia (This Study) |
13.54 |
8.76 |
14031.3 |
62.12 |
45.99 |
25.25 |
33.02 |
|
Tibet, China [4] |
29.76 |
57.07 |
- |
- |
46.70 |
2.55 |
27.27 |
|
Odisha, India [57] |
41.40 |
75.67 |
1.86 |
466.00 |
40.27 |
13.27 |
21.81 |
|
Ardebil, Iran [60] |
13.35 |
103.41 |
- |
- |
59.71 |
57.00 |
20.11 |
|
Al Harra, Al-Lith, Saudi Arabia [58] |
10.00 |
70.63 |
- |
909.00 |
80.13 |
24.44 |
1.36 |
|
Matkoub, Al-Lith, Saudi Arabia [58] |
9.84 |
64.43 |
- |
881.00 |
71.43 |
24.89 |
2.71 |
|
Pangalengan, Indonesia [20] |
- |
- |
- |
- |
- |
- |
17.08 |
|
Papandayan, Garut, Indonesia [59] |
- |
- |
- |
- |
- |
- |
52.00 |
|
Hainan, China [61] |
21.73 |
140.82 |
- |
- |
255.45 |
57.03 |
4.17 |
3.2 Potential sources of heavy metals
The research employs principal component analysis (PCA) and Pearson’s correlation to identify heavy metal contamination in soils from the Wayang Windu volcanic zone in West Java, Indonesia. PCA was employed to investigate the correlations among heavy metals and the identification of contamination source patterns [62]. In volcanic environments, these clusters indicate geochemical interactions, including hydrothermal processes or human impacts, that enhance the distribution and concentration of elements such as As, Hg, and Cd [63]. The Pearson's correlation of the Wayang Windu volcanic suggests complex geochemical interactions, as demonstrated in Table 3.
Table 3. The Pearson correlation in the Wayang Windu
|
Pb |
Zn |
Fe |
Mn |
Cr |
Cu |
As |
|
|
Pb |
1 |
||||||
|
Zn |
-0.20 |
1 |
|||||
|
Fe |
0.14 |
-0.19 |
1 |
||||
|
Mn |
-0.02 |
0.02 |
0.25 |
1 |
|||
|
Cr |
0.542* |
-0.07 |
0.01 |
-0.16 |
1 |
||
|
Cu |
-0.28 |
0.730** |
0.14 |
-0.12 |
-0.01 |
1 |
|
|
As |
0.19 |
0.24 |
-0.06 |
0.14 |
-0.15 |
0.09 |
1 |
|
* Correlation is substantial at the 0.05 level (2-tailed). |
|||||||
|
** Correlation is substantial at the 0.01 level (2-tailed). |
|||||||
Pearson's correlation evaluation was utilized to investigate the correlations among heavy metals in the soil at the specimen sites [63]. The correlation coefficient amounts of heavy metals represent the strengths of elements and suggest their potential origins and pathways of introduction [64]. Elevated correlation quantities indicated positive relationships in soil samples, suggesting one or more shared causes [65].
The Pearson correlation analysis is presented in Table 3. A robust positive correlation occurs between Cu and Zn (r = 0.730, p < 0.01), indicating a shared geogenic or hydrothermal origin. Chromium exhibits a moderate positive connection through lead (r = 0.542, p < 0.05), suggesting lithogenic or geothermal mobilization. Fe, Mn, and As demonstrate weak or negligible connections with one another and with Pb and Zn, suggesting relationships, indicating unique geochemical tendencies. The correlation matrix indicates that Cu and Zn likely stem from analogous geothermal processes, but Cr and Pb may have a lithogenic association, with other elements exhibiting more intricate or distinct patterns.
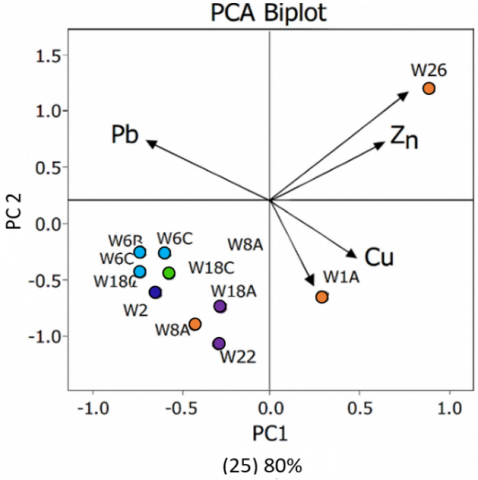
The PCA analysis of heavy metal concentrations in the Wayang Windu volcanic zone indicates separate geogenic origins and contamination patterns as demonstrated in Table 4. Component 1, accounting for 28.34% of the variance, is significantly correlated with Cu, Zn, and Mn, indicating hydrothermal mineralization and geothermal mobilization. Component 2, representing 20.33%, is associated with Fe and As, implying redox-sensitive processes and geothermal emissions. Component 3 (18.78%) is predominantly characterized by Cr, indicating lithogenic weathering of the source rocks. The rotated component matrix validates these correlations as demonstrated in Table 5, with Cu (0.96) and Zn (0.88) significantly loading on PC1, Pb (0.85) and Cr (0.88) on PC2, and Fe (0.89) and Mn (0.66) on PC3, As (0.90) significantly loading on PC4. PCA reveals four geogenic components: PC1 associates Cu and Zn with hydrothermal mineralization; PC2 links Cr and Pb to the weathering of parent rock; PC3 signifies redox-sensitive processes involving Fe and Mn; and PC4 is identified as a geothermal tracer mobilized by high-temperature fluids. The principal component analysis (PCA) and Pearson’s correlation were used to identify four geogenic sources: hydrothermal mineralization (Cu, Zn), lithogenic weathering (Cr, Pb), redox-sensitive mobilization (Fe, Mn), and geothermal emissions (As).
Figure 3. The PCA biplots demonstrate the sampling sites
Table 4. Principal component analysis
|
Component |
Initial Eigenvalues |
Extraction Sums of Squared Loadings |
Rotation Sums of Squared Loadings |
||||||
|
Total |
% of Variance |
Cumulative % |
Total |
% of Variance |
Cumulative % |
Total |
% of Variance |
Cumulative % |
|
|
1 |
1.98 |
28.34 |
28.34 |
1.98 |
28.34 |
28.34 |
1.78 |
25.54 |
25.54 |
|
2 |
1.42 |
20.33 |
48.67 |
1.42 |
20.33 |
48.67 |
1.57 |
22.47 |
48.01 |
|
3 |
1.31 |
18.78 |
67.45 |
1.31 |
18.78 |
67.45 |
1.27 |
18.10 |
66.11 |
|
4 |
1.12 |
15.99 |
83.44 |
1.12 |
15.99 |
83.44 |
1.21 |
17.33 |
83.44 |
|
5 |
0.70 |
10.03 |
93.47 |
||||||
|
6 |
0.31 |
4.47 |
97.94 |
||||||
|
7 |
0.14 |
2.06 |
100.0 |
||||||
Table 5. Rotated component matrix of heavy metals based on PCA
|
Rotated Component Matrixa |
||||
|
|
Component |
|||
|
|
1 |
2 |
3 |
4 |
|
Pb |
-0.25 |
0.85 |
0.11 |
0.28 |
|
Zn |
0.88 |
-0.10 |
-0.14 |
0.26 |
|
Fe |
0.06 |
0.14 |
0.89 |
-0.20 |
|
Mn |
-0.14 |
-0.22 |
0.66 |
0.41 |
|
Cr |
0.05 |
0.88 |
-0.07 |
-0.20 |
|
Cu |
0.96 |
-0.05 |
0.09 |
-0.10 |
|
As |
0.14 |
0.04 |
-0.02 |
0.90 |
Extraction Method: Principal component analysis.
Rotation Method: Varimax with Kaiser Normalization.
PCA offers a solid framework for determining the geochemical sources of heavy metals in volcanic soils, as displayed in Figure 3. The PCA results reveal four unique main components that account for the majority of variance in the sample. PC1, representing the predominant variance, is primarily influenced by Cu and Zn, signifying a robust correlation with hydrothermal mineralization processes—presumably propelled by geothermal fluid discharge and subsurface thermal mobilization. PC2 is distinguished by elevated loadings of Cr and Pb, indicating their provenance from the lithogenic weathering of parent rocks. PC3 encapsulates the impact of Fe and Mn, which are generally mobilized through redox-sensitive geochemical processes, whereas PC4 distinguishes Arsenic as a marker of geothermal emissions, indicating its concentration through high-temperature fluid conduits.
The PCA biplots further demonstrate the clustering of individual sampling sites based on their predominant geochemical signatures and corresponding risk categories. Samples W26, W20, and W1A are situated along vectors affected by arsenic and lead, corresponding with areas of heightened ecological and health risk. The directional arrows in the biplot—representing Pb, Zn, Cu, and As—illustrate the magnitude and orientation of each element's contribution to the primary components, emphasizing their influence on contamination profiles.
This multivariate method elucidates the spatial distribution of heavy metals and strengthens the connection between geogenic processes and environmental effects.
3.3 Ecological risk assessment
Heavy metal blemish in the Wayang Windu geothermal region was assessed utilizing six principal indices: Contamination factor (CF), Geoaccumulation Index (Igeo), Enrichment factor (EF), Pollution Index (PI), Pollution load index (PLI), and potential ecological risk index (PERI).
3.3.1 The contamination factor (CF)
The assessment of the CF in the Wayang Windu volcanic reveals varying levels of heavy metal sites, with As identified as the most concerning element (Figure 4). Most metals, including Zn, Fe, and Mn, exhibit consistently low CF values (usually < 1), indicating minor pollution; however, arsenic displays significantly elevated levels at locations such as W26 (11.69), W20 (8.81), and W1A (6.43), indicating substantial contamination. Lead (Pb), Cr, and Cu exhibit moderate contamination levels at various locations, with Pb reaching a maximum of 1.29 at W1C, Cr also peaking at 1.29 at W1C, and Cu attaining a high of 2.53 at W1D.
Figure 4. The contamination factor in the Wayang Windu
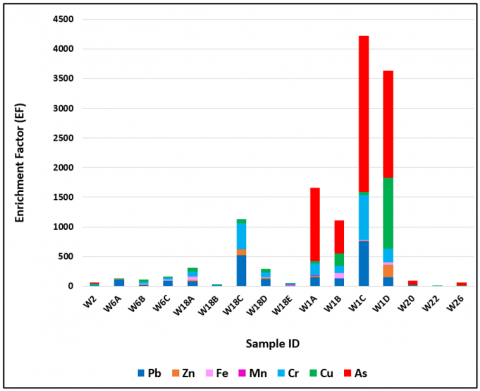
3.3.2 The enrichment factor (EF)
The EF evaluation of the Wayang Windu indicates a significant geogenic impact, especially for As, Cu, Pb, and Cr, signifying that these elements are naturally enhanced as a result of volcanic and hydrothermal activities (Figure 5). The geochemical signature emphasizes the natural origin of heavy metals in the soil and illustrates the necessity of differentiating geogenic from anthropogenic contributions in the environment [19, 21]. The high EF values, especially W1C, W1D, and W18C, where As and Pb surpass thresholds, as demonstrated in Figure 5. The elevated EFs indicate significant enrichment beyond natural background, resulting from geothermal activity and fluid outflow [66]. While Mn remains consistently at baseline (EF = 1), other metals like Zn, Fe, and Cr show moderate to high variability across sites, indicating localized geochemical processes and potential contamination. The data suggest a correlation between volcanic processes and metal mobilisation, requiring targeted environmental monitoring and risk assessment.
Figure 5. The enrichment factor of the Wayang Windu
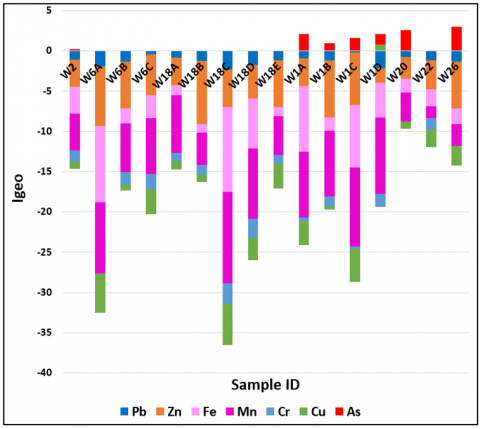
3.3.3 The geoaccumulation index
The assessment of the geoaccumulation index from the Wayang Windu volcanic area indicates varying levels of metal pollution across various assessment sites (Figure 6).
Figure 6. The geoaccumulation index in the Wayang Windu
The majority of elements, such as Pb, Zn, Fe, Mn, Cr, and Cu, have negative Igeo values, indicating that their concentrations are predominantly beneath natural background levels and classified within the "uncontaminated" to "moderately contaminated" ranges. Fe and Mn display the most negative values, particularly at locations W6A and W18C, indicating a comparatively modest anthropogenic impact. Arsenic (As) exhibits positive Igeo values in multiple locations (e.g., W1A, W1B, W1C, W1D, W20, W26), signifying localized enrichment and possible contamination.
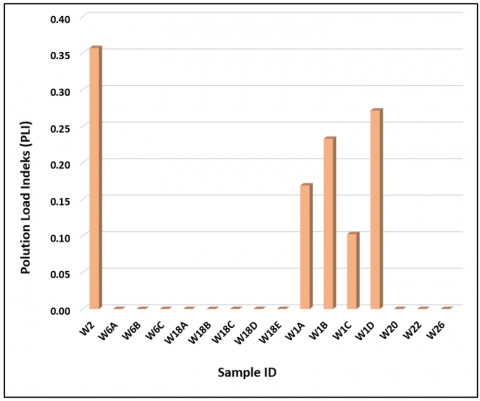
3.3.4 The pollution load index (PLI)
The PLI assessments in the Wayang Windu volcanic region indicate primarily moderate concentrations of heavy metal pollution in the soil, as illustrated in Figure 7. Most locations, including W6A–W6C, W18A–W18E, W20, W22, and W26, exhibit a PLI of 0.00, indicating an absence of contamination. Generally, higher PLI values are recorded at locations W1A (0.17), W1B (0.23), W1C (0.10), and W1D (0.27), signifying minor pollution levels. The maximum PLI is observed at site W2 (0.36); however, it is classified within the "low pollution" category according to standard evaluation criteria.
Figure 7. The pollution load index in the Wayang Windu
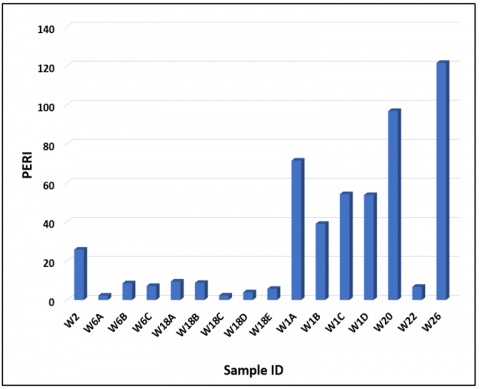
Figure 8. The potential ecological risk index in the Wayang Windu volcanic area
3.3.5 The potential ecological risk index (PERI)
The assessment of PERI readings in the Wayang Windu volcanic indicates a wide variety of ecological risk levels (Figure 8), predominantly affected by concentrations of As, Cu, and Cr.
Most sites, including W6A, W18C, and W18D, demonstrate low PERI values (below 10), signifying negligible ecological risk. Nonetheless, several locations have seen significant increases in hazards, particularly W26 (121.47), W20 (96.84), and W1A (71.43), with arsenic being the primary factor, with levels as high as 116.86 at W26. Sites W1C and W1D pose a significant risk due to the synergistic effects of arsenic and copper. In general, whereas much of the region exhibits low to moderate ecological risk, locations with elevated PERI values necessitate targeted environmental monitoring and possible remediation actions.
3.4 Health risk assessment in the Wayang Windu volcano
3.4.1 Non-carcinogenic risks assessment
The average daily intake (ADI) exposure to non-carcinogenic hazards of heavy metals in the Wayang Windu volcanic area demonstrates notable differences between children and adults for ingestion and dermal exposure pathways, as illustrated in Table 6.
Table 6. Average daily intake exposure in Wayang Windu
|
Heavy Metals |
ADI Ingestion |
ADI Dermal |
ADI Total |
|||
|
Child |
Adult |
Child |
Adult |
Child |
Adult |
|
|
Pb |
1.7×10⁻4 |
1.9×10⁻5 |
4.9×10⁻7 |
7.4×10⁻8 |
1.7×10⁻4 |
1.9×10⁻5 |
|
Zn |
1.2×10⁻4 |
1.2×10⁻5 |
3.3×10⁻7 |
5.0×10⁻8 |
1.2×10⁻4 |
1.3×10⁻5 |
|
Fe |
1.7×10⁻1 |
1.9×10⁻2 |
4.9×10⁻4 |
7.4×10⁻5 |
1.7×10⁻1 |
1.9×10⁻2 |
|
Mn |
7.9×10⁻4 |
8.5×10⁻5 |
2.2×10⁻6 |
3.4×10⁻7 |
7.9×10⁻4 |
8.5×10⁻5 |
|
Cr |
5.9×10⁻4 |
6.3×10⁻5 |
1.7×10⁻6 |
2.5×10⁻7 |
5.9×10⁻4 |
6.4×10⁻5 |
|
Cu |
3.3×10⁻4 |
3.5×10⁻5 |
9.3×10⁻7 |
1.4×10⁻7 |
3.3×10⁻4 |
3.6×10⁻5 |
|
As |
4.1×10⁻4 |
4.4×10⁻5 |
1.2×10⁻6 |
1.8×10⁻7 |
4.1×10⁻4 |
4.4×10⁻5 |
This dataset presents the Average Daily Intake (ADI) values for seven heavy metals—Pb, Zn, Fe, Mn, Cr, Cu, and As, via ingestion and dermal exposure for children and adults. Ingestion is the primary route of exposure for all metals, although dermal contributions are minimal. Iron (Fe) exhibits the greatest ADI values in all age demographics, with young children consuming up to 1.7×10⁻¹ mg/kg/day and adults 1.9×10⁻² mg/kg/day, indicating significant ambient availability or food consumption. Lead (Pb) and arsenic (As), both recognized as hazardous metals, exhibit alarming consumption levels in children—1.7×10⁻⁴ and 4.1×10⁻⁴ mg/kg/day, respectively—which are nearly an order of magnitude higher than those recorded in adults. This gap underscores the heightened risk of accumulation and related health risks in children. Zinc (Zn) and copper (Cu), while necessary trace metals, demonstrate elevated ADI values in children; however stay within comparatively mild exposure limits. Manganese (Mn) and chromium (Cr) exhibit similar tendencies, with intake as the primary exposure pathway and gastrointestinal absorption playing a negligible role across all metals. Significantly, dermal ADI values are considerably lower than those for ingestion, underscoring the assertion that ingestion is the predominant route of exposure. The study highlights children's increased susceptibility to heavy metal pollution and highlights the importance of more stringent environmental and gastrointestinal monitoring, especially with iron, lead, and arsenic. The ADI data clearly demonstrate that children experience significantly more exposure to heavy metals than adults, primarily via ingestion, highlighting their heightened susceptibility to heavy metal exposure from contaminated soil.
The current data set presents a non-carcinogenic risk evaluation of the soil in the Wayang Windu volcanic region, employing Hazard Quotient (HQ) values obtained from ingestion and dermal exposure, alongside the overall Hazard Index (HI) for both children and adults, as illustrated in Table 7.
Table 7. Non-carcinogenic risk index of heavy metals
|
Heavy Metals |
HQ Ingestion |
HQ Dermal |
Hazard Index (HI) |
|||
|
Child |
Adult |
Child |
Adult |
Child |
Adult |
|
|
Pb |
5.0×10⁻2 |
5.3×10⁻3 |
9.3×10⁻4 |
1.4×10⁻4 |
5.1×10⁻2 |
5.4×10⁻3 |
|
Zn |
3.9×10⁻4 |
4.2×10⁻5 |
5.4×10⁻6 |
8.3×10⁻7 |
3.9×10⁻4 |
4.2×10⁻5 |
|
Fe |
2.5×10⁻1 |
2.7×10⁻2 |
6.9×10⁻4 |
1.1×10⁻4 |
2.5×10⁻1 |
2.7×10⁻2 |
|
Mn |
5.6×10⁻3 |
6.0×10⁻4 |
1.2×10⁻6 |
1.8×10⁻4 |
6.8×10⁻3 |
7.9×10⁻4 |
|
Cr |
2.0×10⁻1 |
2.1×10⁻2 |
2.8×10⁻4 |
4.2×10⁻3 |
2.2×10⁻1 |
2.5×10⁻2 |
|
Cu |
8.3×10⁻3 |
8.9×10⁻4 |
7.7×10⁻6 |
1.2×10⁻5 |
8.4×10⁻3 |
9.0×10⁻4 |
|
As |
1.4 |
1.5×10⁻1 |
9.6×10⁻3 |
1.4×10⁻3 |
1.4 |
1.5×10⁻1 |
The data clearly demonstrate that children are more vulnerable to heavy metal exposure than adults, as evidenced by consistently higher Hazard Index (HI) values across most metals. The findings indicate that ingestion is the primary exposure route, with HQ_ingestion values significantly exceeding HQ_dermal for all metals and age groups. Arsenic (As) presents the highest non-carcinogenic risk, with an HI of 1.4 for children and 0.15 for adults, exceeding the safety threshold (HI > 1) and indicating serious health concerns, particularly for children. Iron (Fe) and chromium (Cr) also show elevated HI values in children, at 0.25 and 0.22, respectively, suggesting moderate risk levels. Lead (Pb) exhibits a hazard index (HI) of 0.051 in children, which, although below the critical level, necessitates observation due to its established toxicity. Conversely, zinc (Zn), manganese (Mn), and copper (Cu) demonstrate comparatively low HI values for both age groups, indicating minimal risk. Children regularly exhibit elevated HQ and HI values compared to adults across all metals, underscoring their heightened susceptibility to heavy metal exposure. These findings highlight the necessity of specific risk mitigation techniques, especially for arsenic, iron, and chromium in areas where children are exposed to polluted soil.
3.4.2 Carcinogenic risk assessment
The carcinogenic risk index of heavy metals found in the soil of the Wayang Windu volcanic area reveals significant health concerns, as presented in Table 8. The evaluation indicates that children are exposed to substantially higher carcinogenic risks than adults, primarily through the ingestion pathway.
Table 8. Carcinogenic risk index of heavy metals
|
Heavy Metals |
ILCR Ingestion |
ILCR Dermal |
||
|
Child |
Adult |
Child |
Adult |
|
|
Pb |
1.48×10⁻⁶ |
1.06×10⁻⁷ |
4.13×10⁻⁹ |
4.23×10⁻¹⁰ |
|
Cr |
2.96×10⁻⁴ |
1.77×10⁻⁵ |
1.77×10⁻⁵ |
2.83×10⁻⁶ |
|
As |
6.20×10⁻⁴ |
6.64×10⁻⁵ |
4.24×10⁻⁶ |
6.47×10⁻⁷ |
The Incremental Lifetime Cancer Risk (ILCR) values for lead (Pb), chromium (Cr), and arsenic (As) illustrate significant variations in carcinogenic risk among various age groups and exposure routes. Of the three metals, arsenic presents the greatest cancer risk, with Incremental Lifetime Cancer Risk (ILCR) values of 6.20×10⁻⁴ for children and 6.64×10⁻⁵ for adults through ingestion, both beyond the tolerable risk threshold of 1×10⁻⁴ for children, signifying an elevated risk of concern. Chromium has increased ILCR values, especially in children, with 2.96×10⁻⁴ by ingestion and 1.77×10⁻⁵ through dermal exposure, indicating a moderate to high risk. Lead, although comparably lower, exhibits an ILCR of 1.48×10⁻⁶ in children through ingestion, which is within the acceptable risk range but significantly exceeds the adult value of 1.06×10⁻⁷. Children consistently have elevated ILCR values compared to adults across all metals and routes, highlighting their heightened vulnerability to carcinogenic consequences from polluted soil. Dermal exposure poses a far lower overall risk, with values many orders of magnitude beneath those associated with ingestion.
4.1 Comparative assessment of heavy metal levels and associated hazards
The concentrations of heavy metals in the geothermal soils of the Wayang Windu region have a unique geochemical signature influenced by significant volcanic and hydrothermal activity. In comparison to other geothermal regions worldwide and nationally (Table 2), Wayang Windu exhibits remarkably high iron (Fe) concentrations, with an average of 14,031.38 mg/kg, considerably surpassing levels documented in Tibet, India, and Saudi Arabia, signifying substantial geogenic enrichment. Arsenic (As), recognized as the principal contaminant in this study, attains a peak concentration of 151.92 mg/kg, significantly exceeding the levels documented in Tibet (27.27 mg/kg), India (21.81 mg/kg), and Papandayan, Indonesia (52.00 mg/kg), thereby categorizing Wayang Windu as one of the highest-risk geothermal areas for arsenic contamination.
Manganese (Mn) concentrations are moderately measured at 62.12 mg/kg, far lower than the levels observed in Odisha, India (466 mg/kg), and Saudi Arabia (exceeding 900 mg/kg), indicating restricted hydrothermal mobilization. Chromium (Cr) and copper (Cu) values, roughly 46 mg/kg and 25.25 mg/kg, respectively, are heightened relative to levels in Iran and Saudi Arabia, indicating a synergistic effect of lithogenic and hydrothermal processes. Conversely, lead (Pb) and zinc (Zn) concentrations are very low, suggesting negligible anthropogenic influence, unlike the heightened Pb and Zn levels recorded in India and Saudi Arabia.
The heightened levels of arsenic and chromium in Wayang Windu soils align with moderate to high ecological risk classifications as determined by the potential ecological risk index (PERI) and the Geoaccumulation Index (Igeo). Health risk assessments indicate that children are more susceptible, since the Hazard Quotient (HQ) and Incremental Lifetime Cancer Risk (ILCR) values for arsenic and chromium are beyond permissible limits. These results highlight the critical necessity for specific soil remediation and public health surveillance in geothermal-agricultural interface areas. In comparison to other volcanic regions like Italy, Iceland, and Japan, where arsenic and chromium levels have been determined, Wayang Windu has a notably heightened risk profile owing to its active geothermal activity and direct agricultural utilization.
4.2 Integrating ecological and health impacts for sustainable environmental management
Heavy metal contamination in volcanic areas creates a diverse environmental issue, especially where geothermal activity intersects with human land utilization [8, 46]. The Wayang Windu volcanic region in West Java, Indonesia, illustrates an environment where natural geogenic processes and human activities result in heightened levels of toxic materials in the soil [67]. The present research introduces a comprehensive method for sustainable land management through investigating the origins and impact of heavy metal contamination in the Wayang Windu volcanic area of West Java, Indonesia.
The research employs geochemical analysis and statistical methods, including PCA and Pearson’s correlation, to identify natural and anthropogenic pollutants, highlighting arsenic (As), lead (Pb), and copper (Cu) as significant contaminants. Ecological hazards were examined using five indices (CF, Igeo, EF, PLI, and PERI), whereas health risks were analyzed with an emphasis on vulnerable populations, notably children, who demonstrate heightened exposure to arsenic and lead.
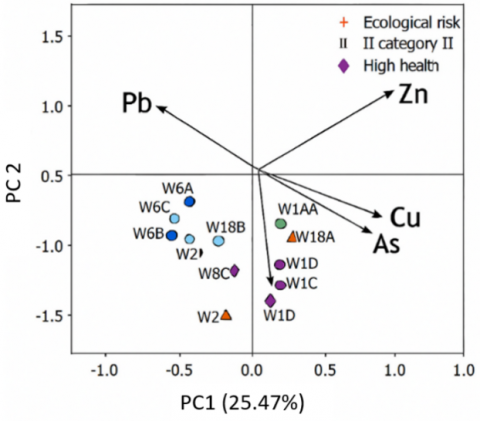
Figure 9. The PCA biplot demonstrates ecological and health risk in Wayang Windu
The evaluation indicates that heavy metal contamination in Wayang Windu is predominantly caused by geogenic processes associated with volcanic and hydrothermal activity. PCA and Pearson’s correlation revealed four separate source pathways: hydrothermal mineralization (Cu, Zn), lithogenic weathering (Cr, Pb), redox-sensitive mobilization (Fe, Mn), and geothermal fluid discharge (As). The PCA biplot (Figure 9) depicts the clustering of samples according to ecological and health risk categories, with arsenic and lead significantly correlated with high-risk areas. Subsurface fluid-rock interactions and geothermal emissions are significant factors in metal dispersion in the soil.
Figure 9 clearly illustrates the ecological and health risk profile of the Wayang Windu geothermal field, delineating sample distributions and heavy metal vectors (Pb, Zn, Cu, As) within the PC1–PC2 coordinate framework. Samples designated as “High health risk” (blue circles) and “Ecological risk” (orange triangles) closely correspond with arsenic and lead vectors, signifying robust associations with heightened risk levels. The closeness of Cu and Zn vectors indicates the same geogenic source, probably hydrothermal mineralization; however, the regional diversity in sample distribution reveals varying levels of contamination. Arsenic is recognized as the primary pollutant, highlighting the necessity for focused remediation in these high-risk zones.
Ecological risk indices frequently identified arsenic as the primary pollutant, where PERI values are above moderate risk criteria. Health risk assessments indicate that children are particularly vulnerable, with heightened Average Daily Intake (ADI), Hazard Quotient (HQ), and Incremental Lifetime Cancer Risk (ILCR) values for Fe, Cu, As, and Cr. Dermal exposure to Zn in children exhibits an unusually elevated hazard quotient, indicating either overestimation or increased absorption. The carcinogenic hazards posed by arsenic and chromium above acceptable thresholds, especially through consumption in children, highlight the critical necessity for age-specific health interventions and environmental surveillance in geothermal-agricultural regions.
The accumulation of arsenic in geothermal fluids is due to its significant mobility in acidic to neutral pH environments and high temperatures characteristic of hydrothermal systems. Arsenic is frequently linked to sulfide minerals like arsenopyrite, which destabilize and release arsenic into solution during geothermal fluid circulation. Fault zones and pronounced temperature gradients in Wayang Windu promote the leaching of arsenic from host rocks onto surface soils through steam and condensate discharge. Copper and zinc are frequently co-extracted from hydrothermal deposits owing to their analogous geochemical properties and solubility characteristics. Their occurrence in chloride-rich geothermal fluids under mildly acidic conditions, along with their correlation in PCA data, indicates an association with sulfide mineral phases such as chalcopyrite and sphalerite, which dissolve in high-temperature, low-pH environments and precipitate upon cooling or interaction with oxygenated groundwater.
These results enhance the mechanical knowledge of elemental distributions throughout the region that was studied and establish a direct correlation with the geothermal dynamics of Wayang Windu. The integrated methodology, which integrates geochemical profiling with ecological and health risk assessments, provides a comprehensive framework for sustainable environmental management and prioritized rehabilitation in geothermal-affected zones.
This study provides a comprehensive assessment of heavy metal contamination and related health risks in the Wayang Windu geothermal region of West Java, Indonesia. Geochemical research on soil samples from 16 locations indicated that pollution is primarily geogenic, with iron (Fe), manganese (Mn), and chromium (Cr) as the most prevalent elements. Arsenic (As) has emerged as the predominant contaminant, with amounts significantly exceeding those documented in other geothermal areas, including Tibet and India. Multivariate analysis employing PCA and Pearson’s correlation revealed four separate geogenic sources, with geothermal emissions established as the primary contributor to arsenic contamination. Ecological risk indices consistently identified arsenic as the element with the highest hazards, especially at hotspot locations W26 and W20. Health risk assessments indicated that children are particularly vulnerable, with heightened Hazard Quotient (HQ) and Incremental Lifetime Cancer Risk (ILCR) values for arsenic, chromium, and iron, and significantly increased dermal HQ for zinc. The results highlight the urgent requirement for focused soil remediation in high-risk areas and community outreach initiatives to encourage safe land utilization and hygiene practices, particularly for families with small children residing in geothermal-agricultural boundary zones.
The authors wish to express their gratitude to the Research Programme Number 1/III.4/HK/2025 on the research program for the scarcity of important and strategic mineral resources, Earth and Maritime Research Organisation BRIN, for funding and supporting this research. The Head of the Research Centre for Geological Resources, BRIN, Dr. Eng. Iwan Setiawan, and for their guidance during the research process. We extend our gratitude to Inggit Tri Purnama Sari, a Geological Engineering student at UNSOED, for her assistance with field sampling.
[1] Zhang, T., Wang, P., Wang, M., Liu, J., Gong, L., Xia, S. (2023). Spatial distribution, source identification, and risk assessment of heavy metals in riparian soils of the Tibetan plateau. Environmental Research, 237: 116977. https://doi.org/10.1016/j.envres.2023.116977
[2] Fahimah, N., Oginawati, K. (2020). Fate and spatial distribution of Pb, Cd, Cu and Zn in the water column and in the surface sediment of Indonesian Estuary (Citarum River Estuary). E3S Web of Conferences, 148: 07007. https://doi.org/10.1051/e3sconf/202014807007
[3] Yang, J., Sun, Y., Wang, Z., Gong, J., Gao, J., Tang, S., Ma, S., Duan, Z. (2022). Heavy metal pollution in agricultural soils of a typical volcanic area: Risk assessment and source appointment. Chemosphere, 304: 135340. https://doi.org/10.1016/j.chemosphere.2022.135340
[4] Wang, X., Dan, Z., Cui, X., Zhang, R., Zhou, S., Wenga, T., Yan, B., Chen, G., Zhang, Q.Y., Zhong, L. (2020). Contamination, ecological and health risks of trace elements in soil of landfill and geothermal sites in Tibet. Science of the Total Environment, 715: 136639. https://doi.org/10.1016/j.scitotenv.2020.136639
[5] Bolós, X., Del Ángel, V., Villanueva-Estrada, R.E., Sosa-Ceballos, G., Boijseauneau-López, M., Méndez, V., Macías, J.L. (2022). Surface hydrothermal activity controlled by the active structural system in the self-sealing geothermal field of Acoculco (Mexico). Geothermics, 101: 102372. https://doi.org/10.1016/j.geothermics.2022.102372
[6] González-Acevedo, Z.I., García-Zarate, M.A., Núñez-Zarco, E.A., Anda-Martín, B.I. (2018). Heavy metal sources and anthropogenic enrichment in the environment around the Cerro Prieto Geothermal Field, Mexico. Geothermics, 72: 170-181. https://doi.org/10.1016/j.geothermics.2017.11.004
[7] Grant, H.L., Hannington, M.D., Hardardóttir, V., Fuchs, S.H., Schumann, D. (2020). Trace metal distributions in sulfide scales of the seawater-dominated Reykjanes geothermal system: Constraints on sub-seafloor hydrothermal mineralizing processes and metal fluxes. Ore Geology Reviews, 116: 103145. https://doi.org/10.1016/j.oregeorev.2019.103145
[8] Morales-Simfors, N., Bundschuh, J. (2022). Arsenic-rich geothermal fluids as environmentally hazardous materials–A global assessment. Science of the Total Environment, 817: 152669. https://doi.org/10.1016/j.scitotenv.2021.152669
[9] Ramos, Q., Armienta, M.A., Aguayo, A., Cruz, O. (2021). Evaluation of the interactions of arsenic (As), boron (B), and lead (Pb) from geothermal production wells with agricultural soils. Ecotoxicology and Environmental Safety, 211: 111843. https://doi.org/10.1016/j.ecoenv.2020.111843
[10] Irnawati, I., Idroes, R., Zulfiani, U., Akmal, M., et al. (2021). Assessment of arsenic levels in water, sediment, and human hair around Ie Seu’Um geothermal manifestation area, Aceh, Indonesia. Water, 13(17): 2343. https://doi.org/https://doi.org/10.3390/w13172343
[11] Idroes, G.M., Rezeki, D.P., Khairi, K., Khairan, K., Idroes, R., Suhartono, E., Prasetio, R., Rahman, S.A., Suhendrayatna, S. (2024). Validation of heavy metals in geothermal to support water management practices and mitigation strategies. Global Journal of Environmental Science & Management (GJESM), 10: 153. https://doi.org/10.22034/gjesm.2024.10.SI.10
[12] Rahayudin, Y., Kashiwaya, K., Tada, Y., Iskandar, I., Koike, K., Atmaja, R.W., Herdianita, N.R. (2020). On the origin and evolution of geothermal fluids in the Patuha Geothermal Field, Indonesia based on geochemical and stable isotope data. Applied Geochemistry, 114: 104530. https://doi.org/10.1016/j.apgeochem.2020.104530
[13] Ali, H., Khan, E., Ilahi, I. (2019). Environmental chemistry and ecotoxicology of hazardous heavy metals: environmental persistence, toxicity, and bioaccumulation. Journal of Chemistry, 2019(1): 6730305. https://doi.org/10.1155/2019/6730305
[14] Sudarso, J., Ibrahim, A., Yamin, M., Zamroni, M., Aisyah, S. (2024). Sediment metals content in upstream Citarum River, West Java Province, Indonesia. IOP Conference Series: Earth and Environmental Science, 1328(1): 012014. https://doi.org/10.1088/1755-1315/1328/1/012014
[15] Ushakova, E., Menshikova, E., Karavaeva, T., Puzik, A. (2021). Trace element distribution in the snow cover of different functional zones in Berezniki-Solikamsk industrial hub, Russia. Journal of Ecological Engineering, 22(10): 28-39. https://doi.org/10.12911/22998993/142233
[16] Hong, T.T.K., Dan, T.H., Giao, N.T. (2022). Assessment of occurrence, ecological and health risk of heavy metals in agricultural soil in the Hau Giang Province, Vietnam. Journal of Ecological Engineering, 23(9): 61-71. https://doi.org/10.12911/22998993/151532
[17] Bhakta, S., Rout, T.K., Karmakar, D., Pawar, C., Padhy, P.K. (2022). Trace elements and their potential risk assessment on polar ecosystem of Larsemann Hills, East Antarctica. Polar Science, 31: 100788. https://doi.org/10.1016/j.polar.2022.100788
[18] Anggraeni, D., Oginawati, K., Fahimah, N., Salami, I. R. S., Absari, H. R., Mukhaiyar, U., Pasaribu, U.S., Sari, K.N., Adiyani, L. (2024). Analysis of heavy metals (Pb and Cd) in soil layers of Indonesia: Spatial distribution, potential source, and groundwater effect. Case Studies in Chemical and Environmental Engineering, 9: 100652. https://doi.org/10.1016/j.cscee.2024.100652
[19] Astuti, R.D.P., Maria, R., Nurohman, H., Shoedarto, R.M., et al. (2024). Potentially toxic elements contamination in the water resources: An integrated risk assessment approach in the upper Citarum watershed area. Environmental Geochemistry and Health, 46(3): 77. https://doi.org/10.1007/s10653-023-01818-y
[20] Fahimah, N., Oginawati, K., Salami, I.R.S., Irawan, D.E., Anggraeni, D., Absari, H.R., Mukhaiyar, U., Pasaribu, U.S., Sari, K.N., Adiyani, L. (2024). Arsenic variation in soil layers in Bandung Regency, Indonesia: A statistical approach for identifying potential sources. Emerging Contaminants, 10(3): 100311. https://doi.org/10.1016/j.emcon.2024.100311
[21] Maria, R., Astuti, R.D.P., Rusydi, A.F., Marganingrum, D., et al. (2024). Heavy metal identification in water resources and the surrounding environment of the Cirasea Riparian Zone, Indonesia. Indonesian Journal of Chemistry, 24(5): 1331-1348. https://doi.org/10.22146/ijc.93326
[22] Ibrahim, A., Fahimah, N., Rosada, K.K., Syawal, M.S., Waluyo, A., Taufik, I. (2025). Unveiling the path from sediment trace elements to bioaccumulation in edible mussels: Ecological and human health risk in Lake Singkarak, Indonesia. Journal of Ecological Engineering, 26(2): 201-220. https://doi.org/10.12911/22998993/196130
[23] Nahib, I., Widiatmaka, W., Tarigan, S.D., Ambarwulan, W., Ramadhani, F. (2025). Determining conservation priorities in the urban Citarum Watershed, West Java: An ecosystem services approach. International Journal of Sustainable Development & Planning, 20(1): 195-208. https://doi.org/10.18280/ijsdp.200119
[24] Bogie, I., Mackenzie, K.M. (1998). The application of a volcanic facies model to an andesitic stratovolcano hosted geothermal system at Wayang Windu, Java, Indonesia. In Proceedings 20th NZ Geothermal Workshop, pp. 265-270.
[25] Fadillah, A., Nugraha, T., Gumilar, J. (2013). West Java geothermal update. In Proceedings 38th Workshop on Geothermal Reservoir Engineering, Stanford, California, pp. 1503-1510. https://pangea.stanford.edu/ERE/pdf/IGAstandard/SGW/2013/Yanuar.pdf.
[26] Zhuang, S., Wang, G., Zhou, X., Shi, Z., et al. (2025). Deciphering the distribution and enrichment of arsenic in geothermal water in the Red River Fault Zone, southwest China. Journal of Hazardous Materials, 485: 136756. https://doi.org/10.1016/j.jhazmat.2024.136756
[27] Picone, N., Hogendoorn, C., Cremers, G., Poghosyan, L., et al. (2020). Geothermal gases shape the microbial community of the volcanic soil of Pantelleria, Italy. mSystems, 5. https://doi.org/10.1128/msystems.00517-20
[28] Öktüren ASRİ, F., DemİrtaŞ, E.I., Şimşek, M., Ertürk, M.E., Özkan, C.F., Ari, N., Özbek, O., Güven, D. (2024). Heavy metal contamination and human health risk assessment in the soils grown field crops in Antalya, Türkiye. International Journal of Environmental Analytical Chemistry, 1-20. https://doi.org/10.1080/03067319.2024.2383339
[29] Alzwar, M., Akbar, N., Bachri, S. (1992). Geological map of the Garut and Pameungpeuk quadrangle, Java. Geological Research and Development Centre, Bandung, Indonesia.
[30] EPA. (2010). Guidance on evaluating sediment contaminant results. https://dam.assets.ohio.gov/image/upload/epa.ohio.gov/Portals/35/guidance/sediment_evaluation_jan10.pdf.
[31] Talbi, N., Rouhi, A., Merzouki, M., Merzouki, H. (2025). Evaluation of trace metal element concentrations in sediments from sites receiving treated wastewater inputs in the Beni Mellal--Khenifra region, Morocco. Journal of Ecological Engineering, 26(9): 205-217. https://doi.org/10.12911/22998993/205109
[32] Puari, A.T., Anandika, A., Apriani, I.I., Azora, A., Maida, S.P. (2025). Contamination level of heavy metals and assessment of the ecologic risk in the surface water and sediments of Batanghari River, Dharmasraya region, Indonesia. Journal of Ecological Engineering, 26(4): 182-197. https://doi.org/10.12911/22998993/199978
[33] Aquisman, A.E., Assim, Z.B., Wahi, R.B., Kwabena, D.E., Festus, W. (2019). Validation of the atomic absorption spectroscopy (AAS) for heavy metal analysis and geochemical exploration of sediment samples from the Sebangan River. Advances in Analytical Chemistry, 9(2): 23-33. https://doi.org/10.5923/j.aac.20190902.01
[34] Liu, H., Chen, Y., Shi, H., Huang, X., Kim, Y., Hou, W., Yu, J. (2025). Source apportionment and ecological risk of heavy metals in sediments from estuaries and bays in China: Insights into cross-regional transport. Marine Pollution Bulletin, 220: 118420. https://doi.org/10.1016/j.marpolbul.2025.118420
[35] Maria, R., Rusydi, A.F., Marganingrum, D., Damayanti, R., et al. (2024). Use of the groundwater quality index, multivariate statistics and hydrogeochemistry for groundwater assessment in the Malabar Volcanic Area, Indonesia. Rudarsko-Geološko-Naftni Zbornik, 39(5): 41-62. https://doi.org/10.17794/rgn.2024.5.3
[36] Nur-E-Alam, M., Salam, M.A., Dewanjee, S., Hasan, M.F., Rahman, H., Rak, A.E., Islam, A.R.M.T., Miah, M.Y. (2022). Distribution, concentration, and ecological risk assessment of trace metals in surface sediment of a tropical Bangladeshi urban river. Sustainability, 14(9): 5033. https://doi.org/10.3390/su14095033
[37] Morcillo, A.M. (2023). Descriptive statistics: Organizing, summarizing, describing, and presenting data. State University of Campinas, São Paulo, Brazil. https://doi.org/10.13140/RG.2.2.31782.91203
[38] Kaiser, H.F. (2025). The varimax criterion for analytic rotation in factor analysis. Psychometrika, 23(3): 187-200, https://doi.org/10.1007/BF02289233
[39] Ahamad, M.I., Yao, Z., Ren, L., Zhang, C., et al. (2024). Impact of heavy metals on aquatic life and human health: A case study of River Ravi Pakistan. Frontiers in Marine Science, 11: 1374835. https://doi.org/10.3389/fmars.2024.1374835
[40] Eltarabily, M.G., Moghazy, H.E.M. (2021). GIS-based evaluation and statistical determination of groundwater geochemistry for potential irrigation use in El Moghra, Egypt. Environmental Monitoring and Assessment, 193(5): 306. https://doi.org/10.1007/s10661-021-09058-2
[41] Warnana, D.D., Zulaikah, S., Widodo, A., Lestari, W., Rochman, J.P.G.N., Wicaksono, S.T., Fadhilah, Zakly, H.I., Pratama, A., Muztaza, N.M., Roslee, R. (2025). Geochemical characterization and classification of volcanic materials from the Bromo-Tengger-Semeru complex, East Java, Indonesia. International Journal of Design & Nature and Ecodynamics, 20(8): 1837-1845. https://doi.org/10.18280/ijdne.200814
[42] Hakanson, L. (1980). An ecological risk index for aquatic pollution control. A sedimentological approach. Water Research, 14(8): 975-1001. https://doi.org/https://doi.org/10.1016/0043-1354(80)90143-8
[43] Motswaiso, F.S., Nakamura, K., Watanabe, N., Komai, T. (2019). Geochemical investigation of metals and trace elements around the abandoned Cu-Ni mine site in Selibe Phikwe, Botswana. Journal of Geoscience and Environment Protection, 7(5): 275-293. https://doi.org/10.4236/gep.2019.75020
[44] Yahyaoui, A., Ben Amor, R. (2024). Environmental contamination and health risk assessment of heavy metals in the stream sediments of Oued Kasseb (Northerwest of Tunisia) in the vicinity of abandoned Pb–Zn mine. Water, Air, & Soil Pollution, 235(4): 230. https://doi.org/10.1007/s11270-024-07039-y
[45] Turekian, K.K., Wedepohl, K.H. (1961). Distribution of the elements in some major units of the earth's crust. Geological Society of America Bulletin, 72(2): 175-192. https://doi.org/10.1130/0016-7606(1961)72[175:DOTEIS]2.0.CO;2
[46] Ustaoğlu, F., Islam, M.S. (2020). Potential toxic elements in sediment of some rivers at Giresun, Northeast Turkey: A preliminary assessment for ecotoxicological status and health risk. Ecological Indicators, 113: 106237. https://doi.org/10.1016/j.ecolind.2020.106237
[47] Aboubakar, A., Douaik, A., Mewouo, Y.C.M., Madong, R.C.B.A., Dahchour, A., Hajjaji, S.E. (2019). Ecological risk assessment of trace metal pollution in an urban agricultural area of Yaoundé (Cameroon). In Recent Advances in Environmental Science from the Euro-Mediterranean and Surrounding Regions, pp. 553-558. https://doi.org/10.1007/978-3-030-51210-1_87
[48] Al-Tamimi, A.N.A.M., Al-Obeidi, N.A.S. (2025). Assessment of water quality impacts from Tharthar and Habbaniyah lakes canals on the Euphrates River using HWQI and HMPI, Western Iraq. International Journal of Design & Nature and Ecodynamics, 20(7): 1585-1596. https://doi.org/10.18280/ijdne.200715
[49] Boukich, O., Ben-tahar, R., Gharibi, E., El Guerrouj, B., Smiri, Y. (2024). Assessment of groundwater quality and nitrate related risks to human health: A case of Angads Plain, Morocco. Water, Air, & Soil Pollution, 235(12): 787. https://doi.org/10.1007/s11270-024-07605-4
[50] USEPA. (2024). Regional Screening Levels (RSLs) - User’s Guide. https://www.epa.gov/risk/regional-screening-levels-rsls-users-guide#target.
[51] USEPA. (2011). Exposure Factors Handbook (2011 Edition). Washington, DC: National Center for Environmental Assessment, Office of Research and Development. https://www.epa.gov/expobox/exposure-factors-handbook-2011-edition.
[52] Miletić, A., Lučić, M., Onjia, A. (2023). Exposure factors in health risk assessment of heavy metal(loid)s in soil and sediment. Metals, 13(7): 1266. https://doi.org/10.3390/met13071266
[53] Siddig, M.M., Brevik, E.C., Sauer, D. (2025). Human health risk assessment from potentially toxic elements in the soils of Sudan: A meta-analysis. Science of the Total Environment, 958: 178196. https://doi.org/10.1016/j.scitotenv.2024.178196
[54] USEPA. (2024). Regional screening levels (RSLs)—Generic tables. https://www.epa.gov/risk/regional-screening-levels-rsls-generic-tables.
[55] Kowalczyk, E., Givelet, L., Amlund, H., Sloth, J.J., Hansen, M. (2022). Risk assessment of rare earth elements, antimony, barium, boron, lithium, tellurium, thallium and vanadium in teas. EFSA Journal, 20(S1): e200410. https://doi.org/10.2903/j.efsa.2022.e200410
[56] Jonjev, M., Miletić, Z., Pavlović, D., Matić, M., Čakmak, D., Mitrović, M., Pavlović, P. (2024). Health risk assessment of potentially toxic elements in the riparian zone of the Sava River (southeastern Europe): Effects of high and low water events. Environmental Sciences Europe, 36(1): 133. https://doi.org/10.1186/s12302-024-00952-3
[57] Zimik, H.V., Farooq, S.H., Prusty, P. (2021). Source characterization of trace elements and assessment of heavy metal contamination in the soil around Tarabalo geothermal field, Odisha, India. Arabian Journal of Geosciences, 14(11): 988. https://doi.org/10.1007/s12517-021-07366-y
[58] Monged, M.H., Hussein, M.T., Khater, A.E. (2018). Elemental and radiological aspects of geothermal springs and nearby soil and sediment of Al-Lith area: Concentration and risk assessment. Environmental Earth Sciences, 77(12): 427. https://doi.org/10.1007/s12665-018-7602-4
[59] Herdianita, N.R., Priadi, B. (2008). Arsenic and mercury concentrations at several geothermal systems in West Java, Indonesia. Journal of Mathematical and Fundamental Sciences, 40(1): 1-14. https://doi.org/10.5614/itbj.sci.2008.40.1.1
[60] Shakeri, A., Fard, M.S., Mehrabi, B., Mehr, M.R. (2020). Occurrence, origin and health risk of arsenic and potentially toxic elements (PTEs) in sediments and fish tissues from the geothermal area of the Khiav River, Ardebil Province (NW Iran). Journal of Geochemical Exploration, 208: 106347. https://doi.org/10.1016/j.gexplo.2019.106347
[61] Gao, J., Gong, J., Yang, J., Wang, Z., Fu, Y., Tang, S., Ma, S. (2023). Spatial distribution and ecological risk assessment of soil heavy metals in a typical volcanic area: Influence of parent materials. Heliyon, 9(1): e12993. https://doi.org/10.1016/j.heliyon.2023.e12993
[62] Xu, J., Chen, Y., Zheng, L., Liu, B., Liu, J., Wang, X. (2018). Assessment of heavy metal pollution in the sediment of the main tributaries of Dongting Lake, China. Water, 10(8): 1060. https://doi.org/10.3390/w10081060
[63] Wang, J., Tao, L., Ren, H., Xue, X., Yang, Z., Jiang, Y., Ren, J. (2025). Assessment of heavy metal contamination, distribution, and source identification in surface sediments from the mid–upper reaches of the Yellow River. Toxics, 13(3): 150. https://doi.org/https://doi.org/10.3390/toxics13030150
[64] Yu, B., Lu, X., Fan, X., Fan, P., Zuo, L., Yang, Y., Wang, L. (2021). Analyzing environmental risk, source and spatial distribution of potentially toxic elements in dust of residential area in Xi’an urban area, China. Ecotoxicology and Environmental Safety, 208: 111679. https://doi.org/10.1016/j.ecoenv.2020.111679
[65] Xu, L., Dai, H., Skuza, L., Xu, J., Shi, J., Wang, Y., Shentu, J., Wei, S. (2022). Integrated survey on the heavy metal distribution, sources and risk assessment of soil in a commonly developed industrial area. Ecotoxicology and Environmental Safety, 236: 113462. https://doi.org/10.1016/j.ecoenv.2022.113462
[66] Ahamad, M.I., Song, J., Sun, H., Wang, X., Mehmood, M.S., Sajid, M., Su, P., Khan, A.J. (2020). Contamination level, ecological risk, and source identification of heavy metals in the hyporheic zone of the Weihe River, China. International Journal of Environmental Research and Public Health, 17(3): 1070. https://doi.org/10.3390/ijerph17031070
[67] Shoedarto, R.M., Tada, Y., Kashiwaya, K., Koike, K., Iskandar, I. (2020). Specifying recharge zones and mechanisms of the transitional geothermal field through hydrogen and oxygen isotope analyses with consideration of water-rock interaction. Geothermics, 86: 101797. https://doi.org/10.1016/j.geothermics.2019.101797