Aflizar*![]() | Edi Syafri
| Edi Syafri![]() | Amrizal
| Amrizal![]() | Roni Afrizal
| Roni Afrizal![]() | Ahmad Fudholi
| Ahmad Fudholi![]()
© 2025 The authors. This article is published by IIETA and is licensed under the CC BY 4.0 license (http://creativecommons.org/licenses/by/4.0/).
OPEN ACCESS
Soil acidification strongly influences agricultural productivity and watershed resilience in tropical volcanic landscapes. This study examined the spatial distribution and geochemical controls of soil pH in the Sumani watershed, West Sumatra, Indonesia. The mean soil pH was 5.51 (SD = 0.42), with significant correlations to erosion drivers—positively with the USLE R factor (r = 0.17*) and negatively with the LS factor (r = –0.21**). Exchangeable Ca, Mg, K, Na, and available Si were positively associated with higher pH values. USLE modeling indicated moderate to severe erosion in upland areas, contributing to persistent acidification, while depositional zones showed slightly acidic soils. The lowest pH (4.64) was found in intensively cultivated vegetable fields, where frequent nitrogen fertilization and pesticide use increased exchangeable acidity. In contrast, irrigated rice paddies maintained higher pH (mean = 5.61), supported by irrigation water and volcanic ash inputs. These results emphasize long-term acidification trends and highlight the need for integrated management combining liming, silicon supplementation, balanced NPK fertilization, and erosion control to sustain rice yields above 10 t ha⁻¹ and ensure watershed sustainability.
soil pH, volcanic ash, LS-factor, USLE, irrigated rice paddies, exchangeable cations
Soil pH is a fundamental parameter that affects nutrient availability, microbial activity, and crop productivity, particularly in paddy fields. Despite its importance, soil pH is often overlooked in rice field management, and systematic monitoring remains limited in Indonesia. In many rice-producing regions, stagnant yields may be linked to increasing soil acidity [1]. Long-term studies have shown that continuous rice cultivation can gradually lower soil pH, reducing soil fertility and plant health [2]. For example, studies [3, 4] reported a 4.2% decline in soil pH over 30 years of rice farming. These results highlight the need for improved soil monitoring and management strategies, especially in areas with intensive rice cultivation. Because erosion may redistribute substances that affect pH, this needs to be quantified.
One major challenge in managing soil health is soil erosion, which is influenced by land use, slope, rainfall, and vegetation cover. Erosion can reduce land productivity by degrading topsoil and altering soil chemical properties. However, direct measurement of erosion across large areas is difficult due to logistical constraints. As a result, erosion modeling has become an essential tool for assessing soil loss and planning conservation practices. Among these models, the Universal Soil Loss Equation (USLE) is widely used because of its simplicity and adaptability to various environmental settings [5, 6]. Recent studies have used USLE to estimate not only erosion risk but also the movement of soil nutrients and minerals, such as plant-available silicon (Si) [7]. While model choice depends on the research focus and site characteristics, USLE remains a practical option for erosion assessment in Indonesian watersheds [8, 9].
In the Sumani Watershed (SW), West Sumatra, soil pH variability is likely affected by both natural and human factors. These include fertilizer inputs, volcanic ash, irrigation water quality, and land use changes. Topography and erosion may also play roles in redistributing soil particles and nutrients, leading to spatial differences in soil pH. Generally, upland soils, especially those formed from volcanic materials, tend to have higher pH due to limited weathering and the presence of fresh base-rich minerals [7, 10, 11]. In contrast, lowland paddy soils often exhibit lower pH due to flooding, leaching, and long-term rice cultivation. Volcanic ash contributes essential elements like Ca, Mg, and Si, which help regulate soil acidity [7, 10, 12].
Soil pH is further influenced by the availability of exchangeable cations such as Ca, Mg, K, and Na, along with Fe and Al concentrations. Organic matter and total carbon (TC) also affect pH buffering capacity. In some cases, irrigation water from volcanic areas may bring in neutral or slightly alkaline minerals, temporarily balancing soil acidity. However, the effectiveness of these natural buffering processes appears to be declining. Studies [3, 4] observed that despite increasing signs of soil acidification, policy and management responses have been slow. Many farmers assume that rice can still grow well on acidic soils and see no urgent need for liming [13]. This perception has resulted in minimal interventions, even in areas showing declining soil pH. Land use change in the Sumani Watershed, particularly the conversion of forested uplands to agricultural land, has intensified erosion. Eroded sediments from uplands may carry base-rich materials that, when deposited in downstream paddies or sawah, could temporarily raise soil pH. This suggests a potentially positive, though limited, role of erosion in buffering soil acidity [7]. Nonetheless, such effects are likely short-term and do not replace the need for long-term soil management.
Nutrient distribution across landscapes is also influenced by erosion and land use. Elements such as total nitrogen (TN), total phosphorus (TP), Si, and TC show spatial variability associated with erosion intensity and land cover types [14, 15]. Mapping these spatial patterns can help inform sustainable land use strategies and improve soil fertility management. Despite this, the relationship between soil erosion and pH distribution remains understudied, especially in tropical volcanic watersheds like Sumani. While some research has linked erosion to nutrient redistribution, its role in shaping soil acidity, particularly in paddy sawah, has not been clearly examined.
We propose that soil erosion may contribute to the spatial variability of soil pH in the Sumani Watershed, particularly by transporting base-rich sediments from uplands to lowland paddies sawah. This challenges the common perception that erosion is only harmful, suggesting that, under specific conditions, it may temporarily help regulate soil acidity. This study aims to analyze the spatial variation of soil pH in the Sumani Watershed and identify the main soil properties and environmental factors that influence it. Specifically, we examine the role of available Si, TC, exchangeable cations (Ca, Mg, K, Na), and metals (Fe, Al) under different land use types. We also explore how erosion may redistribute these elements across the landscape using USLE modeling. By integrating soil chemical analysis with land use and erosion data, this study seeks to advance our understanding of soil pH dynamics in volcanic rice-growing regions. The results are expected to support more effective and site-specific soil management practices in Indonesia’s agricultural watersheds.
2.1 Study area and sampling strategy
This study was conducted in the Sumani Watershed (SW), Solok Regency, West Sumatra, Indonesia (00° 36′ 08′′ to 10° 44′ 08′′ S and 100° 24′ 11′′ to 101° 15′ 48′′ E). The area includes Mount Talang (2,500 m asl), extending from the uplands to Lake Singkarak (300 m asl). The region has a humid tropical climate with annual rainfall of 1,669–3,230 mm and temperatures ranging from 19℃ to 30℃, depending on elevation [7]. Relative humidity ranges between 78.1% and 89.4%. The watershed was selected due to (1) availability of erosion data, (2) diverse land use types including paddy fields, forests, plantations, vegetables, and shrubs (Figure 1), and (3) its role as a major rice production area. Sampling points are shown in Figure 1, with blue and red markers indicating soil and sediment samples. Soil samples were collected at depths of 0–20 cm and 20–40 cm, with deeper cores up to 100 cm taken for vertical analysis. Sediment samples were collected from six river sites across different altitudes. The watershed includes eight geological formations, such as volcanic breccia, tuff, lava, and shale (Tuhur Formation). SW is divided into five sub-watersheds: Sumani (S1), Lembang (S2), Gawan (S3), Aripan (S4), and Imang (S5) [7]. Mount Talang's eruptions influence soil fertility. The 2005 eruption deposited ash layers up to 5 cm near the summit. Volcanic ash had pH H₂O 7.26, Bray 2 P at 68.02 mg/kg, and high total P (498.12 mg/kg) [7]. The CEC was 5.75 cmolc(+)/kg; exchangeable cations included Ca (11.14), Mg (2.18), K (0.09), Na (0.12) cmolc(+)/kg. Volcanic glass and labradorite were dominant ash components. Active Al and Fe were 0.60% and 1.99%, respectively.
2.2 Paddy sawah systems
Paddy sawah refers to irrigated, leveled rice fields. In SW, rice is grown three times annually in lowlands and twice in uplands, with vegetable rotation in the latter. Since 1974, lime has not been applied to lowland fields, though uplands receive annual lime inputs. Fertilizers include urea, SP-36, and KCl or compound fertilizers, applied at 46–184 kg N/ha, 36–72 kg P₂O₅/ha, and 6.3–63 kg K₂O/ha. However, KCl is often omitted due to perceived low benefits. Farmers typically burn rice straw post-harvest to facilitate preparation and pest control [7]. Lime application is generally avoided because farmers depend on the natural fertility of volcanic ash soils and receive limited technical support from agricultural extension services.
2.3 Sample collection
A total of 146 soil samples were collected across land use types and topographies. Six sediment samples were taken for pH analysis (H₂O, 1:2.5). Samples were air-dried, sieved (< 2 mm), and plant species were recorded at sampling points. Water samples were collected monthly (August–February) from five river sites along an upstream–downstream gradient for pH measurement. Fieldwork was supported by local farmers, Politeknik Pertanian Negeri Payakumbuh, and Andalas University.
2.4 Soil and water analysis
From the total samples, 146 were analyzed for chemical properties (Figure 1). pH H₂O (1:2.5) was measured using a glass electrode and an ICP spectrometer (Shimadzu ICPS2000). Total carbon (TC) was determined via dry combustion using a CN Corder (Yanaco MT-700) following [7]. Base cations (Ca, Mg, K, Na) were extracted with 1 M ammonium acetate [4] and measured via ICP or AAS (Shimadzu AS 680). Exchangeable acidity was analyzed using 1 M KCl and titration with NaOH. Available Fe was extracted with 0.1 M HCl. Available Si was extracted using acetate buffer (pH 4.0), incubated at 40℃ for 5 hours, and measured with the molybdenum-blue method at 810 nm. Water silica was analyzed using AAS (Hitachi Z-5000). Soil texture (sand and clay) was determined by the pipette method [7].
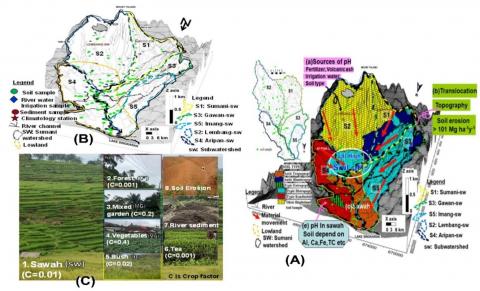
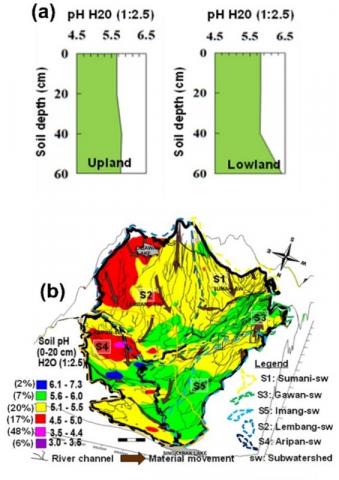
Figure 1. (A) Spatial distribution of soil pH in the Sumani Watershed (SW), influenced by natural factors (e.g., topography, soil properties) and anthropogenic activities (e.g., fertilizer application, irrigation), (B) Sampling locations, (C) Land use types, paddy fields, forests, mixed gardens, vegetable farms, shrublands, tea plantations, river sediments, and erosion-affected areas are indicated
2.5 Soil erosion assessment using USLE
Soil erosion was estimated using the Universal Soil Loss Equation (USLE) [5]:
E = R × K × L × S × C × P (1)
where, E is erosion (t/ha/year), R is rainfall erosivity, K is soil erodibility, L is slope length, S is slope steepness, C is cover management, and P is conservation practice. SW was divided into 39,312 grid cells (125 × 125 m), each with data on land use, rainfall, elevation, and soil properties. Kriging interpolation was used; negative values were excluded. USLE was chosen due to its simplicity and suitability for regional data [7].
2.5.1 The rainfall erosivity factor (R) and soil erodibility factor (K)
Rainfall erosivity (R) was calculated using:
R = 6.19(Rf)1.21(Rn)-0.47 (Rm)0.53 (2)
where, Rf is the total monthly rainfall, Rn is the number of rainy days, and Rm is the 24-h maximum rainfall [7]. Rainfall varied by year, with no distinct dry season. Kriging was applied where data were missing [16-18].
A clearly defined dry season was absent in the Sumani Watershed, leading to the absence of a consistent seasonal cycle in both monthly rainfall and the rainfall erosivity factor (R). The analysis indicated substantial interannual variability in seasonal rainfall distribution. Precipitation data were obtained from four climatological stations located within the watershed, namely Sumani, Sanding Baka, and Sukarami stations, which provided the primary basis for rainfall erosivity estimation.
Soil erodibility (K) was calculated as:
100K= 2.713 M 1.14 (10 -4) (12-a) +3.25(b-2) +2.5(c-3) (3)
where, M = [(St – Svf)/100] – Cf; St = silt, Svf = very fine sand, Cf = clay; a = organic matter (%), b = structure class, c = permeability class [7]. Soil data were systematically collected through field surveys and are presented in Tables 1 and 2. The accuracy and reliability of the model largely depend on the rainfall erosivity factor (R) and the soil erodibility factor (K), both of which are essential indicators of local environmental conditions and therefore require thorough evaluation. Nevertheless, several grid cells lacked adequate rainfall records and/or soil analytical data necessary for the direct calculation of these factors. To address this limitation, an interpolation procedure was applied using the nearest neighbor kriging method, in which values were assigned from the closest grid cell containing complete soil analysis data. This geostatistical approach has been widely acknowledged as effective for handling spatial data gaps and has demonstrated robust performance in producing reliable estimates, as also highlighted in previous research.
2.5.2 Slope length and steepness factor (LS)
Slope length and steepness (LS) were estimated using two equations [8]:
For slopes < 20%:
LS = (L/22)m (65.41 sin 2 X – 4.56 sin X + 0.065) (4)
For slopes > 20%:
LS = (L/22)0.7 (6.432 sin (X 0.79) cos (X)) (5)
where, L is slope length (m), X is slope angle (°), and m varies with gradient (Table 1 and Table 2). In this study, each grid cell was considered as an independent slope unit for the estimation of topographic influence on soil erosion. The LS-factor, which integrates slope length (L) and slope steepness (S), was calculated using the standard equation described above. Previous findings have indicated that the slope length exponent within this equation does not vary significantly when the slope gradient increases from 3% to 17%. However, variations were observed for slopes with gradients less than 3%, where the relationship between slope length and erosion potential becomes nonlinear. To address these differences, two distinct formulations were employed based on slope classes: Eq. (4) was applied to slopes with gradients < 20%, while Eq. (5) was used for slopes exceeding 20%. This stratified approach ensured a more accurate representation of topographic effects across varying slope conditions and minimized potential biases in erosion factor estimation.
2.5.3 The cover management factor (C) and conservation practice factor (P)
The cover management factor (C) and conservation practice factor (P) values were derived from land use types in the Sumani watershed, which were analyzed using Landsat TM imagery (2023) and Google Earth images (2023). These datasets were further verified through direct field surveys conducted in the watershed in August 2023 and cross-checked with land use maps compiled from aerial photographs in 2003. Both the C and P factors represent land use characteristics that are relatively consistent across regions, yet they differ according to specific land use types. Each land use class was assigned a distinct C-factor value, with forest areas consistently exhibiting the lowest, while vegetable gardens recorded the highest, except for settlement areas. Dominant soil conservation practices observed in the Sumani Watershed included ground cover with grasses or shrubs in vegetable, mixed, and coconut gardens, as well as terracing in irrigated paddy fields (Figure 1). The P-factor, defined as the erosion ratio associated with a specific conservation technique, was assigned to each land use category. Since farmers in the watershed generally apply similar conservation practices within the same land use type, the P-factor values were determined based on standardized recommendations from the USLE framework. This combination of remote sensing, field validation, and established parameterization ensured a robust and spatially consistent representation of C and P values for subsequent erosion modeling.
Table 1. Soil pH H₂O (1:2.5) and erosion factor analysis at sampling sites in the Sumani Watershed
|
Sub Watershed |
Land Use |
Statistic |
R |
K |
LS |
C |
P |
Erosion Ton/ha/y |
pH H2O (0-20) |
pH H2O Status in Soil |
|
Sumani |
Sawah, mixed garden, tea, forest, bush |
Mean+SD |
3501.9 + 827.39 |
0.1545 + 0.09 |
0.54 + 0.99 |
0.089 + 0.112 |
0.52 + 0.21 |
7.77 + 18.85 |
5.57 + 0.28 |
sla |
|
Average |
3501.93 |
0.15 |
0.54 |
0.09 |
0.52 |
7.77 |
5.57 |
sla |
||
|
Max |
4005.10 |
0.30 |
3.61 |
0.40 |
1.00 |
97.88 |
6.15 |
n |
||
|
Min |
2175.40 |
0.02 |
0.001 |
0.001 |
0.40 |
0.003 |
4.98 |
ea |
||
|
SD |
827.39 |
0.09 |
0.99 |
0.112 |
0.21 |
18.85 |
0.28 |
|
||
|
N |
40 |
|
|
|
|
|
|
|
||
|
Lembang |
Sawah, mixed garden, vegetables, forest, bush |
Mean+SD |
3406.288 + 866.44 |
0.29 + 0.81 |
0.61 + 1.01 |
0.09 + 0.11 |
0.47 + 0.14 |
9.83 + 29.39 |
5.36 + 0.44 |
ma |
|
Average |
3406.29 |
0.29 |
0.61 |
0.09 |
0.47 |
9.83 |
5.36 |
ma |
||
|
Max |
4005.10 |
6.10 |
3.40 |
0.40 |
1.00 |
156.36 |
6.21 |
n |
||
|
Min |
2175.39 |
0.001 |
0.001 |
0.001 |
0.40 |
0.001 |
4.42 |
ea |
||
|
SD |
866.44 |
0.81 |
1.01 |
0.11 |
0.14 |
29.39 |
0.44 |
|
||
|
N |
55 |
|
|
|
|
|
|
|
||
|
Imang |
Sawah, mixed garden, bush |
Mean+SD |
3333.10 + 920.17 |
0.20 + 0.10 |
0.52 + 1.12 |
0.10 + 0.13 |
0.54 + 0.26 |
40.33 + 89.94 |
5.85 + 0.30 |
sla |
|
Average |
3333.10 |
0.20 |
0.52 |
0.10 |
0.54 |
40.33 |
5.85 |
sla |
||
|
Max |
4005.10 |
0.30 |
2.51 |
0.29 |
1.00 |
201.22 |
6.13 |
n |
||
|
Min |
2325.10 |
0.10 |
0.001 |
0.01 |
0.40 |
0.001 |
5.37 |
ma |
||
|
SD |
920.17 |
0.10 |
1.12 |
0.13 |
0.26 |
89.94 |
0.30 |
|
||
|
N |
5 |
|
|
|
|
|
|
|
||
|
Gawan |
Sawah, mixed garden, forest |
Mean+SD |
4005.1 + 0.0 |
0.27 + 0.08 |
0.81 + 1.05 |
0.09 + 0.10 |
0.59 + 0.25 |
34.06 + 86.74 |
5.58 + 0.21 |
ma |
|
Average |
4005.10 |
0.27 |
0.81 |
0.09 |
0.59 |
34.06 |
5.58 |
ma |
||
|
Max |
4005.10 |
0.30 |
2.51 |
0.20 |
1.00 |
301.82 |
5.85 |
sla |
||
|
Min |
4005.10 |
0.090 |
0.001 |
0.001 |
0.40 |
0.0004 |
5.26 |
ma |
||
|
SD |
0.00 |
0.08 |
1.05 |
0.10 |
0.25 |
86.74 |
0.21 |
|
||
|
N |
12 |
|
|
|
|
|
|
|
||
|
Aripan |
Sawah, mixed garden, forest, bush |
Mean+SD |
3708.63 + 650.08 |
0.22 + 0.13 |
0.37 + 0.76 |
0.14 + 0.23 |
0.49 + 0.17 |
88.78 + 269.55 |
5.61 + 0.55 |
sla |
|
Average |
3708.63 |
0.22 |
0.37 |
0.14 |
0.49 |
88.78 |
5.61 |
sla |
||
|
Max |
4005.10 |
0.48 |
2.14 |
0.95 |
1.00 |
1191.96 |
7.22 |
n |
||
|
Min |
2325.10 |
0.09 |
0.001 |
0.001 |
0.40 |
0.001 |
4.18 |
ea |
||
|
SD |
650.08 |
0.13 |
0.76 |
0.23 |
0.17 |
269.55 |
0.55 |
|
||
|
N |
34 |
|
|
|
|
|
|
|
where, ea = extremely acidic (pH 3.5–4.4); sa = strongly acidic (pH 4.5–5.0); ma = moderately acidic (pH 5.1–5.5); sla = slightly acidic (pH 5.6–6.0); n = neutral (pH 6.1–7.3); ), according to the USDA–NRCS soil reaction classification [19].
2.6 3D mapping and data processing
Data were processed using Surfer® 9 and 11, incorporating USLE results, DEMs, and soil and land use maps. Block kriging produced smoothed maps of pH, erosion, and land use. Surfer® is widely used in environmental studies, though rarely documented in literature [7]. Universal kriging assumes constant unknowns. Steep, inaccessible areas were excluded. Cross-validation assessed kriging accuracy (Figure 1). We used Pearson’s correlation to test the relationships between soil pH and key physicochemical and erosion-related variables (texture, bulk density, organic matter, exchangeable cations, acidity, available Si, extractable Fe, total carbon, and USLE factors). Significance was evaluated at p < 0.05 and p < 0.01. All analyses were carried out in Microsoft Excel.
3.1 Description of soil physical and chemical properties
The soils showed a texture dominated by silt (59.1%), with relatively low sand (14.1%) and moderate clay (26.8%). Texture plays a central role in regulating soil chemical behavior, as it controls surface area, cation exchange capacity (CEC), and the ability of soils to retain or release H⁺ and base cations. Although higher clay content generally enhances ion retention and pH buffering, this capacity depends strongly on mineralogy. High-activity clays, such as montmorillonite and illite, provide much greater buffering than low-activity kaolinite, which is common in highly weathered tropical soils. Thus, even with a moderate clay content, the buffering capacity in these soils may be limited. The high silt fraction also suggests abundant fine particles that hold water and organic matter, influencing leaching and nutrient mobility, and ultimately shaping soil pH dynamics in the watershed (Tables 1 and 2).
High rainfall erosivity (R), soil erodibility (K), and steep slopes (LS) contribute to erosion risk. Crop cover (C) is low, while conservation practices (P) are relatively effective. According to study [5], high R and K values elevate erosion potential. Soil erosion is also influenced by physical, chemical, and biological factors. Soils are moderately acidic, with a mean pH H₂O of 5.61 and low available silicon (Si). Total carbon (TC) and exchangeable acidity are high. Among base cations, calcium (Ca) and magnesium (Mg) are dominant, while potassium (K) and sodium (Na) are present in moderate levels (Table 2). Soil pH classification at 0–20 cm shows that 91% of paddy fields are acidic: 1% extremely, 18% strongly, 38% moderately, and 40% slightly acidic. Based on the report [17], FAO (1976) standards, 49% of soils are classified as highly suitable (S1: pH 5.5–7.8), 38% as moderately suitable (S2: 5.2–5.5), and 18% marginally suitable (S3: < 5.2). However, when low Si is considered a limiting factor, 99% fall under S3. Since the 1974 Green Revolution, Indonesia has emphasized NPK fertilizers and pesticides, but not liming. Consequently, soil acidity continues to increase. According to Liebig’s Law, crop production is limited by the most deficient element [18]. In this case, low pH and Si restrict rice yield. Unfortunately, Si and lime applications remain uncommon in the region [7].
Soil properties in the Sumani watershed revealed complex interactions with pH. Organic matter and total carbon were negatively correlated with pH, suggesting that sites rich in humus or soluble organic acids tended to be more acidic. In contrast, base cations (Ca²⁺, Mg²⁺, K⁺, Na⁺) were positively related to pH, while exchangeable acidity (Al³⁺, H⁺) strongly reduced it, confirming the central role of base saturation in soil buffering. Available Si also showed a positive link with pH, likely reflecting Si-rich parent materials that release base cations. Low bulk density and variable extractable Fe indicated high porosity and redox-driven shifts influencing acidity. Finally, erosion factors highlighted that steep slopes enhance topsoil loss and acidity, whereas depositional areas may retain higher pH due to sediment or volcanic inputs.
3.2 Soil pH H₂O and related physicochemical factors
Table 3 confirms that paddy fields and adjacent lands (forests, tea plantations) have slightly acidic soils (mean pH H₂O = 5.61), while vegetable plots are more acidic. Yields > 5.6 t/ha are typically obtained at neutral pH (> 6.1). Optimal productivity occurs at pH 5.6–7.0 (S1 class). Soil pH is buffered by surface water (pH 6.9–9.0), sediment deposition (pH 5.43–6.10), and topsoil pH (4.18–7.22). Despite abundant base cations, soils remain acidic due to high exchangeable acidity from H+ and Al ions. Al hydrolysis contributes to H+ release, lowering pH. Intensive cropping and post-harvest burning also reduce pH over time [3, 4]. To raise productivity (> 6–10 t/ha), soil pH must increase to 6.1–7.3. Lime application using local limestone is recommended. The required lime (ton/ha) = (target pH – actual pH) × 3. For example, raising pH from 4.18 to 7.3 would require 9.4 tons CaCO₃/ha. Table 4 compares SW pH values with Java and Bangladesh. SW soils are more acidic, likely due to long-term urea and ammonium sulfate use, along with pesticides. In Java, pH declined from 6.7–7.1 in the 1970s to 5.8–5.9 in 2003. In Bangladesh, pH fell from 6.67 (1967) to 5.9 (1995). Similar trends are observed in SW, despite volcanic ash inputs.
Table 2. General physicochemical properties of soils in the Sumani Watershed
|
Soil Physicochemical |
Mean |
Criteria |
(Range) |
SD |
r |
|
Sand 0.05-2 mm(%) |
14.07 |
l |
(2.0-59.4) |
10.78 |
-0.038 |
|
Silt 0.02-0.002 mm(%) |
59.11 |
h |
(17.1-85.4) |
16.56 |
0.03 |
|
Clay < 0.002 mm(%) |
26.82 |
m |
(9.2-80.16) |
17.76 |
-0.009 |
|
Organic matter (g/kg) |
48.82 |
m |
(4.99-260.94) |
43.18 |
-0.24** |
|
Bulk density (g/ cm3) |
0.84 |
l |
(0.505-1.27) |
0.20 |
0.12 |
|
Erosivity factor (R-factor) |
2231.90 |
h |
(1288-2452) |
387.10 |
0.17* |
|
Soil Erodibility (K-factor) |
0.23 |
m |
(0.001-6.1) |
0.50 |
0.09 |
|
Topography factor (LS-factor) |
0.55 |
l |
(0.001-3.61) |
0.95 |
-0.21** |
|
Crop factor (C-factor) |
0.10 |
l |
(0.001-0.95) |
0.15 |
0.04 |
|
Conservation practices (P-factor) |
0.50 |
h |
(0.4-1) |
0.18 |
0.04 |
|
Total Carbon (g/kg) |
28.32 |
h |
(2.9-151.36) |
25.05 |
-0.24** |
|
Exchangeable Ca (cmolc (+)/ kg) |
10.72 |
h |
(0.023-29.70) |
5.61 |
0.43** |
|
Exchangeable Mg (cmolc (+)/ kg) |
4.32 |
h |
(0.093-15.65) |
2.99 |
0.48** |
|
Exchangeable K (cmolc (+)/ kg) |
0.39 |
m |
(0.041-1.85) |
0.35 |
0.22** |
|
Exchangeable Na(cmolc (+)/ kg) |
0.85 |
m |
(0.002-3.73) |
0.60 |
0.45** |
|
Exc. Acidity (cmolc (+)/ kg) |
5.26 |
h |
(4.15-7.88) |
1.14 |
-0.72** |
|
Available Si 0–20 cm (mg SiO2/ kg) |
299.80 |
l |
(89.36-1115.36) |
177.21 |
0.23** |
|
Extractable Fe (mg/kg) |
204.20 |
h |
(0.02–1500.6) |
289.00 |
-0.005 |
|
Soil pH H2O 1:2.5 |
5.51 |
ma |
(4.18-7.22) |
0.43 |
|
**, P-value < 0.01; *, P-value < 0.05. SD = standard deviation; r = correlation; h = high; m = medium; l = low; ma = moderately acidic; ea = extremely; sa = strongly acidic; ma = moderately acidic; sla = slightly acidic; n = neutral. Soil pH H₂O classification follows USDA NRCS [19]; Available Si classification follows studies [20, 21]; exchangeable acidity criteria follow study [22]; exchangeable Ca, Mg, K, and Na classifications and criteria for R, K, LS, C, P factors, and TC are based on study [23].
Table 3. Mean soil pH H₂O (1:2.5) and major physicochemical properties in the Sumani Watershed
|
Site |
Exchangable Na |
Exchangable K |
Exchangable Mg |
Exchangable Ca |
Available Si |
TC |
Extractable Fe |
Exchangable Acidity |
pH |
|
(cmolc/ kg) |
(mg SiO2 /kg) |
(g /kg) |
(mg /kg) |
(cmolc/ kg) |
|||||
|
River Sediment (n = 6) |
1.13 (h) |
0.66 (h) |
8.65 (h) |
13.98 (h) |
535.25 (m) |
15.72 (l) |
50.81 (h) |
4.59 (h) |
5.81 (sla) |
|
Bush (n = 7) |
0.39 (m) |
0.53 (m) |
3.16 (h) |
12.17 (h) |
355.05 (m) |
32.53 (m) |
191.05 (h) |
5.55 (h) |
5.62 (sla) |
|
Forest (n = 8) |
0.4 (m) |
0.44 (m) |
3.13 (h) |
10.91 (h) |
319.15 (m) |
49.98 (m) |
16.2 (h) |
4.97 (h) |
5.59 (sla) |
|
Tea (n = 2) |
0.25 (l) |
0.22 (l) |
0.87 (m) |
6.07 (h) |
272.36 (l) |
123.89 (h) |
16.28 (h) |
4.39 (h) |
5.25 (ma) |
|
Vegetables (n = 2) |
0.28 (l) |
1.28 (vh) |
1.21 (h) |
7.33 (h) |
153.11 (l) |
26.68 (m) |
154.79 (h) |
4.33 (h) |
4.64 (sa) |
|
Mixed garden (n = 46) |
0.62 (m) |
0.47 (m) |
4.62 (h) |
11.35 (h) |
386.26 (m) |
23.95 (m) |
112.83 (h) |
5.32 (h) |
5.51 (ma) |
|
Sawah (n = 77) |
1.2 (h) |
0.33 (l) |
4.57 (h) |
11.76 (h) |
254.98 (l) |
21.96 (m) |
292.1 (h) |
5.28 (h) |
5.61 (sla) |
where, h = high; m = medium; l = low; ma = moderately acidic; ma = moderately acidic; ea = extremely; sa = strongly acidic; ma = moderately acidic ; sla = slightly acidic; n = neutral.
Table 4. Average soil pH H₂O (0–20 cm depth) in paddy fields of the SW region, other Indonesian watersheds, and international sites
|
Study (Reference) |
Location |
Area (km2) |
Number of Soil Samples |
pH H2O in Soil (0–20 cm) Depth |
|
Sumani subwatershed (S1), sawah |
Sumatera Island |
176.7 |
19 |
5.63 (sla) |
|
Lembang subwatershed (S2), sawah |
Sumatera Island |
191.8 |
34 |
5.37 (ma) |
|
Gawan subwatershed (S3), sawah |
Sumatera Island |
80.4 |
5 |
5.64 (sla) |
|
Aripan subwatershed (S4), sawah |
Sumatera Island |
70.4 |
16 |
5.62 (sla) |
|
Imang subwatershed (S5), sawah |
Sumatera Island |
64 |
3 |
5.81 (sla) |
|
Sumani watershed, sawah |
Sumatera Island |
583.3 |
77 |
5.61 (sla) |
|
Citarum Watershed, sawah [13] |
Java Island |
6949 |
30 |
6.4 (n) |
|
Kaligarang Watershed, sawah [13] |
Java Island |
210 |
19 |
6.13 (n) |
|
Java, sawah in the year 1970 [3, 4] |
Java Island |
|
46 |
6.9 (n) |
|
Java, sawah in the year 2003 [3, 4] |
Java Island |
|
46 |
5.84 (sla) |
|
Java, Sawah Seedfarm in the year 1970 [3, 4] |
Java Island |
|
18 |
7.13 (n) |
|
Java, Sawah Seedfarm in the year 2003 [3, 4] |
Java Island |
|
18 |
5.88 (sla) |
|
Java, sawah Non-Seedfarm in the year 1970 [3, 4] |
Java Island |
|
18 |
6.7 (n) |
|
Java, sawah Non-Seedfarm in the year 2003 [3, 4] |
Java Island |
|
18 |
5.81 (sla) |
|
Bangladesh, sawah in the year 1967 [24] |
Bangladesh |
|
|
6.16 (n) |
|
Bangladesh, sawah in the year 1995 [24] |
Bangladesh |
|
|
5.9 (sla) |
|
Thailand, Mango, Tropical sandy soil in the year 2004 [25] |
Thailand |
|
|
5.2 (ma) |
|
Thailand, Sugarcane, Tropical sandy soil in the year 2004 [25] |
Thailand |
|
|
5.7 (sla) |
|
Thailand, Paddy soil, in the year 2010 [26] |
Thailand |
|
65 |
5.77 (sla) |
|
Thailand, Paddy soil, in the year 1960 [26] |
Thailand |
|
65 |
5.17 (ma) |
|
Philippines, Paddy soil, in the year 2010 [26] |
Philippines |
|
37 |
6.62 (n) |
|
Philippines, Paddy soil, in the year 1960 [26] |
Philippines |
|
37 |
6.39 (n) |
|
Malaysia, Paddy soil, in the year 2017 [26] |
Malaysia |
|
40 |
5.7 (sla) |
|
Malaysia, Paddy soil, in the year 1965 [26] |
Malaysia |
|
40 |
4.7 (sa) |
Soil pH changes in paddy fields are clearly heterogeneous across Southeast Asia (Table 4). Some regions, such as Java and Bangladesh, exhibit notable acidification: in Java, pH dropped from ~6.9 in 1970 to ~5.84 in 2003 due to intensive cultivation, repeated mineral fertilization, and insufficient liming [4], while in Bangladesh, paddy soil pH declined from 6.16 in 1967 to 5.90 in 1995 [24]. In contrast, parts of the Philippines maintained near-neutral pH (~6.4–6.6) over five decades, and Malaysia even showed a pH increase from 4.7 in 1965 to 5.7 in 2017, highlighting the influence of local management practices, fertilization regimes, and parent material characteristics [26].
3.3 Correlation between soil chemistry and pH H₂O
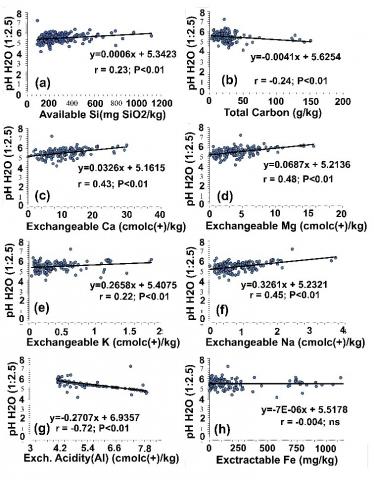
As shown in Figure 2, pH H₂O is positively correlated with exchangeable Ca, Mg, K, Na, and available Si. These nutrients, derived from Mount Talang’s volcanic ash [27], support pH stability. Volcanic ash contains Ca (11.14 cmolc(+)/kg), Mg (2.18), K (0.09), Na (0.12), and amorphous Si (11.15%). Conversely, pH H₂O negatively correlates with TC and exchangeable acidity. This reflects increased soil acidity due to nitrogen fertilizers and continuous rice cultivation. Volcanic ash also contributes to Al, increasing acidity. Fe shows no clear effect on pH, possibly due to weathering [27]. The volcanic ash itself has a pH H₂O of 7.26 and a KCl pH of 7.12, with active Al at 0.60% and Fe at 1.99%. Volcanic ash weathers rapidly, releasing base cations and Si that displace H+ and neutralize acidity. However, Al and Fe released from ash can counteract this effect. Thus, while volcanic ash helps mitigate acidification, it cannot fully offset the long-term impacts of intensive chemical input and cropping. The erosion and transport of these volcanic materials from highland areas to lower elevations in the SW region contribute to their enrichment in the soil.
Figure 2. Correlations between soil pH H₂O (1:2.5) and selected chemical properties, including: (a) available Si, (b) total carbon, (c) exchangeable Ca, (d) exchangeable Mg, (e) exchangeable K, (f) exchangeable Na, (g) exchangeable acidity, and (h) extractable Fe
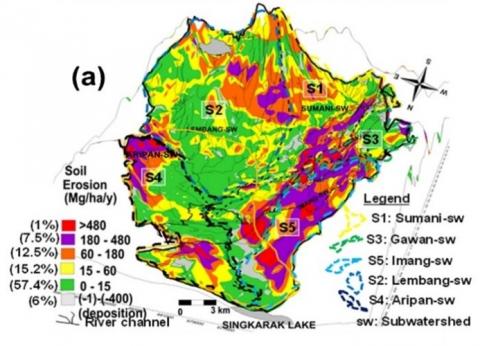
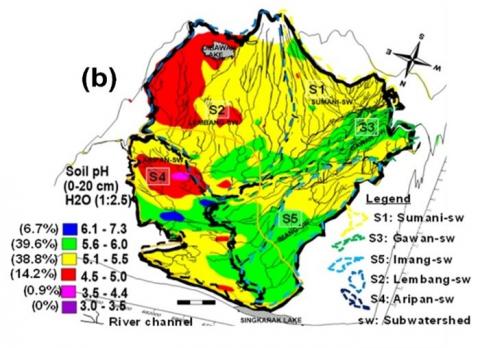
3.4 Spatial distribution of soil erosion and pH H₂O (1:2.5)
Figure 3(a) shows the 3D distribution of soil pH H₂O (1:2.5) in the Sumani Watershed (SW). Highland areas near Mount Talang (S1, S2) have moderately acidic soils (pH 5.1–5.5), while the eastern highlands above Lake Diateh are more acidic (pH 4.5–5.0). Western regions (S1, S3, S5) show both moderately (5.1–5.5) and slightly acidic soils (5.6–6.0), especially in sediment-rich lowlands (S3, S5). Figures 3(a, b) suggest moderate to high erosion on both watershed flanks, contributing to consistent soil pH H₂O in the moderately acidic range. Despite the volcanic ash input from Mount Talang, pH remains unchanged due to erosion-driven redistribution of ash and soil particles, which contributes to acidification. In the eastern highlands, erosion levels range from low to moderate (0–5 tons/ha/year). Frequent nitrogen fertilization and pesticide use in vegetable terraces further reduce pH (4.5–5.0). In S4, where erosion is high, the pH ranges from strongly to moderately acidic. Conversely, lowland deposition zones (S3, S5) with minimal erosion show slightly acidic pH. These patterns underscore the role of erosion and agricultural inputs in controlling soil pH.
Figure 3. (a) 3D soil erosion, (b) spatial distribution of soil pH H₂O
3.5 Vertical and sediment-related pH changes
Figure 4(a) displays vertical pH H₂O profiles across topography. Surface soils are more acidic than subsoils, likely due to nitrogen inputs, pesticides, high TC, and aluminum accumulation from erosion and farming. Erosion emerges as a primary factor in this vertical stratification. Erosion and sedimentation are estimated at 4473 Gg/year and 469.7 Gg/year, respectively, compared to 27 Gg/year of crop production. Sediment pH averages 5.81, slightly higher than the mean soil pH (5.51), while river water pH ranges from 6.9 to 9.04. Sediments contain higher exchangeable Ca, Mg, K, Na, and available Si than original soils (Table 3), indicating nutrient loss and redistribution via erosion. Thus, erosion impacts not only surface but also subsurface soil chemistry, leading to overall acidification under current land-use trends [7]. Figure 4(b) visualizes erosion vectors, indicating transport from uplands (S1–S5) to lowlands (S3, S5), where higher-pH sediments accumulate. This may explain the slightly acidic soils and elevated water pH downstream.
Figure 4. (a) Vertical distribution of soil pH H₂O in upland and lowland areas, (b) material movement in the SW region
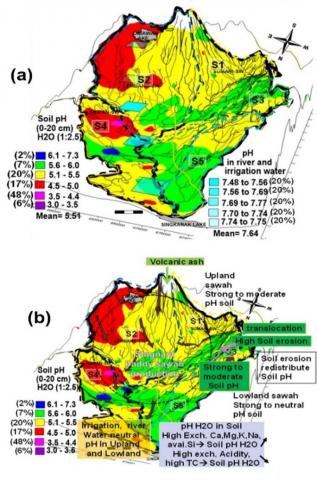
3.6 River and irrigation water pH
Figure 5(a) shows the river and irrigation water pH from August 2006 to February 2007, ranging from 7.48 to 7.75. Upland waters are more alkaline, possibly due to ash deposition, sediment transport, and liming. Volcanic ash from Mount Talang has a pH H₂O of 7.26 and pH KCl of 7.12 [27]. These findings suggest erosion and inputs modify water chemistry.
The pH range of irrigation and river waters in the Sumani Watershed (6.9–9.04) indicates predominantly neutral to moderately alkaline conditions, with some locations exhibiting notably higher values than comparable regional rivers (e.g., Malaysia 5.23–8.40; Brunei 6.31–7.70; Philippines ≈7.0–8.5). These differences are consistent with local heterogeneity in geology (notably the presence of volcanic tephra and buffering minerals), hydrological characteristics, and land-use/ agricultural management practices. Leaching experiments conducted on recent tephra deposits (e.g., Talang Volcano, West Sumatra) demonstrate that initial leachates may produce a rapid drop in pH during early stages; however, subsequent release of basic cations from volcanic materials can confer medium- to long-term buffering effects. Consequently, tropical volcanic watersheds tend to display pronounced pH dynamics, but the direction and magnitude of change are not globally uniform. Therefore, the pH shifts observed in Sumani are more plausibly attributed to a combination of regional controls (tephra geology coupled with local agricultural practices) rather than to a single universal mechanism.
Figure 5. (a) Distribution of pH H₂O in river and irrigation water, (b) spatial pattern of soil pH H₂O influenced by environmental factors
3.7 Interpolation and map validation
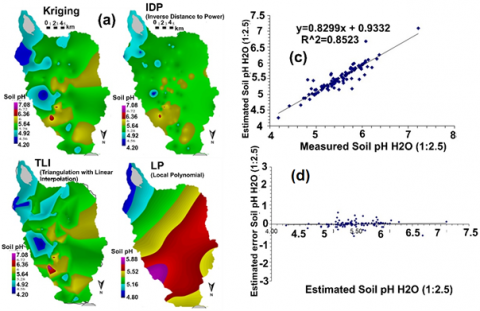
Figure 5(b) summarizes pH H₂O drivers: parent material (USDA-NRCS, 2016), buffering capacity, microbial activity [28-36], organic matter, and farming practices. Erosion removes nutrient-rich topsoil, reduces fertility, and shifts acidity [37]. Redistribution creates spatial pH variation [38]. Organic amendments and conservation tillage are recommended [39]. Model validation, focusing on bias reduction [7]. Kriging interpolation showed the lowest errors (ME, MAE, RMSE) among the four tested methods (Figure 6(a, b)). Figure 6(c) indicates predicted values align with lab data, while Figure 6(d) confirms unbiased error distribution, validating the mapping approach.
Figure 6. (a) Spatial interpolation of soil pH H₂O using Kriging, IDP, TLI, and LP, (b) Validation statistics (ME, MAE, RMSE) for the interpolation methods, (c) Relationship between measured and estimated soil pH H₂O, (d) Relationship between estimated soil pH H₂O and prediction error
3.8 Discussion
According to FAO [17], optimal soil pH (H₂O) for rice falls within 5.5–7.8 (S1—Highly Suitable), with slightly reduced suitability at 5.2–5.5 or 7.8–8.2 (S2—Moderately Suitable), and marginal suitability below 5.2 or above 8.2 (S3). Values outside S1 impair rice productivity due to suboptimal nutrient availability and potential toxicity. In the Sumani Watershed (SW), paddy fields generally show slightly acidic pH H₂O (mean 5.61), placing them within the S1 range, favorable for rice cultivation. In contrast, uplands and vegetable plots often register moderately acidic pH (average 5.1), fitting into the S2 category. This differentiation aligns with land-use intensity, where paddy fields tend to be more intensively managed and supported with irrigation, while non-paddy lands are more exposed to erosion and nutrient loss. Erosion patterns further explain this variation. Using the USLE model, the C factor, which reflects vegetation cover and land management, is lowest in paddy fields, suggesting minimal erosion due to stable surface cover. Conversely, erosion in SW is largely driven by high rainfall erosivity (R), erodible soils (K), and topography (LS). To mitigate erosion and its effects on soil properties, attention should be given to improving vegetation cover (C) and conservation practices (P).
Soil pH in SW ranges from extremely acidic (4.18) to neutral (7.22). The minimal erosion in rice fields appears to have little influence on soil pH, pointing instead to the more dominant roles of fertilizer inputs, liming, and irrigation sources. Analysis of 77 surface soil samples (0–20 cm) shows that 74% are slightly to moderately acidic, 15.6% are strongly to extremely acidic, and only 10.4% are neutral. Spatially, extremely acidic soils (0.9%) are clustered in Aripan sub-watershed (S4), while strongly acidic areas are found in Lembang (S2) and Aripan (S4). Neutral soils are also concentrated in Aripan (S4), while slightly to moderately acidic soils are widely distributed across Lembang (S2), Sumani (S1), Aripan (S4), Imang (S5), and Gawan (S3). Given these acidity levels, lime application (e.g., CaCO₃ or CaO) is necessary to increase rice yields from approximately 6 to 10 tons/ha, as shown by research [7]. The most acidic pH values (as low as 4.64) were observed in vegetable gardens, especially in S1 and S4. This is likely due to intensive fertilizer use, high erosion, and elevated exchangeable acidity. Tea plantations and mixed gardens generally exhibit moderately acidic conditions (5.25–5.51), while slightly acidic soils are more common in forests, bushlands, and riverine sediments, which are less disturbed. These findings are consistent with previous studies [7, 27] linking soil pH to land-use types, management practices, and underlying soil characteristics. Paddy sawah tends to have higher pH compared to uplands, likely due to elevated levels of exchangeable Ca, Mg, and Na, contributions from volcanic ash (notably from Mount Talang), and neutral irrigation water. The presence of volcanic materials—including CaO, Si, Ca, Mg, K, and Na—from Mount Talang and hot springs in the highlands further supports this buffering effect [40].
Table 5. Average pH H₂O of irrigation and river water from the Sumani Watershed and other countries
|
Study (Reference) |
Location |
Area (km2) |
pH H2O in River and Irrigation Water |
|
Irrigation water in the Sumani Watershed (SW) |
Sumatera Island |
176.7 |
6.9 - 8.91 |
|
River water in the Sumani Watershed (SW) |
Sumatera Island |
191.8 |
6.9 - 9.04 |
|
Semenyih River, Selangor, Malaysia [29] |
Malaysia |
1.37- 35.57 |
5.23 - 8.4 |
|
Brunei River, Brunei Darussalam [30] |
Brunei Darussalam |
5765 |
6.31 - 7.7 |
|
Pasig River in the City of Manila, Philippines [31] |
Philippines |
27 km long |
7.0 - 8.5 |
|
Red River in Vietnam [32] |
Vietnam |
156,451 |
7.9 - 8.5 |
|
Mekong River, Camboja [33] |
Camboja |
186,356 |
6.03 - 8.94 |
|
River water quality conditions in Japan [34] |
Jepang |
377,944 |
7.2 - 7.94 |
|
Han River basin, South Korea [35] |
South Korea |
26,219 |
7.0 – 8.4 |
Enhancing productivity beyond 10 tons/ha requires not only increasing soil pH toward neutrality but also improving soil silicon (Si) levels. Lime alone is insufficient due to limited natural Si input from irrigation water, sediment, ash, or soil parent materials. As supported by Table 2 and Table 5, the recommended strategy is to apply 2.0–2.7 tons/ha of lime in conjunction with 165 kg SiO₂/ha to reach ideal soil conditions for rice [7]. This need is heightened by ongoing land-use change and population pressures, with many paddy areas being converted to non-agricultural uses. Table 3 highlights that most land uses in SW exhibit pH H₂O below 6.1, classified as acidic by study [19] and marginally suitable by study [17]. Soils are mostly moderately to strongly acidic, with low Si availability, contributing to stagnant yields and susceptibility to rice diseases.
Different land-use systems exhibit unique soil chemical profiles. Tea plantations show high total carbon (TC), while vegetable gardens have low pH but high exchangeable K and Mg. Paddy soils are typically characterized by slightly acidic pH, low K and Si availability, and high exchangeable acidity. This condition stems from prolonged cultivation without adequate liming or Si inputs and is exacerbated by leaching under high rainfall. Although volcanic ash deposits from Mount Talang are frequent, their contribution is insufficient to counteract the pH decline. The pattern of pH decline in SW parallels findings from Java, where studies [3, 4] reported a 4.2% pH drop in paddy fields after three decades of intensive cultivation. Acidic soils (Figure 2) tend to have high exchangeable acidity, further accelerating acidification. Conversely, slightly acidic soils have more exchangeable bases and available Si, contributing to pH stabilization. This gradient in soil properties likely persists across various SW sub-watersheds. Aluminum (Al) hydrolysis is another key factor in soil acidification. In humid tropical regions like SW, high rainfall promotes Al hydrolysis, releasing hydrogen ions and lowering pH. Unlike base cations that leach easily, Al remains bound to soil colloids and continues to hydrolyze, sustaining soil acidity. In such contexts, liming with CaCO₃ is crucial, as it forms stable Al–Ca complexes, effectively neutralizing Al toxicity [41].
The contrasting land-use systems within the Sumani watershed exhibit distinct soil chemical profiles that reflect the combined influence of geochemical processes, ecological dynamics, and long-term management practices. For example, tea plantations tend to accumulate relatively high total carbon, while vegetable fields are characterized by strongly acidic pH yet elevated levels of exchangeable K and Mg. In contrast, paddy soils typically maintain moderately acidic conditions but display low availability of K and Si along with high exchangeable acidity, a pattern consistent with decades of continuous cultivation under high rainfall without adequate liming or Si amendments.
One striking observation is that recurrent volcanic ash deposition from Mount Talang does not translate into a sustained increase in soil pH across the watershed. Although volcanic ash often contains mineral phases that can release base cations, several mechanisms explain its limited effect. First, the chemical composition of ash varies, and in many cases, the material is dominated by silicate glass rather than readily soluble Ca-bearing minerals. Such phases release bases slowly and provide little neutralization capacity in the short term. Second, under the region’s intense rainfall regime, the small amounts of soluble bases released are rapidly leached beyond the rooting zone, particularly on sloping uplands where erosion further accelerates topsoil loss. Third, in highly weathered tropical soils rich in low-activity clays and Fe/Al oxides, released cations are quickly adsorbed or fixed, which diminishes their contribution to exchangeable base saturation. Finally, the acidifying pressure of continuous nitrogen fertilization—through nitrification and proton release—can offset or even surpass the neutralizing contribution of ash inputs. Similar outcomes have been reported from other volcanic regions of Indonesia, where ash deposition provides only transient pH improvements [3, 4].
The central role of aluminum chemistry further reinforces the persistence of acidity. When Al³⁺ is mobilized from clay minerals or oxides, it undergoes hydrolysis reactions that release protons, for example: Al³⁺ + H₂O ⇌ Al(OH)²⁺ + H⁺. Through successive hydrolysis steps, each mole of Al³⁺ can liberate multiple protons, thereby sustaining low pH conditions. At pH values below ~5.5, Al³⁺ is the dominant species, contributing not only to soil acidity but also to root toxicity. This explains the strong negative correlation observed between soil pH and exchangeable acidity in the Sumani watershed. In contrast, soils that retain higher levels of exchangeable base cations (Ca²⁺, Mg²⁺, K⁺, Na⁺) and available Si exhibit greater buffering capacity, which helps stabilize pH within the slightly acidic range.
Taken together, these findings highlight the complex interplay between geochemical weathering, land management, and ecological processes in regulating soil acidity. They also suggest that pH recovery in the watershed cannot rely on volcanic ash inputs alone. Instead, integrated management strategies are needed, including targeted liming to neutralize exchangeable Al, controlled use of nitrogen fertilizers, and supplementation with stabilized organic matter and Si-rich amendments. Such interventions, when combined with erosion control to conserve topsoil, are likely to provide more durable improvements in soil chemical resilience and crop productivity.
Moreover, the long-term use of nitrogen fertilizers, herbicides, and pesticides contributes to ongoing acidification [42]. Long-term applications of nitrogenous fertilizers contribute to soil acidification, with cumulative changes in soil solution chemistry accelerating pH decline over time [43]. Without soil amendments such as lime or silicon fertilizers, acidification will worsen, reducing soil fertility, increasing disease risks, and limiting crop productivity. In sum, the interplay between land use, erosion, nutrient dynamics, and volcanic activity shapes the current soil pH patterns in the SW. While natural factors like volcanic ash and rainfall play a role, human-induced factors, especially unsustainable farming and inadequate soil amendments, exert a stronger influence on pH and soil quality. Sustainable rice production in this region thus depends on strategic interventions: regular lime and silicon applications, improved conservation practices to reduce erosion, and land-use planning to curb soil degradation.
The moderately acidic to neutral soil pH observed in the southwestern (SW) region can be attributed to two key processes. First, volcanic ash from Mount Talang’s historical eruptions has altered soil characteristics in the highlands. Second, erosion in the uplands followed by deposition in the lowlands has led to pH differences across the landscape. In uplands, volcanic ash decomposes more rapidly due to the presence of hydrogen ions from organic acid release and minor volcanic activity. This process releases essential cations—Ca, Mg, K, Na, and Si—that react with Al, reducing its solubility and its contribution to soil acidity. This buffering mechanism helps maintain or increase soil pH [7, 27]. Higher concentrations of Ca, Mg, K, Na, and Si are positively linked to rising pH (H2O). On the other hand, extractable Fe does not significantly affect soil acidity in this region. This may be due to the long history of rice farming—many fields have been cultivated for more than 350 years. Over time, Fe becomes less soluble under such conditions, reducing its toxicity to rice. In contrast, newly established fields often face Fe toxicity due to high Fe solubility, which inhibits plant growth. Generally, Fe becomes more soluble at lower pH levels. Furthermore, low pH restricts the availability of key nutrients such as Ca, K, and Si. The Fe(III) solubility peaks between pH 4–5, while Fe(II) and Al are more soluble at pH below 3.5. This emphasizes how crucial pH is in determining nutrient dynamics and plant health. Long-term nitrogen fertilization acidifies soils and can reduce nutrient availability [43]. Total carbon (TC) is another important factor related to soil pH. A negative correlation between TC and pH was found, especially in intensively managed paddy fields. Long-term rice cultivation results in TC accumulation. A 30-year study in Java revealed that TC in paddy fields rose by 13.7% due to continuous cropping [3, 4]. These gains are supported by frequent harvests, nitrogen fertilizer use, and application of herbicides and pesticides. In many cases, straw is burned to prepare the land, which adds organic material. However, high-temperature burning combined with pesticide residues and limited lime use can reduce soil microbial populations. These combined effects have led to a national decline in soil pH, especially after the Green Revolution [4, 42].
In upland areas away from Mount Talang, erosion has been linked to lower soil pH. Areas with high erosion intensity, such as sites S2, S4, and S5, exhibit more acidic soil conditions. In contrast, lowland zones with lower erosion rates, like sites S1 to S5, tend to have neutral pH levels. Vegetables are often grown in the uplands, which experience intense erosion. This process removes the topsoil layer rich in nutrients and with a higher pH, thereby exposing more acidic subsoils. Conversely, paddy fields in the lowlands benefit from deposited sediments that are more fertile and have higher pH levels due to material accumulation from upland erosion [7]. Eroded soil particles are transported from upland farms to lowland paddy fields through surface runoff, leading to the buildup of fertile sediments. Local farmers observed that upland erosion contributes to the accumulation of soil in lowland fields. Geological analysis confirms that these deposits mainly consist of colluvial materials, particularly basaltic andesite derived from Mount Talang. Over time, this sedimentation has significantly influenced soil profile development and soil chemistry in the lowlands. The mineral content in these sediments helps regulate acidity and improve physical soil structure [27].
To manage soil acidity in paddy fields and achieve potential yields of 6–10 t/ha, the application of lime combined with balanced NPK fertilization is recommended. Based on Table 3 and Figures 3(a, b), lime requirements were calculated using the formula from studies [44, 45], which includes a texture factor of 3 for clay soils: CaCO₃ (ton/ha) = (Target pH – Current pH) × 3. For instance, with an initial pH H2O of 4.18, the lime requirement is: (6.1 – 4.18) × 3 = 5.76 tons CaCO₃/ha. If the initial pH is 7.3, no lime is needed, as the soil is already near-neutral. Hence, recommended lime application rates vary from 0 to 5.76 tons/ha, depending on current pH levels. A more detailed lime recommendation was developed based on the 3D spatial soil pH H2O map (Figure 3(b)), providing precise guidance for site-specific management: pH 3.0–3.5: 9.3–7.8 tons CaCO₃/ha: 300 – 350 kg Urea/ha: 100–125 kg SP-36/ha: 50–75 kg KCl/ha. pH 3.6–4.4: 7.5–5.1 tons CaCO₃/ha: 275–325 kg Urea/ha: 100 – 125 kg SP-36/ha: 50–75 kg KCl/ha. pH 4.5–5.0: 4.8–3.3 tons CaCO₃/ha: 250–300 kg Urea/ha: 75–100 kg SP-36/ha: 50–75 kg KCl/ha. pH 5.1–5.5: 3.0–1.8 tons CaCO₃/ha: 225–275 kg Urea/ha: 75–100 kg SP-36/ha: 50–75 kg KCl/ha. pH 5.6–6.0: 1.5–0.3 tons CaCO₃/ha: 200–250 kg Urea/ha: 50–75 kg SP-36/ha: 50–75 kg KCl/ha. pH 6.1–7.3: 0 tons CaCO₃/ha: 200–250 kg Urea/ha: 50–75 kg SP-36/ha: 50–75 kg KCl/ha.
This method promotes efficient lime use, targeting only areas with significant acidity, while avoiding over-application in near-neutral soils. To sustain soil pH improvements, combining lime application with silicon-based fertilizers is recommended. Yet, this strategy must also include effective erosion control in upland zones, where vegetable farming and agroforestry dominate (Figure 4). These areas are erosion hotspots, leading to lime leaching and reduced soil amendment effectiveness. The erosion map (Figure 3(a)) is a valuable reference for directing conservation efforts in high-risk zones. Previous studies advocate contour planting, agroforestry, and terracing to curb erosion and preserve soil quality [7]. Additionally, 3D integration of soil pH, erosion risk, irrigation water pH, and sediment acidity enhances land management planning. Such spatial tools support precision agriculture by offering location-specific strategies for improving soil fertility and environmental resilience. This research underscores the interconnected roles of volcanic parent material, erosion dynamics, land use, and human interventions in determining soil pH. Lime application, when guided by detailed spatial data and reinforced by erosion control, can substantially improve soil health and productivity in the SW watershed. Broadly, this integrated approach aligns with national goals for sustainable land use and climate adaptation at the watershed scale.
Soil pH (H2O 1:2.5) in the SW region is influenced by both natural factors and human activities, particularly within the 0–20 cm surface layer. Key factors include irrigation water, sediment movement, volcanic ash, fertilizers, pesticides, total carbon, and exchangeable acidity. Soil erosion significantly affects pH distribution: upland erosion removes topsoil rich in nutrients and results in acidic soils, while the eroded material settles in lowlands, raising pH in paddy sawah. Although river water pH remains neutral, the slightly acidic sediments deposited in the lowlands contribute to mildly acidic soil conditions. In upland soils, low pH correlates with high exchangeable acidity and total carbon. In contrast, higher levels of Ca, Mg, K, Na, and available Si are associated with higher pH values. Strongly acidic paddy soils often show low exchangeable K and available Si, combined with high exchangeable acidity, reducing rice yield and increasing disease risk. Soils near Lake Diatas, exposed to intensive vegetable farming and chemical inputs, exhibit the lowest pH. Conversely, soils near Mount Talang benefit from volcanic ash, which supports moderate pH and better rice productivity due to higher exchangeable Ca. Applying agricultural lime (CaCO₃) at 2.7 tons/ha: 225–275 kg Urea/ha: 75–100 kg SP-36/ha: 50–75 kg KCl/ha suggests a potential strategy, supported by abundant limestone resources in Indonesia, to improve soil pH and promote sustainable watershed management.
We extend our sincere gratitude to Professor Tsugiyuki Masunaga from Shimane University, Japan, for his invaluable assistance during the laboratory soil analysis and for his insightful suggestions. We also express our appreciation to Politeknik Pertanian Negeri Payakumbuh and KEMENDIKTISAINSTEK for their support in this research.
[1] Barrow, N.J., Hartemink, A.E. (2023). The effects of pH on nutrient availability depend on both soils and plants. Plant and Soil, 487: 21-37. https://doi.org/10.1007/s11104-023-05960-5
[2] Du, X., Hu, H., Wang, T., Zou, L., et al. (2023). Long-term rice cultivation increases contributions of plant and microbial-derived carbon to soil organic carbon in saline-sodic soils. Science of the Total Environment, 904: 166713. https://doi.org/10.1016/j.scitotenv.2023.166713
[3] Darmawan, Kyuma, K., Saleh, A., Subagjo, H., Masunaga, T., Wakatsuki, T. (2006). Effect of long-term intensive rice cultivation on the available silica content of sawah soils: Java Island, Indonesia. Soil Science and Plant Nutrition, 52(6): 745-753. https://doi.org/10.1111/j.1747-0765.2006.00089.x
[4] Darmawan, Kyuma, K., Saleh, A., Subagjo, H., Masunaga, T., Wakatsuki, T. (2006). Effect of green revolution technology during the period 1970–2003 on sawah soil properties in Java, Indonesia: II. Changes in the chemical properties of soils. Soil Science and Plant Nutrition, 52(6): 645-653. https://doi.org/10.1111/j.1747-0765.2006.00054.x
[5] Wischmeier, W.H., Smith, D.D. (1978). Predicting Rainfall Erosion Losses: A Guide to Conservation Planning. U.S. Department of Agriculture. https://www.ars.usda.gov/ARSUserFiles/60600505/RUSLE/AH_537%20Predicting%20Rainfall%20Soil%20Losses.pdf.
[6] Renard, K.G., Foster, G.R., Weesies, G.A., Porter, J.P. (1991). RUSLE: Revised universal soil loss equation. Journal of Soil and Water Conservation, 46(1): 30-33. https://www.tucson.ars.ag.gov/unit/publications/pdffiles/775.pdf?utm_source=chatgpt.com.
[7] Aflizar, Syafri, E., Jamaluddin, Husnain, Fudholi, A. (2021). Geochemical methods for mapping available-Si distribution in soils in West Sumatra, Indonesia. Geoderma, 384: 114833. https://doi.org/10.1016/j.geoderma.2020.114833
[8] Aflizar, R., Masunaga, T. (2013). Assessment erosion 3D hazard with USLE and Surfer Tool: A case study of Sumani Watershed in West Sumatra, Indonesia. Journal of Tropical Soils, 18(1): 81-92. https://doi.org/10.5400/jts.2013.v18i1.81-92
[9] Borrelli, P., Alewell, C., Alvarez, P., Anache, J.A.A., et al. (2021). Soil erosion modelling: A global review and statistical analysis of the recent literature. Science of the Total Environment, 797: 150963. https://doi.org/10.1016/j.scitotenv.2021.146494
[10] Mihai, R.A., Espinoza-Caiza, I.A., Melo-Heras, E.J., Cubi-Insuaste, N.S., Pinto-Valdiviezo, E.A., Catana, R.D. (2023). Does the mineral composition of volcanic ashes have a beneficial or detrimental impact on the soils and cultivated crops of Ecuador? Toxics, 11(10): 846. https://doi.org/10.3390/toxics11100846
[11] Derakhshan-Babaei, F., Nosrati, K., Tikhomirov, D., Christl, M., Sadough, H., Egli, M. (2020). Relating the spatial variability of chemical weathering and erosion to geological and topographical zones. Geomorphology, 363: 107235. https://doi.org/10.1016/j.geomorph.2020.107235
[12] Minasny, B., Fiantis, D., Hairiah, K., Van Noordwijk, M. (2021). Applying volcanic ash to croplands – The untapped natural solution. Soil Security, 3: 100006. https://doi.org/10.1016/j.soisec.2021.100006
[13] Husnain, Wakatsuki, T., Styorini, D., Hermansah, Sato, K., Masunaga, T. (2008). Silica availability in soils and river water in two watersheds on Java Island, Indonesia. Soil Science and Plant Nutrition, 54(6): 916-927. https://doi.org/10.1111/j.1747-0765.2008.00313.x
[14] Food and Agriculture Organization. (2016). The state of food and agriculture 2016: Climate change, agriculture and food security. FAO. https://openknowledge.fao.org/server/api/core/bitstreams/07bc7c6e-72e5-488d-b2f7-3c1499d098fb/content.
[15] Zhou, W., Li, C., Zhao, W., Stringer, L.C., Fu, B. (2024). Spatial distributions of soil nutrients affected by land use, topography and their interactions in the Loess Plateau of China. International Soil and Water Conservation Research, 12(1): 227-239. https://doi.org/10.1016/j.iswcr.2023.02.005
[16] Goovaerts, P. (2000). Geostatistics in soil science: State-of-the-art and perspectives. Geoderma, 89(1-2): 1-45. https://doi.org/10.1016/S0016-7061(99)00078-0
[17] Food and Agriculture Organization of the United Nations. (1976). A Framework for Land Evaluation (FAO Soils Bulletin No. 32). Rome: FAO. https://www.fao.org/4/x5310e/x5310e00.htm.
[18] Warsi, O.M., Dykhuizen, D.E. (2017). Evolutionary implications of Liebig’s law of the minimum: Selection under low concentrations of two nonsubstitutable nutrients. Ecology and Evolution, 7(14): 5296-5309. https://doi.org/10.1002/ece3.3096
[19] Soil Survey Staff. (1998). Keys to Soil Taxonomy (8th ed.). United States Department of Agriculture, Natural Resources Conservation Service. https://purl.access.gpo.gov/GPO/LPS59966.
[20] Sumida, H. (1992). Silicon supplying capacity of paddy soils and characteristics of silicon uptake by rice plants in cool regions in Japan. Tohoku Agricultural Experiment Station Report, 85: 1-46.
[21] Matichenkov, V.V., Calvert, D.V. (2002). Silicon as a beneficial element for sugarcane. Journal of the American Society of Sugarcane Technologists, 22: 21-30.
[22] Cahyono, P., Loekito, S., Wiharso, D., Afandi, Rahmat, A., Komariah, Nishimura, N., Senge, M. (2020). Patterns of nutrient availability and exchangeable aluminum affected by compost and dolomite in red acid soils in Lampung, Indonesia. GEOMATE Journal, 19(76): 173-179. https://doi.org/10.21660/2020.76.87631
[23] Brady, N.C., Weil, R.R. (2016). The Nature and Properties of Soils (15th ed.). Pearson.
[24] Ali, M.M., Saheed, S.M., Kubota, D., Masunaga, T., Wakatsuki, T. (1997). Soil degradation during the period 1967–1995 in Bangladesh. Soil Science and Plant Nutrition, 43(4): 879-890. https://doi.org/10.1080/00380768.1997.10414782
[25] Fujii, K., Panitkasate, T., Maskhao, I., Funakawa, S., Kosaki, T., Nawata, E. (2017). Acidification and buffering mechanisms of tropical sandy soil in northeast Thailand. Soil & Tillage Research, 165: 80-87. https://doi.org/10.1016/j.still.2016.07.008
[26] Yanai, J., Tanaka, S., Abe, S., Nakao, A. (2022). Changes in Paddy Soil Fertility in Tropical Asia under the Green Revolution: From the 1960s to the 2010s. Springer. https://doi.org/10.1007/978-981-16-5425-1
[27] Fiantis, D., Nelson, M., Shamshuddin, J., Goh, T.B., Van Ranst, E. (2010). Leaching experiments in tephra deposits from Talang volcano (West Sumatra), Indonesia. Geoderma, 156(3-4): 161-172. https://doi.org/10.1016/j.geoderma.2010.02.013
[28] Zhang, H.Q., Zhao, X.Q., Chen, Y.L., Wang, J.L., Shen, R.F. (2020). Improved root growth by liming aluminum-sensitive rice cultivar or cultivating an aluminum-tolerant one does not enhance fertilizer nitrogen recovery efficiency in an acid paddy soil. Plants, 9(6): 765. https://doi.org/10.3390/plants9060765
[29] Al-Badaii, F., Shuhaimi-Othman, M., Gasim, M.B. (2013). Water quality assessment of the Semenyih River, Selangor, Malaysia. Journal of Chemistry, 2013: 871056. https://doi.org/10.1155/2013/871056
[30] Onifade, O., Shamsuddin, N., Jin, J.L.Z., Lai, D.T.C., Gödeke, S.H. (2024). Assessment of pollution status in Brunei River using water quality indices, Brunei Darussalam. Water, 16(17): 2439. https://doi.org/10.3390/w16172439
[31] Gorme, J.B., Maniquiz, M.C., Song, P., Kim, L.-H. (2010). The water quality of the Pasig River in the City of Manila, Philippines: Current status, management and future recovery. Environmental Engineering Research, 15(3): 173-179. https://doi.org/10.4491/eer.2010.15.3.173
[32] Hoang, T.T.H., Nguyen, T.K., Le, T.P.Q., Dang, D.K., Duong, T.T. (2016). Assessment of the water quality downstream of Red River in 2015 (Vietnam). Journal of Vietnamese Environment, 8(3): 167-172. https://doi.org/10.13141/jve.vol8.no3.pp167-172
[33] Mekong River Commission. (2022). 2019 Lower Mekong water quality report. Vientiane: MRC. https://www.mrcmekong.org/wp-content/uploads/2024/08/2019-Lower-Mekong-Water-Quality-Monitoring-Report.pdf.
[34] Luo, P., He, B., Takara, K., Razafindrabe, B.H.N., Nover, D., Yamashiki, Y. (2011). Spatiotemporal trend analysis of recent river water quality conditions in Japan. Journal of Environmental Monitoring, 13(10): 2819-2829. https://doi.org/10.1039/c1em10339c
[35] Chang, H. (2008). Spatial analysis of water quality trends in the Han River basin, South Korea. Water Research, 42(13): 3285-3304. https://doi.org/10.1016/j.watres.2008.04.006
[36] Neina, D. (2019). The role of soil pH in plant nutrition and soil remediation. Applied and Environmental Soil Science, 2019: 5794869. https://doi.org/10.1155/2019/5794869
[37] Behera, M., Sena, D.R., Mandal, U., Kashyap, P.S., Dash, S.S. (2020). Land use and climate change impacts on global soil erosion by water (2015–2070). Environmental Monitoring and Assessment, 192(11): 733. https://doi.org/10.1007/s10661-020-08688-2
[38] Zhu, H., Li, H., Liang, C., Chang, X., Wei, X., Zhao, X. (2022). Spatial variation in soil physico-chemical properties along slope position in a small agricultural watershed scale. Agronomy, 12(10): 2457. https://doi.org/10.3390/agronomy12102457
[39] Ahmad, S., Hussain, I., Ghaffar, A., Rahman, M.H.U., Saleem, M.Z., Yonas, M.W., Hussnain, H., Ikram, R.M., Arslan, M. (2022). Organic amendments and conservation tillage improve cotton productivity and soil health indices under arid climate. Scientific Reports, 12(1): 14072. https://doi.org/10.1038/s41598-022-18157-0
[40] Somura, H., Darmawan, Sato, K., Ueno, M., Husnain, Aflizar, Masunaga, T. (2006). Characteristics and potential usage of dissolved silica in rice cultivation in Sumani Watershed, Sumatra, Indonesia. Pertanika Journal of Tropical Agricultural Science, 39(4): 601-615. https://www.researchgate.net/publication/311790102_Characteristics_and_potential_usage_of_dissolved_silica_in_rice_cultivation_in_Sumani_Watershed_Sumatra_Indonesia/citations.
[41] Sumner, M.E., Yamada, T. (2002). Farming with acidity. Communications in Soil Science and Plant Analysis, 33(15-18): 2467-2496. https://doi.org/10.1081/CSS-120014461
[42] Yan, P., Wu, L., Wang, D., Fu, J., Shen, C., Li, X., Zhang, L., Zhang, L., Fan, L., Han, W. (2020). Soil acidification in Chinese tea plantations. Science of the Total Environment, 715: 136963. https://doi.org/10.1016/j.scitotenv.2020.136963
[43] Yang, X.D., Ni, K., Shi, Y.Z., Yi, X.Y., Zhang, Q.F., Fang, L., Ma, L.F., Ruan, J. (2018). Effects of long-term nitrogen application on soil acidification and solution chemistry of a tea plantation in China. Agriculture, Ecosystems & Environment, 252: 74-82. https://doi.org/10.1016/j.agee.2017.10.004
[44] Merlos, F.A., Silva, J.V., Baudron, F., Hijmans, R.J. (2023). Estimating lime requirements for tropical soils: Model comparison and development. Geoderma, 432: 116421. https://doi.org/10.1016/j.geoderma.2023.116421
[45] Lime for acid soils. Government of South Australia, Department for Environment and Water. https://cdn.environment.sa.gov.au/landscape/docs/ny/sustainable-agriculture-liming-acid-soils-fact.pdf.