Agus Hartoko*![]() | Jahved Ferianto Maro
| Jahved Ferianto Maro![]() | Muhammad Helmi
| Muhammad Helmi![]() | Hanan Az Zahra Syafina
| Hanan Az Zahra Syafina![]() | Asqita Rahma Ashari
| Asqita Rahma Ashari![]() | Dafit Ariyanto
| Dafit Ariyanto![]()
© 2025 The authors. This article is published by IIETA and is licensed under the CC BY 4.0 license (http://creativecommons.org/licenses/by/4.0/).
OPEN ACCESS
The cold seawater phenomena happening yearly during May-October at Pantar Strait, located at the Savu Sea Marine Protected Area for Cetacean, East Nusa Tenggara, Indonesia. The limitation of the current SST data is low satellite resolution is not suitable to detect changes of SST in a small area. The aims of the study are to integrate multi-source satellite data of Aqua-MODIS, Sentinel-3, CMEMS sub-surface, and field temperature in the period 2018 – 2020, using a curvilinear interpolation Kriging method. The novelties are the integration of in situ sea surface temperature (SST) and Aqua-MODIS integration produces 425 m spatial resolution from its original 4,000 m with RMSE of 0.27, R2 of 0.89. Integration of in-situ SST and Sentinel-3 data produces 11 m spatial resolution from its original of 1,000 m, with RMSE of 0.11 and R2 of 0.91. In-situ SST measurement in June 2020 during cold-seawater phenomena on 20 June 2020 is 7-12℃. Integration of the Aqua-MODIS and in situ SST in June 2020 possible to detect cold seawater in the range of 8-24.0℃. Integration of Sentinel-3 and field SST in June 2020 can detect in the range 12-16℃. Specific and detailed result seawater pattern of CMEMS sub-surface temperature at depth of 200 m is 9.8-10.6℃, with RMSE of 0.16 and R2 of 0.85. This new method effectively enhanced the spatial resolution, enabling the detection of small-scale upwelling events, and is applicable as a spatial analysis tool to detect the cold seawater natural marine phenomena. This phenomenon had caused the death of six species of fish by a sudden extreme seawater temperature drop, but attracted the dolphin schools of Tursiops truncatus, Lagenodelphis hosei, and Stenella longirostris.
integration, Aqua-MODIS, Sentinel-3, field SST, sub-surface temperature, cold seawater
Pantar Strait is located between Alor and Pantar Strait, and part of the Savu Sea Marine Protected Area for cetaceans, with the Ministry Regulation No. 6/Kepmen-KP/2014 for Zonation and Management Plan of Savu Marine Protected Area by the Ministry of Marine and Fisheries, Republic of Indonesia, and belongs to the East Nusa Tenggara province [1]. The triangle of the Savu Marine Protected Area is a seawater area surrounded by Flores, Lembata, and Alor in the north, and Timor and Sumba Islands in the south of East Nusa Tenggara. The Savu Sea had been declared a conservation area for cetacean whales, dolphins, and dugongs. This area is also known as the Indonesian trans-oceanic flow through, with the seawater front and mixing of two seawater currents from the Pacific and the Indian Ocean [2]. Earlier studies in Alor Island and Pantar Strait had discovered specific seasonal and regional low seawater temperatures coming from the Indian Ocean [3]. The effect of global warming in the Arctic region will cool down the temperature of the ocean and increase the salinity of the Arctic Ocean. It might take thousands of years for the cooling effects of the oceans to cool the average atmospheric temperature globally [4]. The evidence from Galapagos indicated that the most recent 50 years had the warmest sea-surface temperature (SST) of any 50 years in the past 1200 years for the eastern equatorial Pacific Ocean [4]. The normal range of seawater temperature for cetaceans is in the range of 5.5-10.6℃, where the thermal impacts on smaller dolphin groups of adolescents, neonates, and accompanying females work together with other factors such as prey distribution, predator avoidance, and social interactions to influence coastal residency patterns [5-7]. Recent advances in high-resolution digital twin platforms or artificial intelligence marine forecasting, such as Earth-2 (with kilometer-scale resolution), have led to an increased demand for high-resolution oceanic data, and possible to reveal meso- or small-scale dynamic ocean processes [8]. Another recent application for high-resolution SST data in a small area is using UAV-Drone mapping with a thermal infrared sensor, but this method is much more expensive [9].
The existence of the cold-seawater phenomenon, mass fish death, and appearance of dolphins in the Pantar Strait has been known by the local community for a long time, but no scientific analysis has been made to prove it so far.
The current main problem is that the existing low-resolution SST satellite data of Aqua-MODIS has with 4,000m spatial resolution, and Sentinel-3 has with 1,000m spatial resolution. These low-resolution data will have inherent weakness in detecting SST in a small area, which has a specific oceanographic phenomenon, such as cold seawater phenomena at Pantar Strait, Alor. To increase higher spatial accuracy of the SST in the small area of the Pantar Strait, needs to be developed new method integrate the low-resolution data of Aqua-MODIS and Sentinel-3 SST data with the field SST measurement data.
The first goal of this research is the integration of the low-resolution 4,000 m Aqua-MODIS Sea surface temperature (SST) with the field SST to cover the regional Savu Sea. Integration of Sentinel-3 SST with the field SST, and verification of the cold seawater mass using sub-surface temperature of CMEMS Copernicus data to detect the area and the cold seawater temperature phenomenon in the Pantar Strait, Alor. The second goal is the field survey to record dolphin appearance, seasonal dolphin migration tracks, and mass coral reef fish dead as the impact of the cold seawater phenomenon.
2.1 Study area
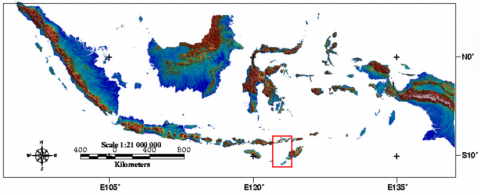
The study area encompasses the Savu Sea and Pantar Strait, spanning from 8°0'13.58"S, 122°24'8.23"E to 11°7'47.5"S, 123°50'42.35"E (Figure 1).
Figure 1. Area of study
2.2 In-situ or field SST measurement
Pantar Strait is characterized by two high tide cycles, the first high tide at 03:00 to 04:00 am and the second at 15.00 to 16.00 pm of East Indonesia Time. The high tide seawater mass had induced the upwelling process and induced a sub-surface cold seawater mass from a depth of 200m to the sea surface. SST during the actual cold seawater event was measured on 20 June 2020 from 15:00 to 16:00 pm in the second high-tide period. The cold seawater phenomena at the Pantar Strait happen yearly during May-September. A total number 60 coordinates of the field SST were measured using a HORIBA Digital Thermometer with an accuracy of 0.01℃. Sixty field sea surface temperature (SST) measurement coordinates were spread evenly to represent the study area at Pantar Strait, Alor, each with a spatial distance of 2.5 km among coordinates.
2.3 Mass death fish sampling
Mass death fish samples, which floated on the sea surface water, were collected using a scoop-net with a diameter of 45cm and a mesh size of 1cm. Fish species were morphologically identified using the Fish-Base database [10] and Fish identification using the FAO Species Identification Guide for Fishery Purposes [11].
2.4 Satellite data
2.4.1 Aqua-MODIS Level-3, monthly, year 2018, 2019, and 2020
Aqua MODIS Level 3 SST daytime monthly image data with a spatial resolution of 4,000m were downloaded from database [12]. The monthly average of Aqua MODIS three-year data of 2018, 2019, and 2020.
2.4.2 Sentinel-3
The second data used is Sentinel-3 Sea-Land Surface Temperature Radiance (SLSTR) level-2 SST image data was derived from database [13]. This data has a spatial resolution or pixel size of 1,000 m with solar reflectance bands in bands S1-S6.
2.4.3 Copernicus CMEMS sub-surface temperature
The third data used as the supporting data is the multi-depth sub-surface temperature from the Copernicus Marine Environment Monitoring Service (CMEMS) data from depths of 200 m and 50 m [14].
2.4.4 Field dolphin track survey
Field survey on dolphin appearances and tracks using a wooden boat LOA 12 m, B: 3 m, three personnel for 30 days. Dolphin appearance and coordinates were photographed and video documented using a GoPro waterproof digital camera and a Garmin GPS.
The original image grid data type of Aqua MODIS, Sentinel-3, and CMEMS was converted to generate point coordinate numeric SST data in ArcMap 10.3. Step 1 is the integration of the 173-point coordinate SST of Aqua-MODIS to the 60-point coordinate field SST. Step 2 is the integration of 317-point coordinate SST data of Sentinel-3 to the 60 field SST data. Step 3 is the spatial processing of sub-surface temperature CMEMS in depth 50 m and 200 m using 100 point-coordinate sub-surface temperature data. All spatial data were processed using ArcMap 10.3, SeaDAS 7.3, and ERMapper software. The converted numeric or ASCII data of Aqua-MODIS, Sentinel-3, CMEMS, and the field SST were spatially interpolated using the minimum curvature gridding method, with the geodetic datum being WGS84, and the map projection is geodetic [2, 3]. The general planar model using least squares regression [15]:
$a X+b Y+c=Z(X, Y)$ (1)
where,
X: longitude
Y: latitude
Z: sea surface temperature
Field survey of the dolphin tracks was done during the west season of November-April and the east season of May-October year 2018, 2019, and 2020 using Garmin-GPS and the General Bathymetric Chart of the Oceans (GEBCO) derived from report [16]. All satellite data acquisition and processing were carried out at the Laboratory of the Marine Geomatic Centre, Diponegoro University, Semarang, Indonesia.
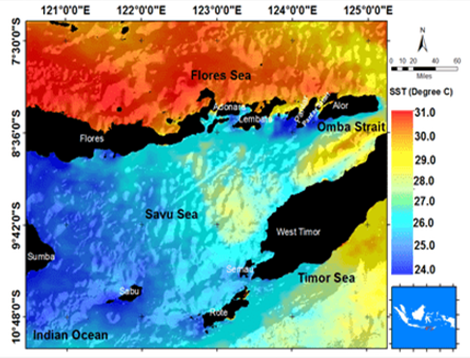
3.1 Integration of Aqua-MODIS and field SST
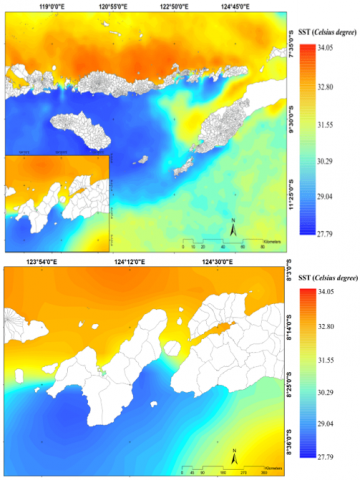
The first satellite integration is the Aqua-MODIS to the field SST in the period of May and July 2018 was found in the range of 24.0-29.0℃ in the Savu Sea (Figures 2, 3). In May and August 2019, the SST range was 27.79-30℃ (Figure 4(A, B)), and during May and August 2020, the SST range was 27.79-30℃ (Figure 5(A, B)). The integration of Aqua-MODIS and in situ during the cold seawater phenomena, the SST in June 2020, makes it possible to detect a very low seawater temperature range of 8-13℃ (Figure 6). The result of the integration of Aqua-MODIS and field SST measurement gave a 425 m spatial resolution from the original spatial resolution of 4,000 m (RMSE: 0.27, R2: 0.89), covering a wider region of the Pantar Strait and the Savu Sea. This data integration had effectively increased the spatial resolution in detecting SST in a small area of the cold seawater phenomenon.
Figure 2. Integration of Aqua-MODIS and field SST of May 2018 at Savu Sea and Pantar Strait
Figure 3. Integration of Aqua-MODIS and field SST of July 2018 at Savu Sea and Pantar Strait
Figure 4. Integration of Aqua-MODIS and field SST of (A) May 2019 and (B) August 2019 at Savu Sea and Pantar Strait
(A)
(B)
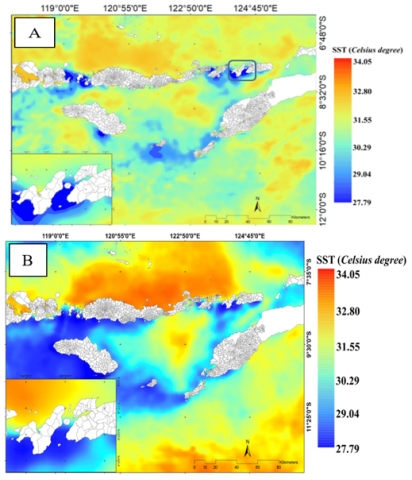
Figure 5. (A) Integration of Aqua-MODIS and field SST in May 2020 at Savu Sea and Pantar Strait; (B) Integration of Aqua-MODIS and field SST in August 2020 at Savu Sea and Pantar Strait
Figure 6. Integration of Aqua-MODIS and evenly spread of the field SST of June 2020 during cold seawater phenomena at the Pantar Strait
3.2 Integration of Sentinel-3 and field SST
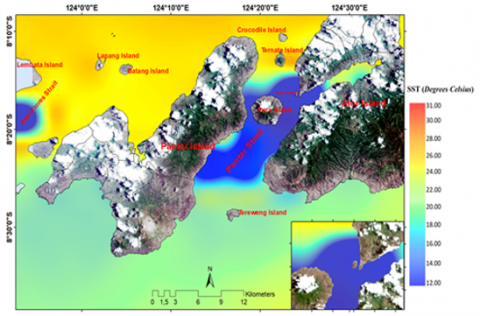
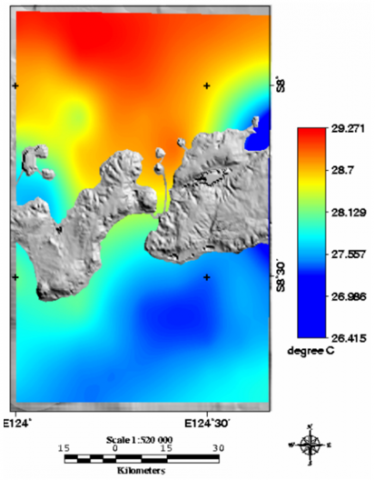
The second data integration of Sentinel-3 and field SST data in June 2020 increased the spatial resolution of Sentinel-3 from its original resolution of 1,000m to 11m spatial resolution (RMSE: 0.11, R2: 0.89). The result of this data integration can detect the cold seawater temperature phenomenon in the range of 12-14℃ (Figure 7) in the Pantar Strait. It is considered that May to August is the peak of the east season, and is detected as the period of the cold-seawater phenomenon. During the west monsoon (November – April), the SST range is 29-31℃.
Figure 7. Integration of Sentinel-3 and field SST June 2020 during cold seawater phenomena at Pantar Strait
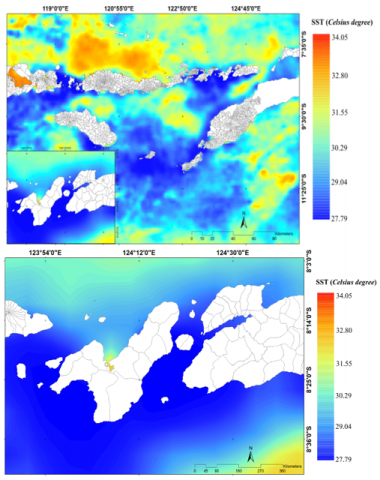
3.3 Analysis of Copernicus CMEMS sub-surface temperature
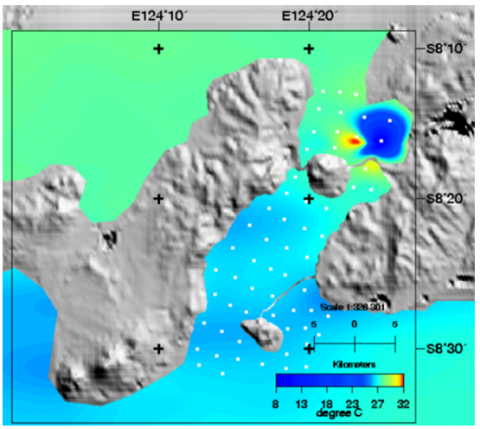
The third step analysis using sub-surface temperature of CMEMS data found the sub-surface temperature at the depth of 50 m (RMSE: 0.16, R2: 0.85), as shown in Figures 8 and 9 in the range of 9-10℃ in June 2020 during the cold seawater phenomena at the depth of 200 m (Figure 10).
Figure 8. Sub-surface temperature at a depth of 50 m, CMEMS data during the cold seawater phenomena on 20 June 2020 at Pantar Strait
Figure 9. Three-dimensional CMEMS Subsurface temperature at a depth of 50 m during the cold seawater phenomena on 20 June 2020 at Pantar Strait
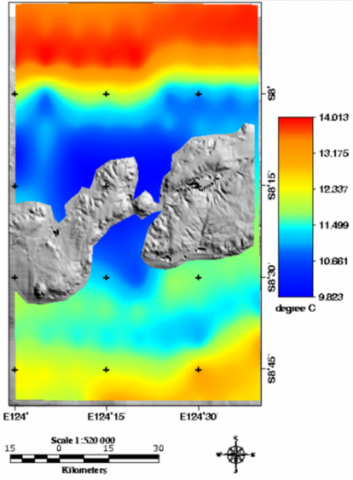
Figure 10. Subsurface temperature at a depth of 200 m, CMEMS data during the cold seawater phenomena on 20 June 2020 at Pantar Strait
Integration of Aqua-MODIS and field SST during the event of field cold seawater in June 2020 makes it possible to detect cold seawater in the range of 8-26℃ in Figure 6.
Meanwhile, integration of Sentinel-3 and in-situ SST has possible to detect a distinctive plume of cold seawater in the range 12-18℃ at Pantar Strait, as shown in Figure 7.
Then, ultimately followed with the verification of actual sub-surface temperature in June 2020 during the actual cold-seawater event, using data of CMEMS, had exhibit the sub-surface temperature range of 9-10℃ in the depth of 50 m as in Figure 8 and sub-surface temperature in the depth of 200 m is in the range of 26.4-26.9℃ and the three-dimensional image in Figure 9. CMEMS sub-surface temperature at a depth of 200 m during the high-tide and upwelling process clearly shows the cold seawater from the Savu Sea moving northward, entering the Pantar Strait (Figure 10), and finally becoming a cold seawater plume at all Pantar Strait with a temperature range of 9-10℃ (Figure 8).
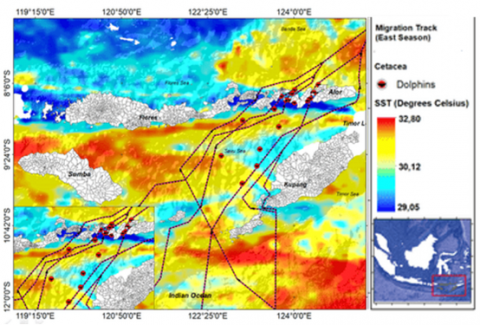
The field GPS dolphin track survey in 2018 and 2019 was done by the National Conservation Bureau of Savu Sea. While tracking data in 2020 was done by the research team. The spatial dolphin tracks were developed based on the field survey coordinates series, according to the dolphin appearance coordinates, and then plotted over the SST and over the bathymetry data in the period of the east and west seasons of 2018, 2019, and 2020. The dolphin tracks of both during the west season (Figure 11) and the east season (Figure 12) were overlaid on the integration of yearly Aqua-MODIS and in-situ SST data 2018-2020.
Figure 11. Track of dolphin at Pantar Strait and the Savu Sea during the west monsoon 2018-2020 and integrated Aqua-MODIS and in-situ SST data
Figure 12. Track of dolphin at Pantar Strait and the Savu Sea during the east monsoon 2018-2020 over the integrated Aqua-MODIS and in-situ SST data
This spatial database of dolphin tracks during the west season overlaid on the November-April 2018-2020 monthly average SST indicates the seawater flows from the north, that is, from the Banda Sea to the south, entering the Pantar Strait with seawater temperature of 29.11-32℃ (Figure 11). The track indicates of north-to-south track pattern.
Meanwhile, the dolphin track during the east season overlaid on SST May-October 2018-2020 in the seawater temperature range of 29.05-32.80℃. The pattern of dolphin tracks flows from the south, that is, the Indian Ocean, to the north into the Savu Sea and enters to Pantar Strait with seawater temperature of 29.05℃ (Figure 12).
The seasonal SST and seawater mass pattern had indicated as the main governing factor of north-south and south-north from warm to cold seawater temperature of the dolphin migration pattern.
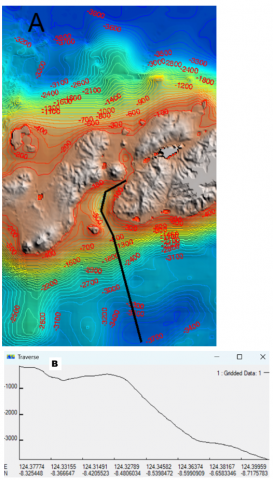
This new multi-data integration method of SST Aqua-MODIS, Sentinel-3, and sub-surface temperature CMEMS data, and validated with the in-situ SST, has increased spatial accuracy from its original spatial resolution of 4 km to 425 m. The study revealed that all integrated SST analyses during 2018-2020 were consistently capable of detecting cold SST at the Pantar Strait, as shown in Figures 2-5. During the east monsoon of 2018-2020, there was low SST at the Pantar Strait during the cold seawater event. Overlay of the dolphin tracks during the west season tends to be concentrated at the Pantar Strait. Dolphin tracks during the east season showed the migration pattern from the Savu Sea to the north, entering the Pantar Strait. The result of the combination of the temperature data and the bathymetry data indicated that the cold seawater phenomenon is caused by the upwelling process. The cold seawater from the depth of 3,750 m rises gradually to the depths of 1,000 m, 200 m, and 50 m according to the bottom contour of the sea as indicated by the cross-section line of the bathymetry data at Pantar Strait in Figure 13, and finally reaches the sea surface at Pantar Strait. This case was also supported by the earlier study [17].
Figure 13. (A) Bathymetry; (B) Slope transverse line from the Savu Sea into the Pantar Strait causes the upwelling
The cold-seawater mass is specifically caused by the upwelling process during the full-moon high tide, seawater mass flows from the Indian Ocean into the Savu Sea. The chronology of the cold SST was analyzed systematically using Aqua-MODIS SST during May-August 2018, 2019, 2020, using Sentinel-3, and verified using CMEMS sub-surface temperature at depths of 200 m and 50 m (Figures 8-10), indicating a cold seawater temperature range of 9.8- 10.6℃ and validated by the field SST measurement at 20 June 2020.
The high-tide and upwelling process happened in a one-hour period from 15.00 to 16.00 local time. The actual mass coral-reef fish dead in the Pantar Strait caused by a sudden SST drop from 26℃ to 12℃ happened in a 20-minute period during and was validated by the field SST measurement during the cold seawater mass on June 20, 2020. This data is also confirmed by the deployment of a seawater temperature logger (SWTL) in the studies [17-20]. The cold-seawater phenomena usually happen during the spring-tide full moon of May, August, and October. The process started with low tide water levels up to 3 m and seaward direction up to 8m from the coastline. These cold-seawater phenomena and mass fish death have been happening for a long time, and are very well known by the local community and fishermen. When they are aware that this event will happen, during the full moon low-tide, they will be ready to wait at the coast with a fish net-scoop to catch the fresh dead fish along Pantar Coast.
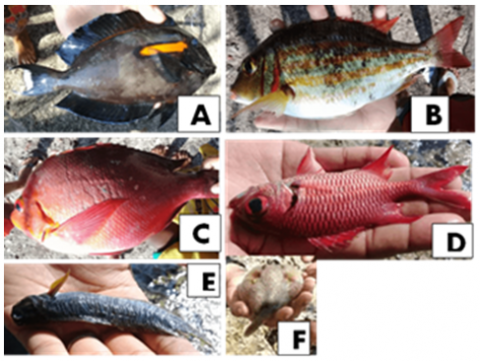
Six species of mass death fish samples after the cold-seawater phenomenon have been found in the Pantar Strait are Acanthurus olivaceus, Lutjanus kasmira, Lutjanus gibbus, Myripristis bemdti, Ecsenius oculus, and Tylerius spinosissimus, as shown in Figure 14, which mostly belong to the group of coral-reef fishes [21, 22]. They usually live in coastal coral-reef ecosystems up to a depth of 10 m, with a normal seawater temperature of 27-30℃ in the Pantar Strait. Such as Ecsenius oculus, known as a detritus feeder, and the other five species of Acanthurus olivaceus, Lutjanus kasmira, Lutjanus gibbus, Myripristis bemdti, and Tylerius spinosissimus are known as the small prey feeders. Most of the fish and coral reefs experienced mass death in the Pantar Strait, which was characterized by a narrow reef-flat of 2-10 m depth, 100 m wide, which the fish used to prefer to be in the seawater range of 27-30℃, followed by the reef-slope to the depth of 500-750 m. Changes in the oceanographic parameters will influence the life traits of marine organisms in different ways, such as feeding behavior. The definition of mass fish kill is also known as fish die-off, refers to a localized die-off of fish populations, which may also be associated with a mass fish death or mortality of aquatic life. Infectious diseases and parasites can also lead to fish kills. Toxicity is another real but less common cause of a mass fish kill. Fish kills are often the first visible signs of environmental stress and are usually investigated as a matter of urgency by environmental agencies to determine the cause of the mortality. Some fish, especially coral reef species, have a relatively low tolerance of variations in environmental conditions such as sudden low seawater temperature, current, and their death is often a potent indicator of problems in their environment [23, 24]. Factors causing sudden mass fish deaths such as low dissolved oxygen, extreme high or low temperature, drought or dry conditions, algal bloom, acidic runoff, pesticide or chemical pollution, waste dumping, or disease outbreak. The phenomenon of excessive salinity, where aquatic organisms are exposed to sudden salinity introduced into freshwater zones because of tide or weather changes [25, 26]. Coral reef fishes are regarded as coral reef symbionts with a high degree of association in the coral reef ecosystems with very narrow seawater variations. Most of the coral-reef fishes are known as seawater temperature conformers or poikilotherms, which cannot regulate their body temperature to the variations of their surrounding seawater temperature [21, 22]. It is regarded that mass fish death in this case is more as the effect of a sudden seawater drop, related to the physiological dysfunctions of its internal organs [21, 22].
Figure 14. Species of mass death fish after the cold-seawater phenomenon 20 June 2020 at Pantar Strait: A-Acanthurus olivaceus, B-Lutjanus kasmira, C-Lutjanus gibbus, D-Myripristis bemdti, E-Ecsenius oculus, F-Tylerius spinosissimus
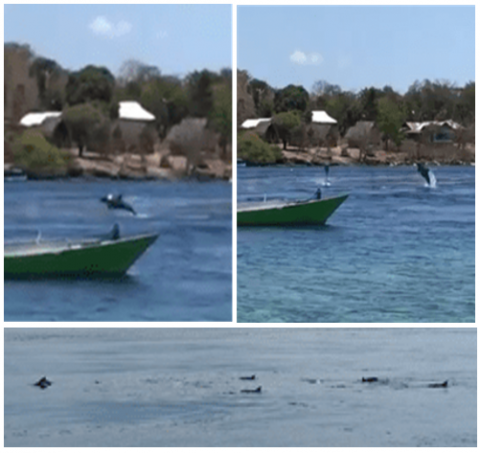
As a contra effect of cold-seawater phenomena found in this study is the attraction and appearance of three species, including Bottlenose dolphin Tursiops truncatus, Frazer’s dolphin Lagenodelphis hosei, and Spinner dolphin Stenella longirostris (Figure 15). It is assumed that the cold seawater of 12-14℃ is a favorable seawater condition at Pantar Strait for the schooling of dolphins.
Dolphins mostly like to be in the seawater temperature range of 5.5–10.6℃ [9, 20]. This cold-water phenomenon also attracted the appearance and sightings of the humpback whale (Megaptera novaeangliae), Feresa sp., Kogia sp., and Mesoplodon sp. in the area [4]. As a comparison, the sea surface temperature (SST) ranges from 13.5- 22.5℃ in winter (June–November) as in the Bay of Islands, New Zealand [26, 27]. The bottlenose dolphins prefer to be in the sea surface water temperatures at 10-32℃ or 50-90°F [27]. Another opposite phenomenon of the unprecedented marine heatwave had long-lasting negative impacts on both survival and birth rates on the iconic dolphin population in Shark Bay, Western Australia [28]. Another potential impact of cold or heat seawater phenomena could be caused by global warming on marine mammals. These can be direct or indirect, such as the effects of species tracking in a specific range of seawater temperatures in which they can physically survive. Indirect effects of climate change include changes in prey availability affecting distribution, abundance, and migration patterns, community structure, susceptibility to disease, and contaminants. Ultimately, it will impact the reproductive process and survival of marine mammals and have consequences for populations [29]. Another comparison, the white-beaked dolphin (Lagenorhynchus albirostris) and short-beaked common dolphin (Delphinus delphis) are two origin species of the most abundant delphinid in the cold-water shelf around the United Kingdom and the Republic of Ireland in the summer season (May–October). White-beaked dolphins were most likely to appear at the SST below 13℃. In contrast, much fewer dolphins appeared in SST above 14℃, which is important in determining the relative distribution of these species [30-35].
Figure 15. Schools and appearance of dolphins during the cold-seawater phenomenon at Pantar Strait on June 20, 2020
The data fusion of Aqua-MODIS and field SST measurement data had effectively increased the spatial resolution from 4,000 m to 425 m, meaning an increase from 1 pixel/grid to 10 pixels/grid and thus increased SST accuracy in the range of 8-13℃. Data fusion of Sentinel-3 and field SST had increased spatial resolution from 1,000 m to 11 m, an increase from 1 pixel/grid to 10 pixels/grid spatial SST accuracy in the range of 12-14℃ during the phenomena in June 2020 at Pantar Strait. Analysis of CMEMS sub-surface temperature at depths of 200 m and 50 m found a temperature range of 9-10℃.
The mass fish death was caused by a sudden seawater temperature drop from the normal seawater temperature of 30℃ to 12℃ in just 30-minute period. Six species of coral-reef fishes had been found dead, and the contrary had attracted the school of two dolphin species.
Based on the result of this study should be potential application prospects such as the detection of hot-water plume from the power plant outfall, bloom of toxic plankton in a small area of semi-enclosed estuarine with a combination of SST and chlorophyll data. Multi-data combination to detect possible environmental impact of oil-spill radar data with SST, chlorophyll a, and plankton.
Future research on the use of low-resolution Aqua-MODIS and Sentinel-3 with field SST measurement by regular general vessels will generate a wide-open opportunity for future research, both for small or wide oceanic areas, but will have higher spatial resolution and more detailed spatial SST variation and anomaly. A combination of SST, chlorophyll-a sea surface height (SSH) altimetry data, for sea surface current analysis.
The authors are grateful to the Government of East Nusa Tenggara, particularly the Marine and Fisheries Office, Tourism and Creative Economy Office, and the Savu Sea Marine Protected Area Authority for the permission to conduct this research. The authors are also thankful to the Institute of Research and Community Services, Diponegoro University, for Grant support No. 222-267/UN7.D2/PP/IV/2025 and the World Wildlife Fund for Nature research (WWF) at Solor-Alor for the field facilities support.
[1] National Conservation Bureau. Savu Marine Protected Area. (2018). Kupang Conservation Agency. Kupang. https://sites.google.com/view/tnplautsawu/home?authuser=1.
[2] Hartoko, A., Febrianto, A., Pamungkas, A., Fachruddin, I., Helmi, M., Hariyadi. (2019). The myth and legend of Sadai and Gaspar Strait Bangka Belitung (Banca-Billiton) and oceanographic conditions. International Journal of GEOMATE, 17(62): 212-218. https://doi.org/10.21660/2019.62.93965
[3] Maro, J.F., Hartoko, A., Anggoro, S., Muskananfola, M.R., Hasan, V. (2121). Analysis of oceanographic variables on the appearance of cetaceans in the Pantar Strait – Alor, Indonesia. Ecology, Environment and Conservation, 27(4): 1452-1457. https://www.envirobiotechjournals.com/EEC/v27i42021/EEC-2.pdf.
[4] Hunt, J.D., Nascimento, A., Diuana, F.A., de Assis Brasil Weber, N., Castro, G.M., Chaves, A.C., Mesquita, A.L.A., Colling, A.V., Schneider, P.S. (2020). Cooling down the world oceans and the earth by enhancing the North Atlantic Ocean current. SN Applied Sciences, 2(1): 15. https://doi.org/10.1007/s42452-019-1755-y
[5] Ward, E., Zerbini, A.N., Kinas, P.G., Engel, M.H., Andriolo, A. (2011). Estimates of population growth rates of humpback whales (Megaptera novaeangliae) in the wintering grounds off the coast of Brazil (Breeding Stock A). Journal of Cetacean Research and Management, 3: 145-149. https://doi.10.47536/jcrm.vi3.323
[6] Noad, M.J., Dunlop, R.A., Paton, D., Cato, D.H. (2011). Absolute and relative abundance estimates of Australian east coast humpback whales (Megaptera novaeangliae). Journal of Cetacean Research and Management, 3: 243-252. https://doi.org/10.47536/jcrm.vi.318
[7] Laura, Y.C., Houser, D.S. (2008). Thermal tolerance in Bottlenose Dolphins (Tursiops truncatus). Journal of Experimental Biology, 211(20): 3249-3257. https://doi.org/10.1242/jeb.020610
[8] Wang, S., Li, X., Zhu, X., Li, J., Guo, S. (2024). Spatial downscaling of sea surface temperature using diffusion model. Remote Sensing, 16(20): 3843. https://doi.org/10.3390/rs16203843
[9] Wirasatriya, A., Iryanthony, S.B., Susanto, R.D., Agustiadi, T., et al. (2025). Spatial distribution of extreme upwelling event in the seas of Alor Kecil, Indonesia, revealed by UAV’s thermal infrared sensor. Regional Studies in Marine Science, 90: 104451. https://doi.org/10.1016/j.rsma.2025.104451
[10] FishBase. (2024). https://www.fishbase.se/search.
[11] FAO. (1999). FAO species identification guide for fishery purposes: The living marine resources of the Western Central Pacific. In Bony Fishes Part 2 (Mugilidae to Carangidae). https://www.fao.org/4/x2400e/x2400e00.htm.
[12] NASA Earth Observation. (2021). Sea surface Temperature. Aqua-MODIS. https://neo.gsfc.nasa.gov/view.php?datasetId=MYD28M.
[13] Copernicus Data Space Ecosystem. (2024). Sea Surface temperature. https://dataspace.copernicus.eu/explore-data/data-collections/sentinel-data/sentinel-3.
[14] Copernicus Marine Service. (2020). Global ocean physics analysis and forecast https://marine.copernicus.eu/.
[15] Smith, W.H.F., Wessel, P. (1990). Gridding with continuous curvature spline in tension. Geophysics, 55(3): 266-379. https://doi.org/10.1190/1.1442837
[16] GEBCO. (2020). General bathymetric chart of the oceans. https://www.gebco.net.
[17] Maro, J.F., Hartoko, A., Anggoro, S., Muskananfola, M.R., Timung, A.P. (2021). Dolphin appearance in the Alor - Pantar strait with a variable oceanographic approach. Ecology, Environment and Conservation, 27: S127-S131.
[18] Wirasatriya, A., Susanto, R.D., Setiawan, J.D., Agustiadi, T., et al. (2023). Extreme upwelling events in the seas of the Alor Kecil, Alor Island, Indonesia. Oceanography, 36(1): 28-37. https://doi.org/10.5670/oceanog.2023.107
[19] Wirasatriya, A., Setiawan, J.D., Sugianto, D.N., Rosyadi, I.A., Haryadi, H., Winarso, G., Setiawan, R.Y., Susanto, R.D. (2020). Ekman dynamics variability along the southern coast of Java revealed by satellite data. International Journal of Remote Sensing, 41(21): 8475-8496. https://doi.org/10.1080/01431161.2020.1797215
[20] Smit, A.J., Roberts, M., Anderson, R.J., Dufois, F., Dudley, S.F., Bornman, T.G., Olbers, J., Bolton, J.J. (2013). A coastal seawater temperature dataset for biogeographical studies: Large biases between in situ and remotely-sensed data sets around the coast of South Africa. PLoS One, 8(12): e81944. https://doi.org/10.1371/journal.pone.0081944
[21] Allen, G.R., Adrim, M. (2003). Coral reef fishes of Indonesia. Zoological Studies, 42(1): 1-72.
[22] Anderson, O.R.C. (2000). An Underwater Guide to Indonesia. University of Hawaii Press.
[23] Pankhurst, N.W., Munday, P.L. (2011). Effects of climate change on fish reproduction and early life history stages. Marine and Freshwater Research, 62(9): 1015-1026.
[24] Haryanto, Y.D., Riama, N.F., Agdialta, R., Hartoko, A. (2021). Sea Surface Temperature (SST) analysis during ElNiño-LaNiña in the Java Sea. IOP Conference Series: Earth and Environmental Science, 716(1): 012006. https://doi.org/10.1088/1755-1315/716/1/012006
[25] Dréo, R., Bouffaut, L., Leroy, E., Barruol, G., Samaran, F. (2019). Baleen whale distribution and seasonal occurrence revealed by an ocean bottom seismometer network in the Western Indian Ocean. Deep Sea Research Part II: Topical Studies in Oceanography, 161: 132-144. https://doi.org/10.1016/j.dsr2.2018.04.005
[26] Forcada, J., Aguilar, A., Hammond, P., Pastor, X., Aguilar, R. (1996). Distribution and abundance of fin whales (Balaenoptera physalus) in the western Mediterranean Sea during the summer. Journal of Zoology, 238(1): 23-34. https://doi.org/10.1111/j.1469-7998.1996.tb05377.x
[27] Ballance, L.T., Pitman, R.L., Fiedler, P.C. (2006). Oceanographic influences on seabirds and cetaceans of the eastern tropical Pacific: A review. Progress in Oceanography, 69(2-4): 360-390. https://doi.org/10.1016/j.pocean.2006.03.013
[28] Muray-Darling Authority. (2020). Fish Kill Monitoring. Government of Australia. https://www.directory.gov.au/portfolios/climate-change-energy-environment-and-water/murray-darling-basin-authority.
[29] Luckett, C.N. (2020). 2019 Fish Kill Summary. Maryland Department of the Environment Water and Science Administration Bioregulatory Monitoring and Response Division Fish Kill Investigation Section. https://mde.maryland.gov/programs/water/FishandShellfish/Documents/Fish_Kill_Reports/2019_FK_ANNUAL_REPORT_final.pdf.
[30] Hartel, E.F., Constantine, R., Torres, L.G. (2014). Changes in habitat use patterns by bottlenose dolphins over a 10-year period render static management boundaries ineffective. Aquatic Conservation: Marine and Freshwater Ecosystems, 25(5): 701-711.
[31] Seaworld Parks and Entertainment. (2021). Habitat and Distribution. https://www.seaworld.org/animals/all-about/bottlenose-dolphin/habitat/.
[32] Wild, S., Krutzen, M., Rankin, R.W., Hoppitt, W.J.E., Gerber, L., Allen, S.J. (2019). Long-term decline in survival and reproduction of dolphins following a marine heatwave. Current Biology, 29(7): 239-240. https://doi.org/10.1016/j.cub.2019.02.047
[33] Learmonth, J.A., MacLeod, C.D., Santos, M.B., Pierce, G.J., Crick, H.Q.P., Robinson, R.A. (2006). Potential effects of climate change on marine mammals. Oceanography and Marine Biology, 44: 431.
[34] MacLeod, C.D., Weir, C.R., Santos, M.B., Dunn, T.E. (2008). Temperature-based summer habitat partitioning between white-beaked and common dolphins around the United Kingdom and Republic of Ireland. Journal of the Marine Biological Association of the United Kingdom, 88(6): 1193-1198. https://doi.org/10.1017/S002531540800074X
[35] Maro, J.F., Hartoko, A., Anggoro, S., Muskananfola, M.R., Toruan, L.N., Dakahamapu, M., Nugraha, E. (2021). The appearance of the humpback whale (Megaptera novaeangliae) during the rainy season in the Alor Waters, Indonesia. AACL Bioflux, 14(3): 1596-1608.