Othman Nazhan Ali*![]() | Raad Hoobi Irzooki
| Raad Hoobi Irzooki![]()
© 2025 The authors. This article is published by IIETA and is licensed under the CC BY 4.0 license (http://creativecommons.org/licenses/by/4.0/).
OPEN ACCESS
River water is the most important water resource used for public life purposes, the most important of which is drinking water. The Tigris River is an important water source for millions of people in Iraq. This study examines changes in a number of physico-chemical parameters at four chosen monitoring sites in order to evaluate the effect of the Samarra barrage lake on the Tigris River's water quality. These stations consist of one upstream of the lake, one inside the reservoir, and two downstream, one on the Tigris River's main course and the other on the Al-Ishaqi project's main canal. Water samples were collected and analyzed during three seasons: autumn (September 2024), winter (January 2025), and spring (May 2025). Fourteen water quality parameters were measured: Dissolved oxygen (DO), pH, turbidity, biological oxygen demand (BOD5), total dissolved solids (TDS), total suspended solids (TSS), sulfates (SO4-2), phosphates (PO4-3), nitrates (NO-3), chlorides (Cl-), calcium (Ca+2), magnesium (Mg+2), sodium (Na+), and potassium (K+). The Canadian water quality index (CCME WQI) was used to evaluate the overall water quality. Dissolved oxygen (DO) values ranged between 4.94 and 6.30 mg/L, with values at ST1 dropping below the WHO permissible limit during the autumn season. pH values ranged between 7.44 and 8.90 and exceeded the upper permissible limit in some autumn and winter samples. Turbidity ranged between 15 and 38 NTU, significantly higher than the permissible limit for drinking water at all stations. Biological oxygen demand (BOD5) values ranged between 2.0 and 15.6 mg/L, exceeding the permissible limit in several samples, indicating organic contamination. The results showed that DO, pH, BOD5, and Turbidity levels at some stations were outside the authorized drinking water standards, but the concentrations of the remaining parameters were within the permitted ranges. In addition, the results indicated that water quality ranged between good and fair, with index values between 76.16 and 83.06 across all stations and seasons. The results also showed that most stations were classified as good during the three seasons, with some values of water quality index falling into the “acceptable” category, such as station ST3 in winter, 76.16. The findings revealed minimal seasonal or spatial variation, indicating a relatively stable water quality status and suggesting that the reservoir does not significantly alter the chemical or physical characteristics of the river water. According to the study's findings, the Samarra barrage lake has little effect on the Tigris River's overall water quality, which stays within levels that are suitable for the environment.
Samarra barrage lake, Tigris River, Canadian water quality, WHO, physico-chemical parameters, Seasonal variation
All living things, including humans, require water as a basic natural resource in order to survive and carry out their daily tasks. However, with the rise in the global population and the increasing demand for clean water for residential and commercial use, this precious resource is facing an increasing risk of extinction. Domestic use, energy generation, industrial production, and mining can degrade water quality and quantity, affecting not only the aquatic ecosystem but also the supply of safe drinking water [1].
The construction and operation of dams is one of the most important methods for managing water resources in arid and semi-arid regions. Dam reservoirs are used for drinking water, fish farming, flood control, agriculture, and power generation [2]. During their operation, dam water can be contaminated by human activities, such as fertilizers and pesticides, the ingress of wastewater from livestock and mining factories, and the ingress of wastewater from urban and rural areas [3]. These pollutants and nutrients entering water supplies can lead to adverse health effects, as well as increased risk of bioaccumulation and biodiversity loss [4].
Surely, growing economic activity and population development are increasing the demand for water for a variety of uses. Several factors, including the construction of dams on the Tigris and Euphrates rivers in riparian countries, changes in global climate, a sharp decline in annual rainfall rates locally, and poor planning for water use within Iraq, have contributed to the significant pressure on Iraq's water resources, especially in the past twenty years [5, 6]. Therefore, effective water resource management is required, and assessing the quantity and quality of water resources is an essential part of effective water management [7].
It is important to determine water quality before it is used for various purposes, including drinking, agriculture, and industrial use [8]. Analyzing a single water quality parameter in relation to its standard value can be time-consuming and difficult for non-experts to understand due to the vast amount of data involved. Therefore, new water classification systems have been developed and implemented that collect, integrate, and analyze multi-sectoral data on water resources into a single value. This is essential given the importance of effective and sustainable water resource management. Among these indicators, water quality indices have been developed as straightforward tools targeting managers, engineers, and decision-makers concerned with water quality and its potential applications [9]. As a result, classifying water according to specific uses has become more important now than ever.
One of the greatest resources for educating decision-makers and concerned citizens about water quality is the water quality index (WQI). It is therefore a key measure for surface water management and assessment. One of the greatest tools for monitoring surface and groundwater contamination is the WQI, which may also be used successfully to carry out programs aimed at improving the quality of water. This index aims to simplify complex data related to water quality so that people can understand and use it [10]. Additionally, the WQI can be used to combine water quality parameter data from multiple locations and time periods, and then convert these data into a single value that identifies the time period and spatial unit in question [11].
Several studies have been conducted to evaluate the water quality of the Tigris River in different locations and at different times along its length in Iraq, using various water quality indicators. These studies have found that the water quality of the Tigris River is poor in populated areas. This deterioration is primarily attributed to urban pollution sources, including sewage, industrial discharges, medical waste, vehicle emissions, and inadequate water treatment. The studies emphasized the need to reduce pollution sources, modernize treatment systems, improve water resource management in the Tigris River, repair infrastructure, and implement a national water protection strategy [12-16].
Using geographic information systems (GIS) and the weighted arithmetic water quality index (WA-WQI), the drinking water quality of the Abbasiya River, a tributary of the Euphrates River in central Iraq, was evaluated. Water samples were taken from eight locations during the dry (2022) and wet (2023) seasons. The water quality index results for this river were generally classified as "poor," with deteriorating quality during the dry season. The causes of pollution included sewage discharge, agricultural runoff, and fertilizer use. The study concluded that the river water is unfit for direct drinking and requires treatment [17].
Other studies have been conducted to assess the water quality of dam lake water in Iraq and several other countries using water quality indices. In Iraq, the water quality of Lake Dukan (Kurdistan, Iraq) was assessed using a water quality index. The results showed deterioration of the dam lake water in 2009 due to human activities. The study recommends continuous monitoring and environmental management [18]. The water quality of Duhok Dam was also studied from 1999 to 2009 using the water quality index (WQI). The results showed that the water was polluted and unfit for drinking due to human activities [19]. In another study conducted in 2013, the water quality of Duhok Dam Lake was studied using the irrigation water quality index (IWQI), and the water was rated as excellent for irrigation purposes at all sites [20]. Another study evaluated the water quality of the Duhok Valley, one of the water sources entering the Mosul Dam Lake, using the water quality index (WQI). The results showed that water quality ranged from poor to moderate due to high sewage contamination and low dissolved oxygen in some areas [21]. In some countries, a study evaluated the water quality of the La Vega Dam in Mexico in 2014 using the WQI. It found seasonal contamination from agricultural runoff, domestic wastewater, and industry [22]. In northeastern Poland, the water quality of four dams was found to be generally suitable for irrigation and limited recreational use [23]. The water quality of the Simli Dam in Islamabad, Pakistan, was also evaluated using the WQI [24]. Using the U-WQI, the findings demonstrated that the water quality of Iran's Ilam Dam was poor between 2016 and 2020 [25]. The study evaluated the water quality of the Aksu River in Turkey between 2011 and 2012 using the water quality index (WQI). The results showed good water quality near the Karaca Evren-1 Dam, but poor quality in other areas due to pollution. Chemical demand (COD) and magnesium had the greatest impact [26].
The Tigris River water is one of the most important surface water resources for millions of people, whether for drinking or other purposes. Because the Samarra Barrage Lake collects water and is subject to various weather conditions, such as high temperatures that cause evaporation and raise the concentration of certain elements, or human activities that pollute its drinking water, the current study attempts to examine the impact of the lake on the quality of the Tigris River water.
The Canadian water quality index (CCME WQI) was used for three seasons: Autumn, Winter, and Spring, between September 2024 and May 2025.
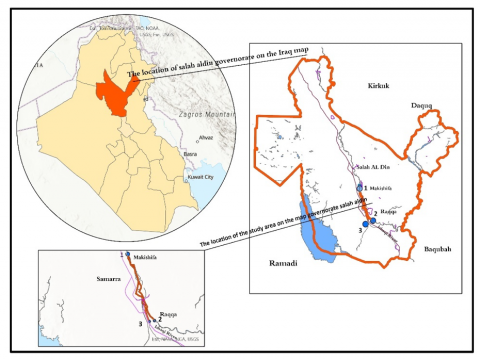
Samarra city is one of the main districts of the Salah al-Din Governorate, Iraq. It is situated on the main road that connects Baghdad and Mosul cities, 120 kilometers north of the capital Baghdad city, and 270 kilometers away from Mosul Governorate. Samarra city is situated between latitudes 34°11'52.00"N and longitudes 43°53'30.84"E, as calculated by latitude and longitude [27]. The study area extends on the Tigris River from the Makishifa city, north of Samarra, to the Samarra barrage lake, reaching the Raqqa area, south of Samarra, as shown in Figure 1. For testing, four stations were selected in the study area along the Tigris River, and samples were taken for three seasons (autumn, winter, and spring). Sample collection and laboratory tests were conducted over three seasons: Autumn (September 2024), Winter (January 2025), and Spring (May 2025).
Figure 1. The location of the study area
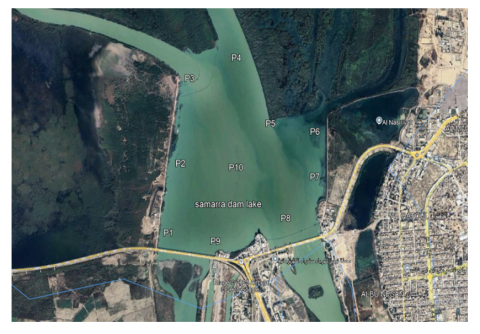
Station 1 is located before the Samarra barrage lake at Makishifa district, Stations 3 and 4 are located after the Samarra barrage on the Tigris River at Raqqa area and the main canal of the Ishaqi irrigation project, respectively. Station 2 is located within Samarra Lake; this station includes ten points distributed to cover all areas of the lake, as shown in Figure 2. It is important to note that there are rural and residential regions along the Tigris River on both sides of the study area, where people live and engage in a variety of activities that may influence the quality of its water.
Figure 2. Aerial photo of Samarra barrage lake
The Samarra barrage is located on the Tigris River near the city of Samarra in Iraq. It was built in 1951 and completed in 1956 with a length of 1200 m. Samarra Barrage is a major hydraulic structure on the Tigris River, with a maximum design discharge of 7,000 m³/s and hydroelectric gates discharging 980 m³/s (three turbines × 326 m³/s). It is connected to the Tharthar Regulator, which currently discharges between 8,500 to 9,000 m³/s, with plans to expand its capacity to 13,500 m³/s during major floods. The barrage lake has an area of 40 to 50 square kilometers at full supply and is primarily used for flow regulation rather than long-term storage. This barrage is connected to the Tharthar canal to the west via a diversion channel. The construction aims of this project are to prevent flooding of Baghdad city and the low-lying lands adjacent to the river course and to divert flood waters to Tharthar lake. The storage capacity of this barrage lake is about 150,000,000 m3.
Water samples were collected during three distinct field campaigns: September 2024 (autumn), January 2025 (winter), and May 2025 (spring). All samples were taken during daytime hours (between 9:00 a.m. and 2:00 p.m.). All samples were collected two meters below the river's surface. This depth was chosen because the surface layer is often affected by dense algal growth, hydrocarbons, floating pollutants, and rapid evaporation, which directly impact the data. Sampling at a depth of two meters represents actual physical and chemical changes and provides a more accurate picture of the average water mass. This process is consistent with similar environmental and hydrological research (APHA, 2017), avoiding the shallow, stagnant water around the borders. After that, samples were gathered and combined at the same location. The sample size was limited to two liters. After being transferred to the lab in plastic containers, the samples were kept out of direct sunlight and under ideal conditions. Every test was carried out in the labs of the Department of Environmental Engineering at the College of Engineering and the College of Agriculture at Tikrit University. Fourteen criteria were chosen: Dissolved oxygen (DO), pH, turbidity, biological oxygen demand (BOD5), total dissolved solids (TDS), total suspended solids (TSS), sulfates (SO4-2), phosphates (PO4-3), nitrates (NO-3), chlorides (Cl-), calcium (Ca+2), magnesium (Mg+2), sodium (Na+), and potassium (K+) ions. All samples were analyzed for all sites during the three seasons using modern chemical processes, electronic devices, and various laboratory tools, as shown in Table 1. Standard methods were used for water testing, where the results were recorded and the values of all elements were extracted. Table 2 shows the parameters, their units, and the permissible limit for each parameter according to the Iraqi standard specification for drinking [27], and the World Health Organization's drinking water standards [28].
Table 1. Devices used for laboratory tests
|
Test |
Unit |
Device (Model, Manufacturer, Country) |
Standard Method (APHA NO) |
Accuracy |
|
DO |
mg/L |
Spectrophotometer (DR-3900, HACH, USA) |
4500-O |
±0.01 |
|
pH |
----- |
pH meter (Waterproof 6011A, EZDO, Taiwan) |
4500-H+B |
±0.01 |
|
Turbidity |
NTU |
Turbidity meter (TB210 IR, Lovibond, Germany) |
2130B |
±0.1 |
|
BOD5 |
mg/L |
BOD System Oxi Direct, Germany |
5210B |
±0.1 |
|
TDS |
mg/L |
TDS meter (Portable A1, EZDO, China) |
2540C |
±1 |
|
TSS |
mg/L |
Spectrophotometer (DR-3900, HACH, USA) |
2540D |
±1 |
|
SO4-2 |
mg/L |
Spectrophotometer (DR-3900, HACH, USA) |
4500-SO4-2 |
±0.1 |
|
PO4+3 |
mg/L |
Spectrophotometer (DR-3900, HACH, USA) |
4500-P |
±0.01 |
|
NO3- |
mg/L |
Spectrophotometer (DR-3900, HACH, USA) |
4500-NO3- |
±0.01 |
|
Cl- |
mg/L |
Spectrophotometer (DR-3900, HACH, USA) |
4500-Cl- |
±0.1 |
|
Ca+2 |
mg/L |
Colorimeter (DR/870, HACH, USA) |
3500-Ca+2 |
±0.1 |
|
Mg+2 |
mg/L |
Spectrophotometer (DR-3900, HACH, USA) |
3500-Mg+2 |
±0.1 |
|
Na+ |
mg/L |
Spectrophotometer (DR-3900, HACH, USA) |
3500-Na+ |
±0.1 |
|
K+ |
mg/L |
Spectrophotometer (DR-3900, HACH, USA) |
3500-K+ |
±0.1 |
Table 2. Iraqi standards for permissible water quality limits of criteria for drinking usage [27, 28]
|
No. |
Parameters |
Units |
Limit |
|
1 |
DO |
mg/L |
>5 |
|
2 |
pH |
…. |
6.5-8.5 |
|
3 |
Turbidity |
NTU |
<5 |
|
4 |
BOD5 |
mg/L |
<5 |
|
5 |
TDS |
mg/L |
1000 |
|
6 |
TSS |
mg/L |
<10 |
|
7 |
SO4-2 |
mg/L |
350 |
|
8 |
PO4-3 |
mg/L |
0.4 |
|
9 |
NO3 |
mg/L |
50 |
|
10 |
Cl- |
mg/L |
350 |
|
11 |
Ca+2 |
mg/L |
150 |
|
12 |
Mg+2 |
mg/L |
100 |
|
13 |
Na+ |
mg/L |
200 |
|
14 |
K+ |
mg/L |
10 |
The CCME water quality index is a useful tool for simplifying complex water quality data and making it more accessible to a wide audience (CCME WQI). The Index consists of three parts: Amplitude is the degree to which the regulations are broken; frequency is the number of times these criteria are not fulfilled; and scope is the number of metrics that do not meet water quality guidelines. The index generates a number between 0 (worst water quality) and 100 (best water quality). These figures are divided into five descriptive sections for ease of presentation. The Canadian authorities created this index (CCME) to determine the index scores through the following relationships [29, 30].
In relation to the total number of variables tested, the F1 is known as Scope, and it shows the proportion of variables that fail to reach their goals at least once during the period under consideration (referred to as "failed variables"):
$F_1=\left(\frac{\text {Number of faild parameters}}{\text {Total number of parameters}}\right) \times 100$ (1)
F2 represents the percentage of failed tests, which is called frequency:
$F_2=\left(\frac{\text {Number of faild tests }}{\text { Total number of tests}}\right) \times 100$ (2)
F3, or amplitude, is a measure of how much the failed tests deviate from their intended goals. This is how it is decided:
The term “Excursion” represents the number of times that a certain concentration is different from the objective. When the value of the test is less than the objective, it is given by:
excursion$_i=\left(\frac{\text {Failed test value}_i}{\text {Objective}_j}\right)-1$ (3)
If the test value exceeds the target, the deviation is given by:
excursion$_i=\left(\frac{\text {Objective}_{\mathrm{j}}}{\text {Failed test value}_{\mathrm{i}}}\right)-1$ (4)
The normalized sum of excursions (nse), which is calculated as follows, is the sum of the excursions of each individual test divided by the total number of tests:
$n s e=\frac{\sum_{i=1}^n \text{excursion}_i}{\text {No. of tests}}$ (5)
F3 is calculated through the following relationship:
$F_3=\left(\frac{n s e}{0.01 n s e+0.01}\right)$ (6)
Finally, the CCME WQI is calculated using the equation:
$C C M E W Q I=100-\left(\frac{\sqrt{F_1^2+F_2^2+F_3^2}}{1.732}\right)$ (7)
As shown in Table 3, the water quality is ranked according to the CCME WQI [30].
Table 3. Classification of water according to CCME WQI [30]
|
Water Quality Rating |
WQI |
|
Excellent |
95 – 100 |
|
Good |
80 – 94 |
|
Fair |
60 – 79 |
|
Marginal |
45 – 59 |
|
Poor |
0 – 44 |
5.1 Results of water characteristics
Table 4 presents the results of the various characteristics of water samples collected from selected stations within the study area over three seasons, spanning from September 2024 to May 2025. The water quality index (WQI) was calculated separately for each of the ten points within ST2, as shown in Table 5, which includes the WQI values, the maximum and minimum, as well as the mean and standard deviation of those values. The results of the water quality index were discussed between the stations, and for station ST2, the average of its index values was adopted for the ten points to discuss the results with the stations.
Table 4. Characteristics of water samples taken from the study stations
|
Test |
ST1 |
ST2 |
ST3 |
ST4 |
||||||||||
|
Pt. 1 |
Pt. 2 |
Pt. 3 |
Pt. 4 |
Pt. 5 |
Pt. 6 |
Pt. 7 |
Pt. 8 |
Pt. 9 |
Pt. 10 |
Average |
||||
|
September 2024 |
||||||||||||||
|
DO |
4.94 |
4.95 |
5.18 |
5.18 |
5.7 |
5.43 |
4.9 |
4.8 |
5.18 |
5.1 |
5.3 |
5.17 |
5.16 |
5.03 |
|
pH |
7.87 |
8.65 |
8.78 |
8.78 |
8.76 |
8.85 |
8.9 |
8.26 |
8.38 |
8.5 |
8.5 |
8.63 |
8.25 |
8.61 |
|
TUR |
22 |
18 |
16 |
25 |
22 |
24 |
15 |
15 |
17 |
25 |
24 |
20.1 |
26 |
25 |
|
BOD5 |
6 |
5 |
0 |
15.6 |
0 |
0 |
3 |
7 |
13 |
10 |
10 |
6.36 |
6.73 |
5.36 |
|
TDS |
456.3 |
465 |
459 |
464 |
460 |
459 |
472 |
470 |
462 |
460 |
468 |
463 |
470 |
483.3 |
|
TSS |
3.2 |
0 |
0 |
3.3 |
2.7 |
5 |
3.8 |
0.8 |
1 |
7.5 |
8 |
3.21 |
4.1 |
3.9 |
|
SO4-2 |
34.66 |
23 |
23 |
24 |
23 |
25 |
24 |
25 |
26 |
24 |
29 |
24.4 |
36.16 |
31.15 |
|
PO4-3 |
0.13 |
0.05 |
0.05 |
0.13 |
0.19 |
0.07 |
0 |
0.25 |
0.08 |
0.17 |
0.28 |
0.12 |
0.1 |
0.1 |
|
NO3- |
6.31 |
4.88 |
5.26 |
4.86 |
6.69 |
5.51 |
4.43 |
5.55 |
5.97 |
6.03 |
7.19 |
5.63 |
7.33 |
6.92 |
|
Cl- |
32.33 |
36 |
26 |
24 |
26 |
28 |
26 |
26 |
24 |
22 |
30 |
26.8 |
32.66 |
32.63 |
|
Ca+2 |
97.1 |
67.3 |
67.3 |
68.9 |
67.5 |
65 |
65.7 |
72.1 |
64.1 |
80.1 |
83 |
70.08 |
98.93 |
97.73 |
|
Mg+2 |
18.06 |
8.7 |
8.7 |
5.8 |
2.9 |
9.7 |
5.8 |
10.7 |
4.8 |
14.6 |
13.7 |
8.54 |
13.76 |
18.63 |
|
Na+ |
30.1 |
31 |
32 |
32 |
30 |
31 |
33 |
31 |
30 |
29 |
29 |
30.8 |
29.33 |
30.76 |
|
K+ |
2.67 |
2.5 |
2.44 |
2.41 |
2.39 |
2.42 |
2.58 |
2.55 |
2.4 |
2.37 |
2.5 |
2.45 |
2.51 |
2.28 |
|
January 2025 |
||||||||||||||
|
DO |
5.47 |
5.2 |
4.8 |
5.2 |
5.7 |
5.6 |
5.18 |
5.01 |
5.7 |
5.66 |
5.62 |
5.36 |
5.57 |
5.73 |
|
pH |
8.08 |
7.5 |
8.27 |
8.34 |
8.39 |
7.97 |
8.74 |
8.52 |
8.5 |
8.49 |
8.3 |
8.3 |
8.68 |
8.51 |
|
TUR |
24 |
22 |
19 |
24 |
26 |
28 |
20 |
19 |
30 |
33 |
33 |
25.4 |
32 |
32 |
|
BOD5 |
5.43 |
2 |
0 |
3 |
5 |
6.5 |
5.8 |
7.9 |
6 |
8 |
7.7 |
5.69 |
5.43 |
2.96 |
|
TDS |
548 |
545 |
550 |
532 |
562 |
555 |
523 |
531 |
552 |
530 |
519 |
539.9 |
546.7 |
564.7 |
|
TSS |
5.3 |
1 |
1.9 |
0 |
5 |
7.7 |
4 |
2 |
4.5 |
8 |
9 |
4.31 |
6 |
5.4 |
|
SO4-2 |
33.66 |
35 |
39 |
41 |
42 |
45 |
42 |
40 |
40 |
38 |
45 |
40.7 |
41 |
33.66 |
|
PO4-3 |
0.12 |
0.05 |
0.15 |
0.09 |
0.12 |
0.07 |
0.04 |
0.03 |
0.08 |
0.04 |
0.02 |
0.069 |
0.086 |
0.007 |
|
NO3- |
6.67 |
6.99 |
7.39 |
6.97 |
7.54 |
6.4 |
6.84 |
5.88 |
6.18 |
5.7 |
7.9 |
6.77 |
5.77 |
5.49 |
|
Cl- |
39 |
45.9 |
42 |
39.9 |
50 |
52 |
38 |
38 |
37 |
36 |
40 |
41.88 |
41 |
31.93 |
|
Ca+2 |
53.5 |
64 |
64 |
68 |
70 |
60 |
65 |
61 |
55 |
50 |
52 |
60.9 |
63.33 |
58.66 |
|
Mg+2 |
25.26 |
19.5 |
20 |
19 |
18.7 |
20.3 |
19.2 |
17.5 |
17 |
18.3 |
17.8 |
18.73 |
22.4 |
21.5 |
|
Na+ |
22 |
26 |
25 |
25 |
28 |
28 |
27 |
29 |
30 |
25 |
27 |
27 |
25.66 |
24 |
|
K+ |
2.11 |
2.2 |
2.18 |
2.09 |
2.11 |
2.1 |
2.07 |
2 |
1.98 |
1.93 |
1.98 |
2.06 |
2.38 |
2.36 |
|
May 2025 |
||||||||||||||
|
DO |
5.39 |
5.25 |
5.4 |
5.38 |
5.8 |
6.02 |
6 |
5.9 |
6.3 |
6.25 |
6.19 |
5.84 |
6.24 |
5.96 |
|
pH |
7.66 |
7.65 |
8.2 |
8.15 |
8.3 |
8.1 |
8.55 |
7.95 |
7.95 |
7.98 |
7.72 |
8.05 |
7.44 |
7.63 |
|
TUR |
26 |
21 |
24 |
20 |
30 |
35 |
30 |
25 |
33 |
38 |
35 |
29.1 |
35 |
31 |
|
BOD5 |
5.23 |
3.9 |
2 |
5 |
1 |
6.1 |
7 |
7.2 |
8.2 |
6.7 |
7.5 |
5.68 |
3.23 |
5.76 |
|
TDS |
454 |
479 |
466 |
453 |
480 |
492 |
461 |
450 |
477 |
493 |
511 |
476.2 |
463 |
454 |
|
TSS |
4.5 |
3.8 |
2 |
2 |
4.3 |
7 |
0.8 |
4.3 |
6 |
7 |
5.5 |
4.27 |
6.13 |
5.76 |
|
SO4-2 |
30.3 |
31 |
38 |
45 |
47 |
50 |
52 |
54 |
45 |
49 |
53 |
46.4 |
36.33 |
36.66 |
|
PO4-3 |
0.15 |
0.3 |
0.3 |
0.25 |
0.16 |
0.13 |
0.19 |
0.17 |
0.13 |
0.11 |
0.14 |
0.18 |
0.21 |
0.14 |
|
NO3- |
6.63 |
8.2 |
8.2 |
7.99 |
8.1 |
8.4 |
7.8 |
7.7 |
8.7 |
8.8 |
8.9 |
8.27 |
8.11 |
8.62 |
|
Cl- |
31.3 |
33.9 |
35.2 |
34,7 |
35.3 |
33.9 |
34.5 |
37 |
37.8 |
38 |
36.5 |
35.68 |
30.96 |
33.63 |
|
Ca+2 |
72.3 |
76 |
79.9 |
77 |
83 |
83 |
73.5 |
75 |
70.1 |
68 |
66 |
75.13 |
79.66 |
81.33 |
|
Mg+2 |
18.23 |
23 |
23.5 |
23.9 |
25 |
23.1 |
24.7 |
23.7 |
23.4 |
22.1 |
21.8 |
23.42 |
29.73 |
27.3 |
|
Na+ |
35.66 |
38 |
38 |
34 |
35 |
32 |
33 |
37 |
39 |
30 |
32 |
34.8 |
33.16 |
33.33 |
|
K+ |
3.41 |
3.5 |
3.42 |
3.29 |
3.19 |
3.38 |
3.7 |
3.7 |
3.52 |
3.59 |
3.43 |
3.47 |
3.37 |
3.39 |
Table 5. WQI values for ST2, in addition to the minimum, maximum, average, and standard deviation values during the study period
|
Seasons |
Points |
Min |
max |
Average |
S.D ± |
|||||||||
|
P1 |
P2 |
P3 |
P4 |
P5 |
P6 |
P7 |
P8 |
P9 |
P10 |
|||||
|
Autumn |
74.49 |
85.9 |
75.18 |
83.72 |
82.96 |
81.01 |
80.52 |
82.68 |
80.85 |
81.22 |
74.49 |
85.9 |
80.85 |
3.57 |
|
Winter |
87.33 |
84.83 |
86.37 |
82.29 |
81.02 |
78.44 |
79.22 |
80.5 |
78.8 |
78.9 |
78.44 |
87.33 |
81.76 |
3.31 |
|
Spring |
87.75 |
86.37 |
84.52 |
83.73 |
78.76 |
76.62 |
81.86 |
78.74 |
77.6 |
78.3 |
76.65 |
87.75 |
81.42 |
3.96 |
By comparing the test findings of water samples taken from the chosen stations over the course of three seasons with their standards based on the WHO recommendations displayed in Table 2, the following results can be drawn:
5.2 Results of water quality index (WQI)
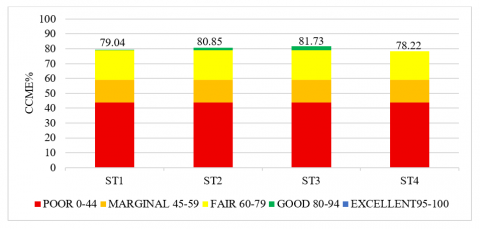
Using the water properties values shown in Table 4, the water quality index (CCME WQI) was calculated for all stations within the Tigris River study area for three seasons using Eqs. (1) to (7), as shown in Figures 3 to 5.
Figure 3. CCME WQI values for all stations during the autumn season 2024 (September)
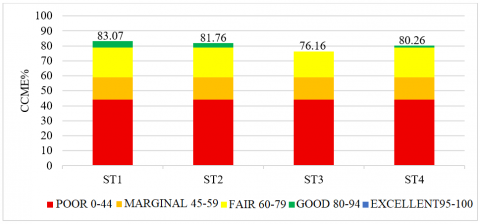
Figure 4. CCME WQI values for all stations during the winter season 2025 (January)
Figure 5. CCME WQI values for all stations during the spring season 2025 (May)
In the autumn season of 2024 (September), the water quality index values at ST1 and ST2 were 79.04, 80.85, respectively, indicating good water quality. The water quality at ST3 was 81.73, which was considered good. It was 78.22 at ST4, indicating marginal water quality. The difference between the highest and lowest water quality index values was ± 3.63%.
The water quality index values for ST1, ST2, and ST4 in the winter season of 2025 (January) were 83.07, 81.76, and 80.26, respectively, indicating good water quality at these stations. It was 76.16 with fair water quality at ST3. The difference between the highest and lowest water quality index values was ± 6.91%.
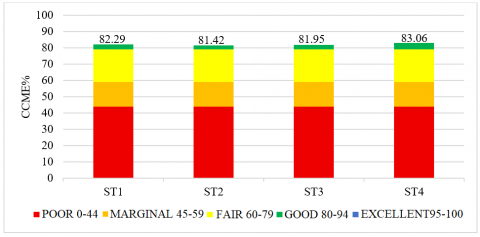
All stations reported good water quality for drinking in the spring season of 2025 (May), where ST1, ST2, ST3, and ST4 stations have water quality index values of 82.29, 81.42, 81.95, and 83.06, respectively. The variation between the greatest and lowest values of water quality index was ±2.04%.
This study focuses on assessing water quality through the water quality index (WQI), a robust mathematical model that inherently integrates spatial and seasonal variations. While four sites were included to provide spatial coverage, in-depth mechanistic or statistical analysis of differences among stations was not required, as the WQI values themselves effectively capture these variations and allow clear site-to-site comparison.
According to the results of the current investigation, drinking water has a quality range of fair to good. Significant variations were found when compared to earlier research on the Tigris River. For example, the 1978–2009 study on Duhok Lake [18] revealed that human activity-induced high EC and BOD had caused the lake's water quality to deteriorate from good to poor. A different study on Dohuk Lake (1999-2009) [19] revealed high levels of hardness, alkalinity, and EC along with poor water quality. A follow-up evaluation of Dohuk Lake in 2011 [20] found intermediate nutritional conditions and high sulfate and hardness levels. Furthermore, research on a section of the Tigris River in the Salah al-Din Governorate in 2022–2023 revealed poor to extremely poor water quality, influenced by a number of physical and chemical characteristics that were higher than allowed [16]. However, compared to earlier research on the Tigris river before the study region, the current study revealed a rise in turbidity levels throughout the whole study area and throughout all seasons. The current study sites, on the other hand, consistently had better water quality and stability across the seasons. The Samarra Barrage regulatory effect, which regulates the Tigris River's flow and levels it out, lowers pollution levels and lessens seasonal variations, and is partially responsible for this development. Therefore, the observed increase in water quality in the current study compared to earlier studies can be explained by the dam's regulatory role and the decreased human effect.
Based on the results of the current study, the following conclusions can be drawn:
● According to the CCME WQI classification, the water quality in the study region generally fell between fair and good, meaning that the river water is fit for drinking and most other uses with little treatment.
● The autumn season saw a range of WQI values from 77.18 to 81.78. The water quality of stations ST1 and ST3 was rated as good, whilst ST2 and ST4 were categorized as fair and marginal, respectively. DO, pH, turbidity, and BOD5 were among the parameters that exceeded permissible limits, affecting the overall quality of the water.
● During the winter season, the WQI values varied between 76.16 and 83.07. The water quality at most stations was good, with the exception of ST3, which received a fair rating. BOD5, pH, and turbidity were once more the main values that were over allowable limits.
● The best water quality results were obtained during the spring, when all stations were in the good category. Better water quality stability was indicated by the WQI values, which ranged narrowly from 81.02 to 83.06. Only turbidity and BOD5 exceeded the standards at some stations.
● The variance in WQI values by season was least in the spring (±2.04%), followed by autumn (±3.63%) and winter (±6.91%), indicating that springtime has the most stable water quality conditions.
Across all three seasons, the parameters TDS, TSS, SO4-2, PO4-3, NO-3, Cl-, Ca+2, Mg+2, Na+, and K+ remained within the acceptable limits for drinking water according to international standards.
The results of the current study revealed some deviations from the approved drinking water specifications. Therefore, the following proposals can be made to improve the quality of the Tigris River water to standards that do not affect human health:
● Establish a continuous water quality monitoring program, especially during the autumn and winter seasons, when fluctuations and declining water quality index values are observed. This program will help detect deteriorating water quality early and enable timely intervention.
● Turbidity and biochemical demand (BOD5) should be controlled, as these parameters have consistently been outside acceptable limits at most stations and seasons. Their persistence indicates potential organic contamination sources that require further investigation and management.
● Improving wastewater treatment infrastructure in urban and adjacent rural areas to reduce organic and suspended loads entering the river.
● Promote environmentally sustainable agricultural practices in the river basin area, including the rational use of fertilizers and proper waste disposal, to reduce nutrient inputs such as phosphates and nitrates, even if they are within the permissible limits during this study.
The authors are grateful for the moral support towards this research by the Environmental Engineering Department, College of Engineering, Tikrit University.
[1] Partridge, L., Gems, D. (2006). Beyond the evolutionary theory of ageing, from functional genomics to evo-gero. Trends in Ecology & Evolution, 21(6): 334-340. https://doi.org/10.1016/j.tree.2006.02.008
[2] Kutlu, B., Aydın, R., Danabas, D., Serdar, O. (2020). Temporal and seasonal variations in phytoplankton community structure in Uzuncayir dam lake (Tunceli, Turkey). Environmental Monitoring and Assessment, 192: 105. https://doi.org/10.1007/s10661-019-8046-3
[3] Karimi, A., Naghizadeh, A., Biglari, H., Peirovi, R., Ghasemi, A., Zarei, A. (2020). Assessment of human health risks and pollution index for heavy metals in farmlands irrigated by effluents of stabilization ponds. Environmental Science and Pollution International, 27(10): 10317-10327. https://doi.org/10.1007/s11356-020-07642-6
[4] Baştürk, E. (2019). Assessing water quality of Mamasın Dam, Turkey: Using water quality index method ecological and health risk assessments. Clean Soil Air Water, 47(12): 1900251. https://doi.org/10.1002/clen.201900251
[5] Rahi, K.A., Halihan, T. (2010). Changes in the salinity of the Euphrates River system in Iraq. Regional Environmental Change, 10(1): 27-35. https://doi.org/10.1007/s10113-009-0083-y
[6] Jones, C., Sultan, M., Yan, E., Milewski, A., Hussein, M., Al-Dousari, A., Al-Kaisy, S., Becker, R. (2008). Hydrologic impacts of engineering projects on the Tigris-Euphrates system and its marshlands. Journal of Hydrology, 353(1-2): 59-75. https://doi.org/10.1016/j.jhydrol.2008.01.029
[7] Szejba, D., PapierOwska, E., Cymes, I., BańkOwska, A. (2016). Nitrate nitrogen and phosphate concentrations in drainflw: An example of clay soil. Journal of Elementology, 21(3): 899-913. https://doi.org/10.5601/jelem.2015.20.4.922
[8] Sargaonkar, A., Deshpande, V. (2003). Development of an overall index of pollution for surface water based on a general classification scheme in Indian context. Environmental Monitoring and Assessment, 89: 43-67. https://doi.org/10.1023/A:1025886025137
[9] Cude, C.G. (2001). Oregon water quality index: A tool for evaluating water quality management effectiveness. JAWRA Journal of the American Water Resources Association, 37(1): 125-137. https://doi.org/10.1111/j.1752-1688.2001.tb05480.x
[10] Alam, M., Pathak, J.K. (2010). Rapid assessment of water quality index of Ramganga River, Western Uttar Pradesh (India) using a computer program. Nature and Science, 8(11).
[11] Shultz, M.T. (2001). A critique of EPA’s index of watershed indicators. Journal of Environmental Management, 62(4): 429-442. https://doi.org/10.1006/jema.2001.0451
[12] Al-Janabi, Z.Z., Al-Kubaisi, A., Al-Obaidy, A.H.M.J. (2012). Assessment of water quality of Tigris River by using water quality index (CCME WQI). Al-Nahrain Journal of Science, 15(1): 119-126.
[13] AL-Dulaimi, G.A., Younes, M.K. (2017). Assessment of potable water quality in Baghdad City, Iraq. Air, Soil and Water Research, 10: 1-5. https://doi.org/10.1177/1178622117733441
[14] Abdul Jabar, M.A.B., Thabit, J.A. (2021). Chemical pollution risks for many drinking water sources in Baghdad city, Iraq. Polish Journal of Environmental Studies, 30(2): 1203-1214. https://doi.org/10.15244/pjoes/120767
[15] Al-Ansari, N., Ewaid, S.H., Chabuk, A., Abed, S.A., et al. (2024). Tigris River water quality quantifying using the Iraq water quality index (IraqWQI) and some statistical techniques. Engineering, 16(6): 149-166. https://doi.org/10.4236/eng.2024.166012
[16] Allawi, K.A., Ali, S.F. (2023) Assessment of water quality of Tigris River by using WQ index in Salah Al-Din province. GSC Biological and Pharmaceutical Sciences, 24(2): 80-86. https://doi.org/10.30574/gscbps.2023.24.2.0290
[17] Al Yousif, M.A., Chabuk, A. (2023). Assessment of the Al-Abbasiyah River (Iraq) water quality for drinking purposes using the water quality index and GIS software. Journal of Ecological Engineering, 24(8): 157-174. https://doi.org/10.12911/22998993/166396
[18] Alobaidy, A.H.M.J., Abid, H.S., Maulood, B.K. (2010) Application of water quality index for assessment of Dokan lake ecosystem, Kurdistan region, Iraq. Journal of Water Resource and Protection, 2(9): 792-798. https://doi.org/10.4236/jwarp.2010.29093
[19] Toma, J.J. (2012). Water quality index for assessment of water quality of Duhok lake, Kurdistan region of Iraq. Journal of Advanced Laboratory Research in Biology, 3(3): 119-124.
[20] Shekha, Y.A., Ali, A.L., Toma, J.J. (2017). Assessment of water quality and trophic status of Duhok Lake Dam. Baghdad Science Journal, 14(2): 335-342. https://doi.org/10.21123/bsj.2017.14.2.0335
[21] Qaseem, N., Al-Saffawi, A.Y.T., Maher, K. (2022) Assessment the environmental reality of Duhok valley water on the water quality of Mosul dam lake by using water quality index (WQI). Egyptian Journal of Chemistry, 65(131): 1091-1098. https://doi.org/10.21608/ejchem.2022.133799.5897
[22] Mora-Orozco, C.D.L., Flores-Lopez, H., Rubio-Arias, H., Chavez-Duran, A. (2017). Developing a water quality index (WQI) for an irrigation dam. International Journal of Environmental Research and Public Health, 14(5): 439. https://doi.org/10.3390/ijerph14050439
[23] Cymes, I., Glińska-Lewczuk, K. (2016). The use of water quality indices (WQI and SAR) for multipurpose assessment of water in dam reservoirs. Journal of Elementology, 21(4): 1211-1224. https://doi.org/10.5601/jelem.2016.21.2.1200
[24] Jamil, A., Ali, A., Farhan, F., Iqbal, S.Z. (2020). Determination of water quality index of Simly Dam, islamabad by arithmetic weighted method. International Journal of Economic and Environmental Geology (IJEEG), 11(3): 11-15.
[25] Amiri, H., Hadizadeh, B., Mooselu, M.G., Azadi, S., Sayyahzadeh, A.H. (2021). Evaluating the water quality index in dam lake for cold water fish farming. Environmental Challenges, 5: 100378. htttps://doi.org/10.1016/j.envc.2021.100378
[26] Şener, Ş., Şener, E., Davraz, A. (2017). Evaluation of water quality using water quality index (WQI) method and GIS in Aksu River (SW-Turkey). Science of the Total Environment, 584: 131-144. https://doi.org/10.1016/j.scitotenv.2017.01.102
[27] Abbas, H.A. (2025). Iraqi drinking water quality standards (IQS 417/ 2009) - Revisited. Tikrit Journal of Engineering Sciences, 32(1): 1606. https://doi.org/10.25130/tjes.32.1.23
[28] WHO (2004). The world health report 2004: Changing history. Geneva: World Health Organization. https://apps.who.int/iris/handle/10665/42891.
[29] Al-Saffawi, A.Y.T. (2018). Application of the CCME WQI to evaluate water quality for drinking purpose: A case study for groundwater quality of Al-Mahalibiyah sub district, Nineveh province/Iraq. Rafidain Journal of Science, 27(4): 193-202. https://doi.org/10.33899/rjs.2018.159362
[30] Madhava, S., Ahamada, Kumar, A., Kushawahaa, J., Singhc, P., Mishra, P.K. (2018). Geochemical assessment of groundwater quality for its suitability for drinking and irrigation purpose in rural areas of Sant Ravidas Nagar (Bhadohi), Uttar Pradesh. Geology, Ecology, and Landscapes, 2(2): 127-136. https://doi.org/10.1080/24749508.2018.1452485