Rika Reviza Rachmawati*![]() | Unggul Handoko
| Unggul Handoko![]() | Samuel Fery Purba
| Samuel Fery Purba![]() | Ulfah Karmila Sari
| Ulfah Karmila Sari![]() | Yopi Saleh
| Yopi Saleh![]() | Zahara Zahara
| Zahara Zahara![]() | Meidaliyantisyah Meidaliyantisyah
| Meidaliyantisyah Meidaliyantisyah![]() | Danarsi Diptaningsari
| Danarsi Diptaningsari![]() | Slameto Slameto
| Slameto Slameto![]() | Alfayanti Alfayanti
| Alfayanti Alfayanti![]() | Nova Yulanda Putri Sipahutar
| Nova Yulanda Putri Sipahutar![]()
© 2025 The authors. This article is published by IIETA and is licensed under the CC BY 4.0 license (http://creativecommons.org/licenses/by/4.0/).
OPEN ACCESS
Climate change poses escalating risks to global food security, with rice production in tropical regions like Java, Indonesia—contributing over 50% of the nation’s output—being particularly vulnerable. This study addresses this gap by analyzing 30 years (1994-2023) of high-resolution precipitation, temperature, and yield data across six key rice-producing districts. Daily rainfall data (CHIRPS, resolution 0.05°) and monthly temperature data (NASA POWER, resolution 0.5°) were extracted based on representative district coordinates. The crop yield data from Statistics Indonesia, which had isolated the climate signals, was regressed using an Ordinary Least Squares (OLS) model to measure regional disparities in the impact of rainfall, maximum temperature, and minimum temperature. The results showed that rainfall was the main climatic factor that significantly affected crop yields in the five districts (p < 0.01). Regression estimates showed that a 1mm increase in rainfall during the growing season could increase rice yields by 0.08-0.13% in the five main districts, with the largest increase in Grobogan (0.13%). These findings underscore Java’s heterogeneous climate-rice dynamics, challenging the efficacy of uniform adaptation policies. We advocate for region-specific strategies, prioritizing irrigation investments in precipitation-sensitive areas and heat-resilient cultivars in temperature-vulnerable zones.
climate change, precipitation, OLS, regional disparities, rice production, temperature variability
Climate change presents a substantial challenge to Indonesia, an archipelagic nation characterized by diverse ecosystems and highly dependent on climate-sensitive sectors such as agriculture, fisheries, and forestry. Due to its geography and socio-economic conditions, the country is particularly vulnerable to climate-induced risks, including threats to food security and economic stability. As the world’s fourth-largest rice producer, Indonesia’s agricultural sector—especially rice production—is particularly susceptible to the impacts of climate change. Rice has an optimal temperature range for growth and development, generally between 25-35℃. Rice growth is also affected by climate-induced changes in rainfall, which will impact the availability of soil moisture, which is essential for optimal physiological function [1]. Variations in precipitation, rising temperatures, and extreme weather events have been shown to reduce agricultural productivity and increase crop failure rates [2-4]. Projections suggest that by 2050, climate change could reduce rice productivity by 14% in South Asia, 10% in East Asia, and 15% in Sub-Saharan Africa, with Indonesia likely facing similar declines [5]. Other staple crops like cassava and sweet potatoes are also at risk, as climatic factors such as temperature and rainfall variability significantly affect their production [6].
The socio-economic implications of these agricultural challenges are profound. Agriculture employs a significant portion of Indonesia’s population, and climate-induced disruptions threaten the livelihoods of millions, especially in rural areas. Reduced crop yields contribute to food insecurity and poverty, while agricultural economic losses undermine national development [3, 5]. Furthermore, human activities like deforestation and industrialization exacerbate Indonesia’s vulnerabilities to climate change [6, 7].
Indonesia has implemented comprehensive adaptation strategies in response to these challenges, including developing National Adaptation Plans (NAPs). These plans emphasize climate-smart agricultural practices, such as adopting resilient crop varieties, improved water management, and sustainable farming techniques [8, 9]. Java Island, the country’s most populous and agriculturally significant region, provides a critical example of the challenges climate change poses to rice production. The island’s tropical monsoon climate, fertile volcanic soils, and diverse topography have long supported traditional and improved rice varieties [3, 10]. However, shifting rainfall patterns, rising temperatures, and increasing salinity in coastal agricultural lands due to sea-level rise threaten this agricultural landscape [11, 12]. Amidst the threat of global climate change, understanding how climate factors influence rice production spatially and temporally is very important, especially for formulating region-based adaptation strategies. Additionally, understanding climate variations is critical for the long-term sustainability of the agricultural sector and ensuring sufficient food supplies for a growing population [13]. So far, adaptation policies are often generic and do not consider local variations in the response of agricultural systems to climate change. Therefore, assessing regional variability in the impact of temperature and rainfall on rice production is not only scientifically important but is also practically relevant for planning agricultural policies and food security that are more adaptive and responsive to changing climate dynamics. Previous studies have proven that climate change, especially increasing temperatures and fluctuations in rainfall, has a real impact on the productivity of food crops, including rice. Studies such as research [14-17] show that global climate change has hampered the growth of rice productivity in various parts of the world.
Despite the growing body of literature examining the impact of climate change on agriculture, particularly rice production, there remains a lack of comprehensive studies that analyse the spatial and temporal variability of climatic factors, especially at the regional level. Most studies have focused on the global or national scale, often overlooking the diverse impacts of climate change on different regions within a country like Indonesia. Additionally, previous research has failed to employ long-term time-series data (spanning multiple decades) to assess how regional climate factors—such as precipitation, maximum temperature, and minimum temperature—interact to influence rice yields across distinct districts in Java.
This study, with its comprehensive 30-year dataset (1994-2023), aims to fill this gap and provide a thorough understanding of the nuanced climatic influences on rice production in Java’s key rice-producing districts. This study is novel in its empirical approach, as it uses a comprehensive, 30-year time-series dataset to explore the regional disparities in climate-rice dynamics in Java, Indonesia. Unlike most previous studies that analyse climate impacts at a national level, the findings of this research provide location-specific insights, which are crucial for developing tailored climate adaptation strategies. Strategies inform agricultural policy and climate adaptation strategies significantly. Understanding the specific climatic factors that most affect rice yields in each district will allow for the development of region-specific policies that can effectively mitigate the adverse effects of climate change on rice production, thereby safeguarding food security and rural livelihoods in Indonesia.
This study specifically focuses on the role of climatic factors in determining rice productivity, while deliberately excluding non-climatic influences such as the adoption of agricultural technologies, the use of improved crop varieties, input-related policies, and infrastructure development. Many previous studies have combined both climatic and non-climatic variables within a single analytical framework without first isolating long-term trends attributed to non-climatic factors. This approach may introduce bias in estimating the true effects of climate, as year-to-year yield improvements are often driven by technological progress and human interventions [16-18]. Therefore, applying a detrending method is essential to remove non-climatic trends from yield data, allowing a more accurate assessment of the relationship between climate variability and crop performance—without the confounding influence of ongoing technological advancements.
The objective of this study is to investigate the relationship between climatic factors—precipitation, maximum temperature, and minimum temperature—and rice yields across six key rice-producing districts in Java: Karawang, Indramayu, Cilacap, Grobogan, Ngawi, and Lamongan Districts. This research hypothesizes that precipitation will emerge as the most significant climatic factor influencing rice yields in these regions, with temperature variables exhibiting varying impacts depending on the district. The study also aims to assess the spatial heterogeneity of these relationships and provide insights into how different regions experience and adapt to climate variability.
2.1 Study area
Roughly 50 to 55 percent of Indonesian rice production is obtained from Java Island, while Sumatra and Sulawesi account for approximately 20 and 12 percent, respectively [19]. Cilacap and Grobogan districts in Central Java province, as well as Ngawi and Lamongan districts in East Java province. These regions face several challenges, including environmental risks, unpredictable climate patterns, and extreme weather events that have reduced yields and caused crop failures. The climate in Java, Indonesia, significantly impacts rice cultivation systems, influencing productivity and sustainability. Rainfall is a critical factor for rice cultivation.
In West Java, increased rainfall has been negatively correlated with rice production due to flooding [20, 21]. Conversely, delayed rainfall, often associated with El Niño events, can delay planting and reduce yields [22]. High temperatures can have positive and negative effects. A 1℃ increase in maximum temperature in West Java and East Java can initially boost yields, but temperatures above 33℃ can harm rice crops [23]. The monsoon cycle and irrigation systems heavily influence Java’s rice cultivation, giving rise to distinct growing seasons. The Wet Season (November to April) relies on natural rainfall and is the primary planting and harvesting period. The dry season (May to October), by contrast, depends on irrigation systems, with some highly irrigated areas attempting a rare third crop cycle between August and December. Despite its potential, this third cycle remains limited due to water constraints. Figure 1 shows the study location of the rice production hubs in Java, Indonesia. Karawang and Indramayu districts in West Java province.
Figure 1. Study locations in six districts on the island of Java
2.2 Data collection
Since climate plays a vital role in rice production [24], following previous studies [24-26], we utilize three major climate variables, namely rainfall, maximum temperature, and minimum temperature, to decipher the extent of climatic variability on rice yield across space and time. The study uses three time series datasets. First, daily rainfall data were collected from six central rice-producing districts in Indonesia from 1994 to 2023, as illustrated in Figure 1. These data were obtained from the Climate Hazards Group InfraRed Precipitation with Station data (CHIRPS), which provides high-resolution global rainfall datasets at a spatial resolution of 0.05° (approximately 5.5 km). Second, monthly maximum and minimum air temperature data for the same period were sourced from the NASA POWER Data Access Viewer, with a spatial resolution of 0.5° (approximately 55 km). To derive district-level climate variables, a representative geographic coordinate was selected for each district—typically near the centroid or within a key rice-growing area. This coordinate-based extraction approach, though not fully capturing intra-district spatial heterogeneity, offers a consistent and practical method for long-term time series analysis. While the spatial resolutions of CHIRPS and NASA POWER data do not precisely align with administrative boundaries, this method is widely accepted in regional-scale agricultural and climate impact studies and provides a reliable approximation of district-level climatic conditions.
Thirdly, rice yield data for each district were acquired from Statistics Indonesia (BPS) as time series data spanning 1994–2023. The yield data were reported in quintals, where one quintal equals 100 kilograms. In Indonesia, the wet season is the most important rice-growing period of the year, supporting both rainfed and irrigated grain farming [19]. We therefore utilise the major rice growing season (November to February) rainfall and temperature variables since rice production is entirely dependent on climatic factors, especially rainfall during this period. For the rainfall variable, we utilise the average monthly total growing season (November to February) rainfall in each district for the period of 1994-2023. For the temperature variables, we utilize the average growing season maximum and minimum temperatures for the same periods. Since rice output in the wet season contributes almost two-thirds of total production in Indonesia, we utilise the average quantity of rice output per hectare for 1994-2023 in each district.
2.3 Data analysis
According to study [24], regression models that utilise historical data on both climate variables and yields provide accurate estimates of the changes in crop yield resulting from climate variability. The distribution of rice harvests that have been transformed into logs in each district follows a normal distribution. The changes in rice yield are assumed to be induced by climatic variations with no concerns for reverse causality. The Ordinary Least Squares (OLS) model was employed to regress the log of the detrended rice yield data on the climate variables, as shown below:
$\log Y_{i t}=\alpha+\beta_1 X_{1 t}+\beta_2 X_{2 t}+\beta_3 X_{3 t}+\varepsilon_t$ (1)
where, $Y_{i t}$ denotes rice yield in quintals per hectare, $X_{1 t}$ represents the minimum temperature, $X_{2 t}$ represents maximum temperature, $X_{3 t}$ represents rainfall, $\varepsilon_t$ is the residual term, $i=1 \ldots, 6$ denotes each district and $t$ is the time period. Eq. (1) was estimated for each of the districts.
3.1 Climate variables and rice yield
Slight to moderate variations are observed in the magnitude of the variables across the six districts, indicating that climatic conditions and rice output were not homogeneous across Java Island. The highest average growing season minimum temperature was observed in the Lamongan district, while the lowest was in the Karawang district. Similarly, the lowest growing season average maximum temperature was also recorded in the Karawang district, whereas the highest was in the Ngawi district. Indramayu district received the highest average monthly total rainfall, while Lamongan district received the least rainfall. For the rice yield variable, Karawang district recorded the highest average rice output per hectare, while Lamongan district recorded the least rice output per hectare. The results of the summary statistics do not provide any evidence of a changing climate over time. To provide empirical evidence of changing climate across the significant rice-producing districts in Java during the 1994-2023 period, we estimated linear trend models for the three climate variables with time as the control variable. The summary statistics of climate variables and rice yield are shown in Table 1.
Table 1. Summary statistics of the climate and rice yield variables for the 1994-2023 period
|
Variable |
Statistic |
Karawang |
Indramayu |
Cilacap |
Grobogan |
Ngawi |
Lamongan |
|
Min. temperature (℃) |
Mean |
21.47 |
23.28 |
21.82 |
23.30 |
21.49 |
24.93 |
|
Std. dev |
0.40 |
0.41 |
0.34 |
0.36 |
0.36 |
0.42 |
|
|
Maximum |
22.47 |
23.99 |
22.55 |
23.99 |
22.26 |
25.93 |
|
|
Minimum |
20.68 |
22.30 |
21.33 |
22.56 |
20.67 |
24.15 |
|
|
Max. temperature (℃) |
Mean |
31.01 |
31.39 |
31.04 |
31.79 |
32.28 |
31.58 |
|
Std. dev. |
0.95 |
0.75 |
0.84 |
1.18 |
1.51 |
0.95 |
|
|
Maximum |
32.99 |
33.12 |
33.26 |
34.24 |
35.36 |
33.69 |
|
|
Minimum |
29.15 |
30.05 |
29.87 |
29.66 |
29.87 |
29.92 |
|
|
Rainfall (mm) |
Mean |
291.13 |
337.62 |
331.40 |
313.44 |
303.79 |
275.45 |
|
Std. dev |
60.87 |
51.94 |
59.92 |
43.78 |
50.77 |
46.57 |
|
|
Maximum |
479.18 |
443.61 |
441.16 |
213.59 |
407.82 |
353.94 |
|
|
Minimum |
187.65 |
237.96 |
202.25 |
398.69 |
199 |
174.81 |
|
|
Rice yield (quintals/ha) |
Mean |
61.93 |
58.53 |
58.80 |
57.71 |
58.35 |
58.82 |
|
Std. dev |
8.41 |
4.19 |
3.83 |
4.93 |
5.23 |
4.54 |
|
|
Maximum |
90.00 |
72.49 |
66.0 |
66.3 |
67 |
66.25 |
|
|
Minimum |
52.10 |
51.30 |
51.30 |
49.30 |
50.50 |
51.0 |
Table 2. Linear trend model for climate variables and rice yield for the 1994-2023 period
|
District |
Variables |
Intercept |
Coefficient |
p-value |
R2 |
|
Karawang |
Min. Temperature |
18.74 |
0.001 |
0.876 |
0.001 |
|
Max. Temperature |
36.48 |
-0.003 |
0.895 |
0.001 |
|
|
Rainfall |
-1679.91 |
0.981 |
0.454 |
0.020 |
|
|
Rice yield |
-838.13 |
0.448*** |
0.009 |
0.22 |
|
|
Indramayu |
Min. Temperature |
17.65 |
0.002 |
0.751 |
0.004 |
|
Max. Temperature |
33.26 |
-0.001 |
0.954 |
0.001 |
|
|
Rainfall |
-7151.26 |
3.728* |
0.000 |
0.399 |
|
|
Rice yield |
-631.95 |
0.344*** |
0.000 |
0.520 |
|
|
Cilacap |
Min. Temperature |
5.18 |
0.008 |
0.260 |
0.045 |
|
Max. Temperature |
18.19 |
0.006 |
0.726 |
0.004 |
|
|
Rainfall |
-7916.66 |
4.107* |
0.000 |
0.364 |
|
|
Rice yield |
-769.46 |
0.412*** |
0.000 |
0.898 |
|
|
Grobogan |
Min. Temperature |
3.36 |
0.009 |
0.202 |
0.057 |
|
Max. Temperature |
35.75 |
-0.002 |
0.939 |
0.000 |
|
|
Rainfall |
-5323.76 |
2.807* |
0.001 |
0.319 |
|
|
Rice yield |
-1036.09 |
0.545*** |
0.000 |
0.946 |
|
|
Ngawi |
Min. Temperature |
9.24 |
0.006 |
0.471 |
0.019 |
|
Max. Temperature |
68.52 |
-0.018 |
0.580 |
0.011 |
|
|
Rainfall |
-5955.09 |
3.116* |
0.002 |
0.292 |
|
|
Rice yield |
-1109.71 |
0.582*** |
0.000 |
0.959 |
|
|
Lamongan |
Min. Temperature |
.97 |
.012 |
0.184 |
0.062 |
|
Max. Temperature |
39.99 |
-.004 |
0.838 |
0.002 |
|
|
Rainfall |
-4124.64 |
2.191* |
0.023 |
0.172 |
|
|
Rice yield |
-959.24 |
0.507*** |
0.000 |
0.966 |
Note: *** denotes statistical significance at 1% and * denotes statistical significance at 10%.
The results of the linear trend model in Table 2 show that no significant trend existed for the maximum and minimum temperature variables within the period of 1994-2023 in the six districts. These results show a different trend from the study [23] in Thailand, which showed an increase in average temperature over a period of 47 years, while the study in Vietnam indicated more location-specific climate variability over 27 years [27].
Nevertheless, a negligibly positive trend was observed for precipitation across all the districts except for Karawang, implying that over time, rainfall increased slightly in five of the six districts. Conversely, the result of the trend analysis was markedly different for the rice yield variable. A highly significant positive trend was found to exist between rice yield and time across all the districts. Improvements in crop yield since the advent of the Asian green revolution have stemmed largely from technological advancements in production inputs. Hence, the effect of climate change may be difficult to discern from the raw rice productivity data. Therefore, there is a need to remove any underlying yield trend caused by non-climate factors such as improved rice varieties, fertilizers, pesticides, irrigation, and other improved management practices. Following studies [28, 29], we address this concern by detrending the rice productivity data for the six districts using the linear regression method, thus leaving behind the sub-trends that are seasonal or cyclical. The distribution of rice harvests in Karawang, Indramayu, Cilacap, Ngawi, Lamongan, and Grobogan can be seen in Figure 2.
Figure 2. Distribution of rice yield in (a) Karawang, (b) Indramayu, (c) Cilacap, (d) Ngawi, (e) Lamongan, and (f) Grobogan
Since the dataset in the study contains about 30 years of observation and increasing trends for some variables like rice yield and rainfall, the time series may not have a constant mean and variance. Thus, the primary assumption of time series, which is stationarity, may be absent. The analysis of non-stationary data cannot provide satisfactory findings for regression analysis of time-series data. Following the study [22], amongst others, the Augmented Dickey-Fuller (ADF) test was performed to assess the unit roots in the climate variables.
The result of the ADF test in Table 3 showed that all the climate variables in the six districts were stationary at levels 1(0) as shown by the magnitude and significance of the Z(t) and Mackinnon p-value for Z(t), respectively. Hence, we reject the implied null hypothesis that the climate variables in the time series dataset are non-stationary. They can therefore be used for subsequent analyses. However, for the detrended rice productivity data, the results of the ADF test showed that this variable was non-stationary at levels in the six districts. Hence, they were further log-transformed to stabilize the variance and convert absolute differences to relative differences, to isolate the stationarity component of the data for further analyses. The results of the subsequent ADF test showed that the detrended log-transformed productivity data in the six districts were stationary and can thus be used for further analyses. The distribution of the log-transformed, detrended rice yields in each district follows a normal distribution, as shown in Figure 2.
Table 3. The ADF test for determining the stationarity of the data series
|
Variables |
Karawang |
Indramayu |
Cilacap |
Grobogan |
Ngawi |
Lamongan |
|
Rice yield |
1(1) |
1(1) |
1(1) |
1(1) |
1(1) |
1(1) |
|
Min. Temp. |
1(0) |
1(0) |
1(0) |
1(0) |
1(0) |
1(0) |
|
Max. Temp. |
1(0) |
1(0) |
1(0) |
1(0) |
1(0) |
1(0) |
|
Rainfall |
1(0) |
1(0) |
1(0) |
1(0) |
1(0) |
1(0) |
Note: 1(0) denotes stationarity at levels and 1(1) denotes stationarity after log transformation.
3.2 The influence of climatic factors on rice yields
The OLS models for the various districts save for Karawang are statistically significant, as shown by the probability value of joint significance of the minimum temperature, maximum temperature, and rainfall variables. These climatic factors explain about 26 to 52 percent of the variation in rice yield across the districts where the OLS models are statistically significant. The values of the Variance Inflation Factor (VIF) reveal the absence of multicollinearity among the climatic variables, and the statistical insignificance of the probability of the White’s chi-squared values at 1% and 5% is an indication that the problem of heteroscedasticity is absent in the estimated OLS models. The results in Table 4 show the OLS estimates of the effect of climatic factors on rice productivity in six different districts in Java, Indonesia.
Table 4. OLS estimates of the effect of climatic factors on rice yield across major rice production districts in Java
|
Climate Variables |
Karawang |
Indramayu |
Cilacap |
Grobogan |
Ngawi |
Lamongan |
|
Minimum temperature |
0.0278 (0.0417) |
-0.0272 (0.0275) |
0.0148 (0.0283) |
0.0508 (0.0421) |
0.0262 (0.0443) |
0.088** (0.0411) |
|
Maximum temperature |
-0.0033 (0.0160) |
0.0287* (0.0160) |
0.0290** (0.0130) |
0.0128 (0.0145) |
0.0151 (0.0142) |
-0.0071 (0.0207) |
|
Rainfall |
0.0002 (0.0002) |
0.0008*** (0.0002) |
0.0008*** (0.0002) |
0.0013*** (0.0003) |
0.0012*** (0.0004) |
0.0009** (0.0003) |
|
Constant |
3.5594*** (0.8031) |
3.5434*** (0.4303) |
2.5776*** (0.5544) |
2.0591** (0.8138) |
2.6373*** (0.7861) |
1.8659** (0.7912) |
|
F (3,26) |
0.36 |
7.63 |
9.46 |
6.55 |
5.01 |
4.40 |
|
Prob > F |
0.78 |
0.00 |
0.00 |
0.00 |
0.01 |
0.01 |
|
Adjusted R2 |
-0.07 |
0.41 |
0.52 |
0.36 |
0.30 |
0.26 |
|
VIF |
1.59 |
2.60 |
1.70 |
1.94 |
1.90 |
2.03 |
|
White’s test chi2 |
7.90 |
16.64 |
11.03 |
7.42 |
6.50 |
15.07 |
|
Prob > chi2 |
0.54 |
0.05 |
0.27 |
0.60 |
0.69 |
0.09 |
Note: The figures in parentheses are the standard errors. *** denotes statistical significance at 1%, ** denotes statistical significance at 5% and * denotes statistical significance at 10%.
The results in Table 4 show that climatic factors have varying effects on rice yield in the six major rice-producing districts in Java. To further illustrate the magnitude and statistical significance of each climatic variable on rice yield across districts, Figure 3 presents the standardized coefficients from the regression models.
This bar chart illustrates the comparative magnitude and significance of climate variables in determining rice yield across districts. Rainfall exhibits a statistically significant and consistently positive influence on rice yield in all districts except Karawang. The strongest effects of rainfall are observed in Grobogan and Ngawi, aligning with their lower baseline yields and rainfall dependency. Maximum temperature (Tmax) significantly improves yield in Indramayu and Cilacap, possibly reflecting adaptation to lower baseline Tmax in these regions. Meanwhile, minimum temperature (Tmin) positively affects yield only in Lamongan, suggesting thermal stress thresholds may vary spatially due to microclimatic or varietal differences. Karawang remains an outlier, showing no significant climatic effects, likely due to robust irrigation systems buffering against climate variability. These findings reinforce the argument for region-specific adaptation strategies in climate-resilient rice cultivation.
To better understand the variation in rice yields across districts—particularly the high productivity observed in Karawang, despite the lack of statistically significant climatic effects—we examined the extent of irrigated rice fields and the reliability of supporting infrastructure. Table 5 presents the irrigated rice area across the six study districts, where Karawang ranks second after Indramayu. Yet, Karawang consistently records the highest average rice yield, indicating that irrigation coverage alone does not fully explain productivity outcomes.
Figure 3. Standardized coefficients (β) from OLS regression showing the impact of minimum temperature, maximum temperature, and rainfall on rice yield across six rice-producing districts in Java (1994-2023)
Significance levels: p < 0.10 (*), p < 0.05 (**), p < 0.01 (***).
Table 5. Irrigated rice area across the six study districts in Java, Indonesia
|
District |
Irrigated Area (ha) |
Rank |
|
Indramayu |
95.159 |
1 |
|
Karawang |
91.040 |
2 |
|
Lamongan |
50.112 |
3 |
|
Cilacap |
47.130 |
4 |
|
Ngawi |
44.237 |
5 |
|
Grobogan |
33.669 |
6 |
Source: Ministry of Agriculture, Republic of Indonesia.
A more plausible explanation lies in Karawang's superior water infrastructure, particularly the Walahar Dam, which supports the Tarum Barat irrigation system. According to study [30], Walahar Reservoir functions as a crucial raw water source for agriculture and domestic use in Karawang and surrounding regions. The dam has been equipped with an IoT-based water quality monitoring system, ensuring real-time control of water safety and availability. This technology integration enables stable, efficient, and responsive water management that directly benefits agricultural systems.
The presence of this modern infrastructure, along with stable and predictable irrigation even during climatic irregularities, may explain why Karawang's rice yield remains high and statistically climate-resilient. Hence, the quality and reliability of water delivery systems, rather than their sheer spatial extent, are more critical in sustaining agricultural productivity under changing climate conditions.
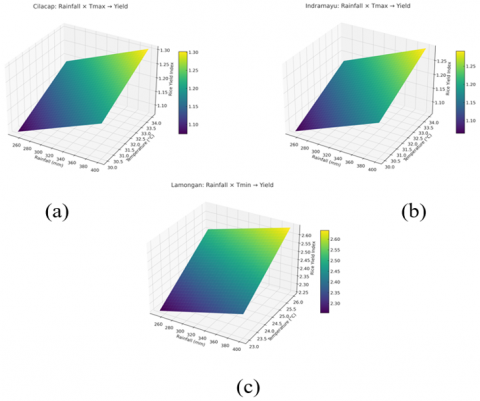
While the standardized coefficients presented earlier summarize the individual effects of each climatic variable on rice yield, they do not fully capture the potential interactions between these variables. To explore how combinations of temperature and rainfall may jointly influence yield outcomes, we constructed three-dimensional response surface plots for districts where two climate variables were found to be statistically significant. This approach allows for a more nuanced understanding of climate-yield dynamics, particularly under varying environmental conditions. Figure 4 illustrates the first of these visualizations, focusing on Indramayu District, where both rainfall and maximum temperature were positively associated with rice yield.
Figure 4. Three-dimensional response surface plots showing the interaction between rainfall and temperature on rice yield in selected districts: (a) Cilacap: rainfall × Tmax; (b) Indramayu: rainfall × Tmax; and (c) Lamongan: rainfall × Tmin
Figure 4 illustrates the interactive effects of climatic factors on rice yield through three-dimensional response surface plots. These visualizations depict how different combinations of rainfall and temperature influence yield outcomes in Cilacap, Indramayu, and Lamongan—districts where two climate variables were statistically significant. In Figure 4(a), the yield response surface for Cilacap reveals a consistent upward slope with increasing rainfall and maximum temperature (Tmax). The smooth, planar surface suggests a near-linear and additive interaction between the two variables. This indicates that higher rainfall (from 260mm to 400mm) combined with warmer Tmax (30℃ to 34℃) enhances rice productivity, suggesting that this district benefits from slightly warmer and wetter conditions. In line with studies [18, 31], higher Tmax and rainfall have a major impact on rice yield, especially during particular growing seasons. For example, rainfall affects all rice cropping seasons, including Aus, Aman, and Boro, while Tmax influences the Aus and Aman rice crops.
Similarly, Figure 4(b) for Indramayu displays a parallel trend, where rice yield increases with both rainfall and Tmax. Although the magnitude of increase is slightly lower than Cilacap, the shape of the surface indicates a synergistic effect—higher rainfall appears to amplify the positive effect of Tmax on yield. This may reflect local adaptation to moderately warm conditions with adequate moisture availability.
In contrast, Figure 4(c) shows the response surface for Lamongan, where rainfall and minimum temperature (Tmin) jointly influence yield. Here, the yield index increases sharply as Tmin rises from 23.0℃ to 26.0℃, especially when rainfall exceeds 300 mm. This steep incline suggests a strong dependency on nighttime temperature, likely due to its role in preventing cold-induced sterility during flowering. The interaction appears more convex, implying a non-linear boost in yield under warm, humid conditions. Overall, these visualizations confirm that climate-yield relationships are both spatially and interactively complex. While higher Tmax benefits rice production in some regions, Tmin plays a more dominant role in others. Rainfall remains a key amplifier of temperature effects across all districts.
Although Lamongan had the lowest growing season average minimum temperature, maximum temperature, and rainfall relative to other districts, it, however, recorded the highest rice output per hectare. Minimum temperature significantly improves rice yield in the Lamongan district but not in the other four districts. This result is similar to studies [32], which found that rice yield is significantly enhanced by minimum temperature. Rice yield in the southeastern United States was shown to rise by 22.40% with a 1℃ increase in Tmin [33]. Incidentally, the Lamongan district has the highest average minimum growing season temperature of approximately 24.90℃ relative to the four other districts. Higher minimum temperatures in Lamongan have a large production boost, which is probably due to favorable agroecological circumstances, adaptable local practices, and overnight temperatures that correspond with the physiological optimum for rice. According to research [18], raising the nighttime temperature above about 27℃ decreases grain weight per panicle, indicating that ideal nighttime temperatures of 24 to 25℃ are essential for preserving spikelet fertility and rice reproductive development in general. Above 25℃, high night temperatures can negatively impact rice growth phases by increasing spikelet sterility and decreasing biomass, grain development, and seed germination [34]. Thus, suggesting that temperature values below 24.90℃ could have a net zero or detrimental effect on rice yields in Java.
Decreasing minimum temperatures generally has a negative impact on rice yields. Study [35] found that grain yield declined by 10% for each 1℃ decrease in growing-season minimum temperature during the dry season. Similarly, study [36] reported that lower minimum temperatures during the grain-filling phase significantly reduced grain yield and quality, affecting parameters such as chalkiness, starch content, and mineral nutrient composition. Average growing season maximum temperature, on the other hand, significantly improved rice yield in Indramayu and Cilacap districts only, with a stronger and more reliable influence in Cilacap district. Akin to the earlier observation for Lamongan district, Cilacap district has the lowest average growing season maximum temperatures relative to the other four districts. Thus, it suggests that growing season maximum temperature values exceeding 31.10℃ could have a net zero or detrimental effect on the yield of rice in Java. Increased maximum temperatures generally lead to a decline in rice yield. For instance, a 1℃ rise in temperature can reduce irrigated rice yield by 6.6% to 11.1% and rainfed rice yields by 4.6% to 9.4% [36]. Similarly, study [37] asserted that grain yield decreased by 38.3% to 54.5% with a temperature increase of 4.5℃ to 5.8℃ from ambient levels. Average growing season monthly total rainfall significantly improved rice yields across the five districts where the OLS model was significant.
The regression results show that rainfall significantly affects rice yields in five out of six districts (p < 0.05). Specifically, a 1mm increase in rainfall during the growing season is associated with an estimated yield increase of 0.08% in Indramayu and Cilacap, 0.09% in Lamongan, 0.12% in Ngawi, and 0.13% in Grobogan. These coefficients are statistically significant at the 1-5% level. In Karawang, however, the rainfall coefficient was positive but not statistically significant, suggesting that rainfall variability may play a lesser role in yield variation, possibly due to stable irrigation systems.
However, the strongest effects were observed for Grobogan and Ngawi districts, which received a moderate amount of rainfall relative to other districts. Incidentally, these two districts have the lowest rice yield and are not significantly impacted by growing season maximum and minimum temperatures, thus highlighting the critical role of increasing rainfall in determining the outcome of rice yield. Although increasing rainfall significantly improved rice yield in all the regions except Karawang, the improvements in rice yield occasioned by rising minimum and maximum temperatures are of greater magnitude. Rice yields in Indramayu, Cilacap, and Lamongan districts are more susceptible to the influence of climate variability than rice yields in Grobogan and Ngawi districts. Grobogan and Ngawi are experiencing significant temperature increases and variable rainfall patterns. By 2010, maximum and minimum temperatures are projected to rise by 3.5% and 4.9%, respectively, with even greater increases expected by 2050. This warming trend may shorten rice growing periods and reduce yields [38]. Additionally, the combination of higher temperatures and drought conditions could lead to an estimated annual decline of approximately 1% in rice yields across East Java, including the Ngawi district [23]. Rice yield in the Karawang district is not significantly affected by climate variability from rainfall and temperature. However, the overall increase in rainfall during the growing season in most districts, except for Karawang, has serious implications for rice production on Java Island. Our findings show how changing climatic factors, particularly rainfall, influence rice yield.
Rainfall is the most important factor affecting rice production across major rice-growing districts in Java, with a significant impact in five out of six districts. In some cases, increased rainfall has been positively correlated with higher rice output. A 10% increase in rainfall can lead to a 0.4% increase in rice output, indicating that adequate rainfall is crucial for optimal rice production [35]. Moreover, while some climatic factors greatly affect rice yield in certain districts, they have no impact in others. Therefore, policies aimed at mitigating the negative effects of climate change on crop yields in Java or Indonesia should be tailored to specific regions, as climatic influences vary across different areas. These results are similar to the study in Vietnam, which showed that the impact of climate variability on crop yield varied among crops as well as provinces, with rainfall being the most critical factor, especially in water-limited regions [27]. Meanwhile, in the Northeast of Thailand, rice yield is primarily influenced by minimum seasonal temperatures, which have a positive correlation, while rainfall shows inconsistent effects. Additionally, non-climatic factors such as improved farm management practices, seed quality, and fertilizer use play a substantial role in determining rice yields [23].
Although this study did not explicitly include interaction terms between temperature and precipitation in the regression models, we acknowledge that such interactions may significantly affect rice yield outcomes under varying climate conditions. Real-world climatic events often co-occur, where high temperatures combined with low rainfall can lead to compounded stress, which may not be fully captured by additive models. Studies such as study [39] have shown that during critical stages of rice growth, particularly during the reproductive phase (flowering and grain filling), high temperatures can exacerbate the impact of drought stress, leading to spikelet sterility, reduced grain filling, and ultimately lower yields. Similarly, study [40] emphasizes that the combination of temperature and precipitation influences rice yield and physiological responses, with low rainfall significantly reducing nitrogen use efficiency and further intensifying the effects of heat.
In our study, Figure 4 implicitly visualizes how combinations of temperature (Tmax or Tmin) and rainfall interact to affect rice yields across districts. Although our analysis focuses on additive effects for model simplicity, we recognize this as a limitation. Future research could address this by incorporating interaction terms or adopting nonlinear models, such as generalized additive models (GAMs), to better capture the complex climate-yield dynamics in tropical monsoon regions like Java.
This study presents a rigorous empirical investigation into the spatial heterogeneity of climatic impacts on rice production in six key rice-producing districts of Java, Indonesia, spanning a comprehensive 30-year period from 1994 to 2023. Through the application of Ordinary Least Squares regression on detrended rice yield data, the analysis elucidates distinct regional patterns in the influence of critical climatic variables—precipitation, maximum temperature (Tmax), and minimum temperature (Tmin)—on rice yields.
The empirical findings demonstrate that precipitation emerges as the predominant climatic factor exerting a statistically significant positive effect on rice yields across five of the six districts analyzed. This reinforces the fundamental role of adequate and timely rainfall during the wet-season growing period for optimal rice productivity. Conversely, temperature variables exhibit marked spatial variability in their impacts. Higher minimum temperatures are associated with increased rice yields in Lamongan district, suggesting a threshold effect where warmer nights may enhance growth conditions. In contrast, elevated maximum temperatures are linked to reductions in rice yields in Indramayu and Cilacap districts, indicating potential heat stress effects detrimental to crop development. Intriguingly, the Karawang district exhibits a climate-resilient yield profile, with no significant effects attributable to the climatic variables considered, possibly reflecting mitigation through advanced irrigation infrastructure or other agronomic factors.
Building upon these empirical insights, inferred adaptation strategies can be proposed to enhance the resilience of rice production systems under ongoing climate change. In districts where precipitation is a limiting factor, there is a strong rationale for prioritizing investments in irrigation infrastructure, water resource management, and rainwater harvesting technologies to buffer against rainfall variability and water scarcity. Conversely, in regions exhibiting sensitivity to temperature extremes—particularly elevated maximum temperatures—the promotion of heat-tolerant rice cultivars and breeding programs may be critical to sustaining yields. These region-specific approaches underscore the importance of moving beyond uniform, one-size-fits-all adaptation policies toward targeted interventions responsive to localized climate-yield interactions.
Nevertheless, it is imperative to underscore that these recommended policy directions are inferred from the identified climatic relationships and do not represent direct empirical results of this study. Moreover, the analysis does not explicitly control for or incorporate non-climatic factors known to influence rice productivity, such as soil quality degradation, shifts in cropping patterns, pest and disease pressures, technological advancements, or socio-economic dynamics. The omission of these confounding variables potentially limits the attribution of observed yield variations solely to climatic factors and warrants caution in interpreting causal linkages. Consequently, future research efforts should adopt integrated modeling frameworks that incorporate both climatic and non-climatic determinants to holistically assess the drivers of rice yield variability and formulate more robust, evidence-based climate adaptation policies.
In sum, this study enriches the understanding of climate-rice dynamics in Java by providing nuanced, district-level empirical evidence on the differential effects of precipitation and temperature on rice yields. It lays the groundwork for the design of more precise and effective climate adaptation strategies that are tailored to the specific vulnerabilities and adaptive capacities of distinct agricultural landscapes, thereby contributing to sustainable rice production, enhanced food security, and rural livelihood resilience in the face of climate change.
[1] Nagai, T., Makino, A. (2009). Differences between rice and wheat in temperature responses of photosynthesis and plant growth. Plant and Cell Physiology, 50(4): 744-755. https://doi.org/10.1093/pcp/pcp029
[2] Fitriani, F. (2017). Climate changing impact on rice production. Journal of Food System and Agribusiness, 1(1): 41-46. https://doi.org/10.25181/jofsa.v1i1.82
[3] Eka Suranny, L., Gravitiani, E., Rahardjo, M. (2022). Impact of climate change on the agriculture sector and its adaptation strategies. IOP Conference Series: Earth and Environmental Science, 1016(1): 012038. https://doi.org/10.1088/1755-1315/1016/1/012038
[4] Ansari, A., Lin, Y.P., Lur, H.S. (2021). Evaluating and adapting climate change impacts on rice production in Indonesia: A case study of the Keduang Subwatershed, Central Java. Environments, 8(11): 117. https://doi.org/10.3390/environments8110117
[5] Sarvina, Y., June, T., Sutjahjo, S.H., Nurmalina, R., Surmaini, E. (2021). The impacts of climate variability on coffee yield in five Indonesian coffee production centers. Coffee Science, 16: e161917. https://doi.org/10.25186/.v16i.1917
[6] Purba, S.F., Yulianti, A., Astana, S., Djaenudin, R. D., Hariyadi, H., Simandjorang, B.M.T.V., Haradongan, F., Istriningsih, I. (2023). The contribution of agricultural crop production towards the economic growth of Indonesia’s agricultural sector. In E3S Web of Conferences. EDP Sciences, 444: 02034. https://doi.org/10.1051/e3sconf/202344402034
[7] Gunawan, Y., Arumbinang, M.H. (2023). The climate change litigation based human rights approach in corporations: Prospects and challenges. Journal of Human Rights, Culture and Legal System, 3(2): 288-307. https://doi.org/10.53955/jhcls.v3i2.116
[8] Kilmanun, J.C., Prahardini, P.E.R., Anita, S., Sutoto, A., Prabowo, J., Saptana, S., Wahyono, E., Putri, R.L. (2023). Forecast based financing for precision agriculture in Indonesia. BIO Web of Conferences, 69: 04021. https://doi.org/10.1051/bioconf/20236904021
[9] Purba, S.F., Djaenudin, D., Astana, S., Hariyadi, H., Yulianti, A., Yuniati, D., Budiningsih, K., Sari, U.K. (2023). The impact of oil palm and paddy production on greenhouse gas (GHG) emissions in Indonesia’s agricultural sector. In IOP Conference Series: Earth and Environmental Science. IOP Publishing, 1266(1): 012042. https://doi.org/10.1088/1755-1315/1266/1/012042
[10] Rondhi, M., Suwandari, A., Asrofi, A., Khasan, A. F., Mori, Y., Kondo, T. (2020). Improving the efficacy of climate policy in the Indonesian rice sector: The potential use of perceived-impact measures in targeting policy beneficiaries. In Recent Advances in Rice Research. IntechOpen. https://doi.org/10.5772/intechopen.94004
[11] Daris, E., Aminudin, I., Feriansyah, A. (2017). Determinants of paddy fields conversion in Java Island, Indonesia. In International Conference on Science and Technology (ICOSAT 2017)-Promoting Sustainable Agriculture, Food Security, Energy, and Environment Through Science and Technology for Development. Atlantis Press, pp. 95-98. https://doi.org/10.2991/icosat-17.2018.22
[12] Aprilina, K., Sopaheluwakan, A., Susandi, A., Hadi, T.W., Trilaksono, N.J., Lubis, A., Dayantolis, W., Permana, D.S., Nuryanto, D.E., Anggraeni, R., Komalasari, K.E., Fajariana, Y., Yuliyanti, M.S., Haryoko, U., Hidayanto, N., Linarka, U.A. (2023). The comparison of relationship between climate variables and rice productivity in the clustering area on Java Island, Indonesia. IOP Conference Series: Earth and Environmental Science, 1167(1): 012016. https://doi.org/10.1088/1755-1315/1167/1/012016
[13] Safitri, H., Purwoko, B.S., Dewi, I.S., Ardie, S.W. (2018). Salinity tolerance of several rice genotypes at seedling stage. Indonesian Journal of Agricultural Science, 18(2): 63-68. https://doi.org/10.21082/ijas.v18n2.2017.p63-68
[14] Li, S., Wang, Q., Chun, J.A. (2017). Impact assessment of climate change on rice productivity in the Indochinese peninsula using a regional‐scale crop model. International Journal of Climatology, 37: 1147-1160. https://doi.org/10.1002/joc.5072
[15] Zhao, C., Liu, B., Piao, S., Wang, X., et al. (2017). Temperature increase reduces global yields of major crops in four independent estimates. In Proceedings of the National Academy of Sciences, 114(35): 9326-9331. https://doi.org/10.1073/pnas.1701762114
[16] Ray, D.K., Gerber, J.S., MacDonald, G.K., West, P.C. (2015). Climate variation explains a third of global crop yield variability. Nature Communications, 6(1): 5989. https://doi.org/10.1038/ncomms6989
[17] Anderson, R., Bayer, P.E., Edwards, D. (2020). Climate change and the need for agricultural adaptation. Current Opinion in Plant Biology, 56: 197-202. https://doi.org/10.1016/j.pbi.2019.12.006
[18] Al Mamun, M.A., Nihad, S.A.I., Sarkar, M.A.R., Sarker, M.R., Skalicka, J., Skalicky, M. (2023). Spatio-temporal variability of climatic variables and its impacts on rice yield in Bangladesh. Frontiers in Sustainable Food Systems, 7: 1290055. https://doi.org/10.3389/fsufs.2023.1290055
[19] United States Department of Agriculture (USDA). Indonesia rice area, yield and production. https://ipad.fas.usda.gov/countrysummary/Default.aspx?id=ID&crop=Rice.
[20] Lobell, D.B., Field, C.B. (2007). Global scale climate-crop yield relationships and the impacts of recent warming. Environmental Research Letters, 2(1): 014002. https://doi.org/10.1088/1748-9326/2/1/014002
[21] Jamil, A., Chairunnisya, R.A. (2023). Building resilience: Addressing climate change impacts on rice production based on agricultural infrastructure in West Java Province, Indonesia. E3S Web of Conferences, 425: 05001. https://doi.org/10.1051/e3sconf/202342505001
[22] Khairullah, I., Alwi, M., Annisa, W. (2021). The fluctuation of rice production of tidal swampland on climate change condition (Case of South Kalimantan province in Indonesia). IOP Conference Series: Earth and Environmental Science, 724(1): 012009. https://doi.org/10.1088/1755-1315/724/1/012009
[23] Ansari, A., Pranesti, A., Telaumbanua, M., Alam, T., Wulandari, R.A., Nugroho, B.D.A. (2023). Evaluating the effect of climate change on rice production in Indonesia using multimodelling approach. Heliyon, 9(9): e19639. https://doi.org/10.1016/j.heliyon.2023.e19639
[24] Sarker, J.R., Mian, M.R.U, Roy, S.S. (2012). Farmers’ perception about causes and remedies of Monga in Hatibandha Upazila of Lalmonirhat district. Journal of the Bangladesh Agricultural University, 10(1): 107-118. https://doi.org/10.3329/jbau.v10i1.12101
[25] Saud, S., Wang, D., Fahad, S., Alharby, H.F., Bamagoos, A.A., Mjrashi, A., Alabdallah, N.M., AlZahran, S.S., AbdElgawad, H., Adnan, M., Sayyed, R.Z., Ali, S., Hassan, S. (2022). Comprehensive impacts of climate change on rice production and adaptive strategies in China. Frontiers in Microbiology, 13: 926059. https://doi.org/10.3389/fmicb.2022.926059
[26] Stuecker, M.F., Tigchelaar, M., Kantar, M.B. (2018). Climate variability impacts on rice production in the Philippines. PloS One, 13(8): e0201426. https://doi.org/10.1371/journal.pone.0201426
[27] Chung, N.T., Jintrawet, A., Promburom, P. (2015). Impacts of seasonal climate variability on rice production in the central highlands of Vietnam. Agriculture and Agricultural Science Procedia, 5: 83-88. https://doi.org/10.1016/j.aaspro.2015.08.012
[28] Hashim, N., Ali, M.M., Mahadi, M.R., Abdullah, A.F., Wayayok, A., Kassim, M.S.M., Jamaluddin, A. (2024). Smart farming for sustainable rice production: An insight into application, challenge, and future prospect. Rice Science, 31(1): 47-61. https://doi.org/10.1016/j.rsci.2023.08.004
[29] Santosa, Y.T., Kurniasih, B., Alam, T., Handayani, S., Supriyanta, Ansari, A., Taryono. (2024). Investigating the dynamics of upland rice (Oryza sativa L.) in rainfed agroecosystems: An in-depth analysis of yield gap and strategic exploration for enhanced production. Frontiers in Sustainable Food Systems, 8: 1384530. https://doi.org/10.3389/fsufs.2024.1384530
[30] Ma'ruf, K., Setiawan, R.J., Alam, A.A.K., Ismail, T., Muhammad, C.I., Ali, J. (2024). Internet of things for real-time monitoring of water quality with integrated temperature, pH, and TDS sensors. In 2024 International Conference on Electrical Engineering and Computer Science (ICECOS), Palembang, Indonesia, IEEE, pp. 314-319. https://ieeexplore.ieee.org/document/10791209
[31] Alam, E., Hridoy, A.E.E., Tusher, S.M.S.H., Islam, A.R.M.T., Islam, M.K. (2023). Climate change in Bangladesh: Temperature and rainfall climatology of Bangladesh for 1949-2013 and its implication on rice yield. PloS One, 18(10): e0292668. https://doi.org/10.1371/journal.pone.0292668
[32] Guntukula, R., Goyari, P. (2020). Climate change effects on the crop yield and its variability in Telangana, India. Studies in Microeconomics, 8(1): 119-148. https://doi.org/10.1177/2321022220923197
[33] Sharma, R.K., Kumar, S., Vatta, K., Bheemanahalli, R., Dhillon, J., Reddy, K.N. (2022). Impact of recent climate change on corn, rice, and wheat in southeastern USA. Scientific Reports, 12(1): 16928. https://doi.org/10.1038/s41598-022-21454-3
[34] Bhardwaj, M., Kumar, P., Kumar, S., Dagar, V., Kumar, A. (2022). A district-level analysis for measuring the effects of climate change on production of agricultural crops, ie, wheat and paddy: Evidence from India. Environmental Science and Pollution Research, 29(21): 31861-31885. https://doi.org/10.1007/s11356-021-17994-2
[35] Peng, S., Huang, J., Sheehy, J.E., Laza, R.C., Visperas, R.M., Zhong, X., Centeno, G.S., Khush, G.S., Cassman, K.G. (2004). Rice yields decline with higher night temperature from global warming. In Proceedings of the National Academy of Sciences, 101(27): 9971-9975. https://doi.org/10.1073/pnas.0403720101
[36] Yang, J., Zhang, X., Wang, D., Wu, J., Xu, H., Xiao, Y., Xie, H., Shi, W. (2024). The deterioration of starch physiochemical and minerals in high-quality indica rice under low-temperature stress during grain filling. Frontiers in Plant Science, 14: 1295003. https://doi.org/10.3389/fpls.2023.1295003
[37] Coast, O., Ellis, R.H., Murdoch, A.J., Quiñones, C., Jagadish, K.S. (2014). High night temperature induces contrasting responses for spikelet fertility, spikelet tissue temperature, flowering characteristics and grain quality in rice. Functional Plant Biology, 42(2): 149-161. https://doi.org/10.1071/FP14104
[38] Yuliawan, T., Handoko, I. (2016). The effect of temperature rise to rice crop yield in Indonesia uses Shierary rice model with geographical information system (GIS) feature. Procedia Environmental Sciences, 33: 214-220. https://doi.org/10.1016/j.proenv.2016.03.072
[39] Ma, Y., Sun, M., Liang, X., Zhang, H., Xiang, J., Zhao, L., Fan, X. (2025). Rice yield and nitrogen use efficiency under climate change: Unraveling key drivers with least absolute shrinkage and selection operator regression. Agronomy, 15(3): 677. https://doi.org/10.3390/agronomy15030677
[40] Carrasco, L., Papeş, M., Sheldon, K.S., Giam, X. (2021). Global progress in incorporating climate adaptation into land protection for biodiversity since Aichi targets. Global Change Biology, 27(9): 1788-1801. https://doi.org/10.1111/gcb.15511