Amit Kumar![]() | Sougata Chattopadhyay*
| Sougata Chattopadhyay*![]()
© 2025 The authors. This article is published by IIETA and is licensed under the CC BY 4.0 license (http://creativecommons.org/licenses/by/4.0/).
OPEN ACCESS
This study reports the design, implementation, and performance evaluation of a full-scale hybrid constructed wetland (CW) commissioned by the Yamuna Expressway Industrial Development Authority (YEIDA) in India’s National Capital Region. The CW treats combined domestic and light-industrial wastewater at 5 million litres per day (5 MLD) using five subsurface horizontal-flow cells vegetated with Phragmites australis and Typha, and started up during winter (15℃). Influent quality showed measurable variability during the monitoring period: average of BOD₅: 180 mg/L (range between 160-220 mg/L including episodic shock loads), COD: 500 mg/L (≈450-600 mg/L), total nitrogen: 51.8 ± 5 mg/L, Ammonia-N: 28.6 ± 10 mg/L, Total Phosphorus: 6–8 mg/L, TSS: 400 mg/L, and total coliforms: 4,250 ± 100 MPN/100 mL. Over three months of weekly monitoring, the CW produced consistent effluent quality: mean BOD₅ = 3.9 mg/L, COD = 33.4 mg/L, TSS = 4.9 mg/L, total nitrogen = 4.3 ± 2.15 mg/L, Ammonia-N = 5.0 ± 2.5 mg/L, total phosphorus < 2 mg/L, and total coliforms ≈58 ± 5 MPN/100 mL. These values correspond to removal efficiencies of 97.8% (BOD₅), 93.3% (COD), 98.8% (TSS), 91.69% (total N), 82.5% (Ammonia-N), 75–80% (TP), and 98.6% (total coliforms). To quantify reuse suitability, the Treated Water Reuse Quality Index (RWQI) has been developed. RWQI integrates seven effluent parameters (BOD₅, COD, TSS, Ammonia-N, total phosphorus, total coliforms, and pH) with assigned weights reflecting their relative importance for non-potable reuse (BOD₅: 0.25; COD: 0.15; TSS: 0.20; Ammonia-N: 0.10; TP: 0.10; Total Coliforms: 0.15; pH: 0.05). Each parameter received a sub-index (Qi) on a 0–100 scale by comparing measured values against regulatory reuse benchmarks (CPCB/USEPA) using a linear normalisation between defined ‘acceptable’ and ‘poor’ thresholds; the composite RWQI is the weighted arithmetic mean of the Qi values. Using this method, the CW effluent yielded a final RWQI of 95.15. The numeric microbiological results (total coliforms: 58 MPN/100 mL after UV polishing) and low residual organic and solid concentrations indicate that the effluent meets the commonly applied Indian non-potable reuse limits for applications such as landscape irrigation, industrial cooling, toilet flushing, and irrigation of non-edible/fodder crops. At design flow (5,000 m³/day), the reclaimed water could irrigate an estimated 100–120 ha of non-edible or fodder crops daily and provide a significant, decentralised alternative to freshwater supply in peri-urban settings. These findings support the adoption of hybrid CWs as low-energy, decentralised treatment units and recommend that policymakers explicitly include RWQI-style multi-parameter screening in reuse permitting to streamline safe non-potable reuse decisions.
eco-friendly wastewater treatment, engineered wetlands, environmental impact, irrigation, nutrient uptake, plant-microbe interactions, pollutant removal, water reuse
Wastewater treatment is one of the most urgent environmental challenges in the recent era. Globally, around 359.4 billion cubic meters of wastewater are produced each year, yet only about 52% is adequately treated [1]. In water-scarce regions, untreated discharges harm ecosystems, threaten public health, and reduce the availability of clean water. At the same time, wastewater carries recoverable resources such as nutrients and energy, which, if effectively reclaimed, could contribute significantly to agriculture and power supply [2]. This makes the development of low-energy, resource-oriented treatment approaches an urgent priority.
In India, the problem is even more pressing. More than 60% of urban local bodies do not have adequate sewage treatment infrastructure, and existing centralised sewage treatment plants (STPs) often struggle due to high operating costs, land constraints, and complex maintenance requirements [3]. These issues are especially visible in peri-urban industrial areas where domestic sewage mixes with light industrial wastewater, resulting in highly variable influent quality. Under such conditions, conventional STPs often fail to meet discharge norms, leading to untreated or partially treated wastewater entering rivers and drains. Other research indicates that specific plants can increase the concentration of certain contaminants, like triclosan and triclocarban, showcasing the importance of choosing the right plants for effective pollutant removal [4]. Plants in CWs do more than just remove pollutants. They also improve the health and stability of the ecosystem, enriching the soil and providing habitats for microbes, which are essential for breaking down pollutants and cycling nutrients. It was noted that vegetation improves conditions for microbial communities, enhancing the soil's nutrient retention [5]. Introducing a diverse range of plant species can lead to a more resilient ecosystem, as evidenced by studies on urban CWs that focus on increasing plant diversity to boost ecological stability [6].
Furthermore, the management of plant litter in these systems is essential for maintaining water quality. Pan et al. [7] discussed how submerged plant litter could release nutrients back into the water, sometimes leading to eutrophication if not properly managed. Choosing suitable plant species and managing plant litter carefully are key to optimizing the efficiency of CWs in wastewater treatment [7].
Phragmites australis, known as the common reed, is integral to CW due to its adaptability, high biomass, and pollutant removal effectiveness. It excels in nutrient uptake, particularly nitrogen (N) and phosphorus (P), and supports microbial communities that help decompose organic matter [8]. Its extensive root system not only aids in nutrient absorption but also enhances rhizosphere aeration, crucial for microbial activity and pollutant breakdown. Phragmites also tolerates diverse environmental conditions, making it suitable for various wetland types and enhancing treatment efficiency [8, 9].
However, Phragmites' aggressive growth can lead to monocultures that may displace native plants and reduce biodiversity [10, 11]. Management strategies, such as mechanical harvesting or controlled burns, are necessary to control its spread and maintain ecosystem balance [12]. In practice, Phragmites is used in various wetland configurations, including vertical flow constructed wetlands (VFCWs), demonstrating high wastewater treatment efficiency without phytotoxicity [13]. Studies also show that increased atmospheric CO2 levels can boost its photosynthesis and growth, potentially improving its treatment capabilities [14].
Constructed wetlands (CWs) have emerged globally as an effective, low-cost, and nature-based alternative for wastewater treatment [15]. They combine substrate filtration, plant uptake, and microbial degradation to achieve high pollutant removal efficiency while also supporting biodiversity and creating green spaces [16]. CWs can operate without continuous energy input and are well-suited to decentralised applications in areas with fluctuating wastewater volumes and loads.
However, single-configuration CWs (either horizontal or vertical flow) often face limitations such as clogging, incomplete nutrient removal, or seasonal variability in performance, particularly under high-volume or mixed wastewater loads. To overcome these challenges, hybrid constructed wetlands (hybrid CWs) combine different flow regimes in sequence, most commonly vertical-flow followed by horizontal-flow. Vertical units enhance aeration and nitrification, while horizontal units favour denitrification and solids removal, creating a complementary treatment pathway. Comparative studies in Europe, China, and India have shown hybrid CWs consistently achieve higher nitrogen removal, more stable pathogen reduction, and greater resilience to hydraulic or organic shock loads than single-type systems. For these reasons, the present study adopts a hybrid CW design, integrating stratified filter media, bottom-up vertical flow, and native macrophytes (Phragmites and Typha), to maximise pollutant removal efficiency and reuse potential under real-world Indian peri-urban conditions.
Plant choice is a key factor in CW performance. Phragmites australis (common reed) and Typha spp. (cattails) are two of the most widely used emergent macrophytes due to their high nutrient uptake capacity, ability to transfer oxygen to the rhizosphere, adaptability to diverse conditions, and resilience under variable pollutant loads [8, 9].
1.1 Research gaps
• Very few studies have documented the performance of full-scale CWs operating under real-world Indian urban–industrial conditions, particularly for high-volume treatment systems (>5 MLD).
• Cold-season startup performance in northern India is largely unreported, leaving uncertainty about plant establishment and microbial activity under low-temperature conditions.
• Effluent reuse assessments are rarely integrated into CW performance studies, and no standardised multi-parameter index tailored to Indian reuse guidelines currently exists.
• There is limited discussion in existing literature about bridging the gap between theoretical CW research and practical, operational realities such as shock load resilience and seasonal adaptability.
Addressing these gaps is essential to demonstrate the long-term viability and scalability of CWs for wastewater treatment in India. Providing field-scale evidence, especially from mixed-source wastewater systems, can inform both design standards and policy frameworks for decentralised treatment. The present study examines one of the few documented full-scale CW systems in India that operates under actual urban–industrial conditions. Developed by the Yamuna Expressway Industrial Development Authority (YEIDA) in the National Capital Region (NCR), this hybrid system treats 5 million litres per day (MLD) of combined domestic and light industrial wastewater. The design incorporates native Phragmites and Typha in a bottom-up vertical flow configuration with stratified filter media and gravity-driven hydraulics. This study not only evaluates pollutant removal efficiency but also introduces the Treated Water Reuse Quality Index (RWQI), a weighted, multi-parameter tool designed to quantify the reuse potential of treated effluent according to Indian norms. By monitoring cold-season startup, plant growth, microbial indicators, and operational resilience under variable loads, the work provides practical insights that bridge research and real-world application. The findings are intended to serve as a reference for the design, implementation, and policy adoption of CWs in similar environmental and socio-economic contexts.
To address the identified gaps, the lack of full-scale performance data for CWs in Indian urban–industrial contexts, the absence of documented cold-season startup behaviour, the limited integration of effluent reuse potential into performance evaluations, and the insufficient linkage between theoretical research and operational realities this study evaluates a full-scale hybrid constructed wetland system implemented by the Yamuna Expressway Industrial Development Authority (YEIDA) in India’s National Capital Region.
Designed to treat 5 million litres per day (MLD) of combined domestic and light industrial wastewater, the system incorporates native macrophytes (Phragmites and Typha), stratified media layers, a bottom-up vertical flow configuration, and gravity-driven hydraulics.
1.2 Objectives of the research
• Quantitatively evaluate the removal efficiency for organic pollutants, suspended solids, nutrients, and pathogenic contaminants under actual field conditions.
• Monitor cold-season plant establishment and growth performance to assess adaptability during low-temperature startup.
• Identify microbial activity development through qualitative field indicators such as biofilm formation, sludge colour changes, and odour reduction.
• Model theoretical spatial degradation trends for BOD reduction across treatment zones.
• Develop and apply a novel Treated Water Reuse Quality Index (RWQI) tailored to Indian reuse norms, integrating multiple water quality parameters into a single decision-making tool for non-potable reuse suitability.
1.3 Novelty of the study
• This is one of the few documented full-scale CW systems in India operating under real urban–industrial conditions and treating 5 MLD of mixed domestic and light industrial wastewater.
• It is the first to report cold-season startup performance in northern India, showing how Phragmites and Typha establish and function during winter temperatures (~15℃).
• It introduces the Treated Water Reuse Quality Index (RWQI), a new weighted, multi-parameter tool tailored to Indian reuse norms for quick decision-making on non-potable reuse.
2.1 Site identification and planning
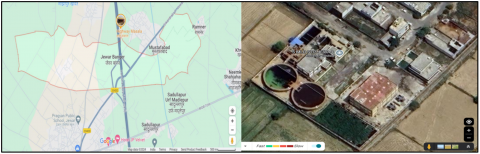
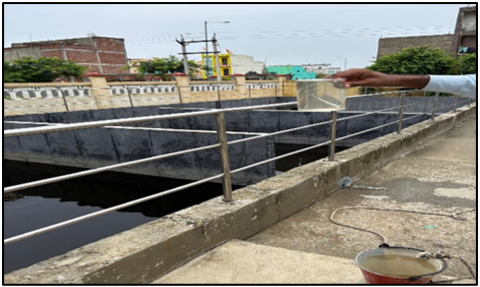
The treatment system was established within the jurisdiction of the Yamuna Expressway Industrial Development Authority (YEIDA), located in the extended suburban zone of the National Capital Region (NCR), India (Figure 1). This area was selected due to the convergence of untreated sewage from neighbouring residential colonies and dispersed industrial units, resulting in noticeable deterioration in water quality and public hygiene. The final location was determined through participatory planning involving engineers and environmental officers.
Figure 1. Study area [17]
2.2 System structure and treatment design
To address a combined wastewater load from both households and light industrial sources, a horizontal subsurface flow constructed wetland (HSSF-CW) was conceptualised. The infrastructure includes five uniformly sized treatment beds, each approximately 17.5 meters long and 6.85 meters wide, constructed to function independently but hydraulically linked. The design accounts for a total daily inflow of 5,000 cubic meters.
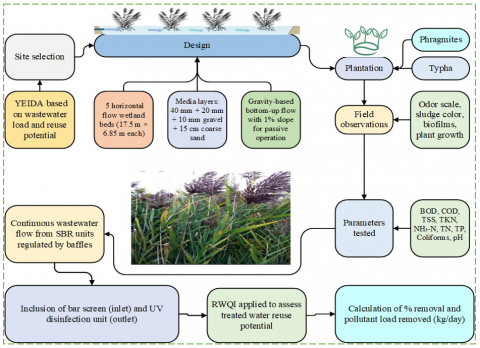
The treatment matrix within each bed comprises graded filter layers: coarse aggregates at the base (40 mm), a mid-layer of medium gravel (20 mm), topped with fine gravel (10 mm), and sealed with a uniform layer of coarse sand (~15 cm). This arrangement supports microbial growth, water retention, and physical screening. The research methodology is shown in Figure 2. The design corresponded to a hydraulic loading rate (HLR) of 0.83 m³/m²·day, calculated from the inflow (5,000 m³/day) and total surface area (599.38 m²). With an effective bed depth of 0.6 m and estimated porosity of 0.35, the average hydraulic retention time (HRT) was 5-6 days, which is consistent with recommended values for high-strength domestic-industrial wastewater.
Figure 2. Research methodology
2.3 Vegetation scheme and planting strategy
The wetland beds were vegetated using two emergent plant species common to northern Indian wetlands, Phragmites and Typha. These were transplanted during December 2023 in alternating zones to study their comparative establishment and phytoremediation performance. A planting interval of 30 centimetres ensured dense coverage. Phragmites was positioned in the front sections of each bed, while Typha occupied the subsequent sections. Planting material was locally sourced to maintain ecological compatibility.
2.4 Flow arrangement and operational controls
Influent wastewater, pre-settled through an upstream screening chamber, enters the CW via a gravity-fed inlet. The design utilises a bottom-up flow path, encouraging water to percolate upward through the aggregate matrix. Each bed maintains a gentle slope of 1%, optimizing retention time and preventing hydraulic stagnation. To protect against media washout, inlet and outlet baffle structures made of brick masonry were incorporated. At the final stage, effluent passes through an ultraviolet disinfection unit, allowing the treated water to meet quality thresholds for potential reuse or environmental discharge.
2.5 Monitoring schedule and sample handling
Sampling was conducted once per week (total of 12 events) using grab samples collected between 10:00 and 12:00 h to reduce diurnal variability. Influent and final effluent were sampled during every event, while additional mid-bed samples were taken from two representative cells using sampling ports. Both influent and effluent samples were collected once per week in sterile containers, labeled, and preserved on-site before being transferred to the laboratory for analysis.
Samples were tested for standard wastewater parameters, including:
• Organic matter: Biochemical Oxygen Demand (BOD₅), Chemical Oxygen Demand (COD)
• Solids: Total Suspended Solids (TSS), turbidity
• Nutrients: Ammonia-N, Total Nitrogen (TN), Total Kjeldahl Nitrogen (TKN), Total Phosphorus (TP)
• Pathogens: Total Coliforms (using MPN method)
• General characteristics: pH and temperature
All testing followed procedures outlined in the APHA Standard Methods (2017 edition). Analytical procedures followed APHA (2017) methods: BOD₅ (5210 B), COD (5220 C), TSS (2540 D), turbidity (2130 B), Ammonia-N (4500-NH₃ F), TKN (4500-Norg C), Total P (4500-P E), pH (4500-H⁺ B), and Total Coliforms (9221 B, MPN technique).
2.6 Efficiency calculation and load removal estimation
The pollutant removal efficiency was computed by comparing average influent and effluent concentrations for each parameter using:
Efficiency $(\%)=\left(\frac{\mathrm{C}_{\text {in }}-\mathrm{C}_{\text {out }}}{\mathrm{C}_{\text {in }}}\right) \times 100$
Additionally, daily pollutant removal loads (in kg/day) were calculated using the product of flow volume and concentration differential.
2.7 Reuse quality assessment using RWQI
To assess the potential of the treated water for secondary uses such as landscape irrigation and industrial applications, a Reuse Water Quality Index (RWQI) was devised. This index integrated seven effluent quality parameters; each was assigned a weight according to its significance in water reuse suitability. Scoring was carried out on a 0–100 scale, and the final composite score was computed using a weighted average formula. The RWQI method is aligned with reuse standards issued by the Central Pollution Control Board (CPCB) and USEPA, serving as a decision-making tool for evaluating effluent reusability under Indian conditions.
The Treated Water Reuse Quality Index (RWQI) was calculated using a weighted arithmetic index method. Seven effluent quality parameters were considered: $\mathrm{BOD}_5(\mathrm{Wi}=0.25)$, COD (0.15), TSS (0.20), Ammonia-N (0.10), Total Phosphorus (0.10), Total Coliforms (0.15), and pH (0.05). For each parameter, a sub-index (Qi) was derived on a 0-100 scale using linear normalisation between measured values and the CPCB/USEPA reuse thresholds. The composite RWQI was computed as:
$\mathrm{RWQI}=\frac{\sum\left(\mathrm{W}_{\mathrm{i}} \times \mathrm{Q}_{\mathrm{i}}\right)}{\sum \mathrm{W}_{\mathrm{i}}}$
Scores were classified as Excellent (90-100), Good (75-89), Fair (60-74), or Poor (<60).
The Yamuna Expressway Industrial Development Authority (YEIDA), located in India’s National Capital Region (NCR), was selected for the implementation of a full-scale constructed wetland (CW) project.
3.1 Treatment capacity
The CW system was designed to treat up to 5 million litres per day (MLD), sufficient to handle wastewater generated by approximately 11,000 households along with associated industrial discharge.
3.2 Pre-treatment and flow regulation
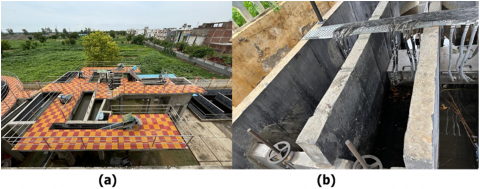
To ensure uninterrupted and clog-free operation, a screening chamber equipped with bar screens was installed at the influent inlet to trap floating solids, plastics, and coarse debris. The system is gravity-driven, with a 1% longitudinal bed slope, designed to maintain consistent flow without energy input. This CW functions as a secondary treatment unit, receiving partially treated effluent from existing Sequencing Batch Reactor (SBR) basins, followed by UV disinfection at the outlet stage to ensure compliance with reuse or discharge standards. The pretreatment unit and UV disinfection system are shown in Figures 3(a) and 3(b), respectively.
Figure 3. (a) Pretreatment unit; (b) UV disinfection system
3.3 Wetland bed configuration
The CW comprises five parallel treatment cells, each measuring 17.5 meters in length and 6.85 meters in width, covering a combined surface area of 599.38 m². Each cell contains a horizontally stratified filter bed composed of multiple layers:
• Bottom Layer: 40 mm crushed stone aggregate
• Middle Layer: 20 mm gravel
• Top Layer: 10 mm fine gravel, overlaid by
• Surface Layer: 15 cm thick coarse sand (grain size ~1.5 mm)
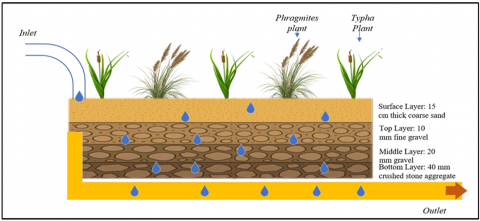
This layering supports mechanical filtration, root penetration, and microbial colonization, ensuring a balance of physical and biological treatment mechanisms. A bottom-up vertical flow regime was employed, where influent enters from beneath the bed and rises toward the outlet, promoting intensive root-zone contact with contaminants [18]. To reduce media displacement during peak flows, brick baffle structures were constructed at both inlet and outlet points of each cell, ensuring uniform distribution and preventing sand washout during high-volume events.
3.4 Vegetation and phytoremediation strategy
The CW was vegetated in December 2023 with two native macrophytes: Phragmites (common reed) and Typha (cattail). Both species were chosen based on their proven phytoremediation potential, rapid growth, and adaptation to the semi-arid conditions of NCR. The planting density was maintained at 30 cm spacing in a staggered formation, facilitating optimal root coverage and aeration (Figure 4).
• Phragmites was planted in the first 10 meters of each cell to enhance nutrient uptake (N, P), provide substrate stabilisation, and supply a large surface area for microbial biofilms.
• Typha was planted in the next 10 meters, targeting the removal of suspended solids, trace elements, and contributing to oxygen diffusion into the rhizosphere.
Each plant species was allocated 40 m² of growing area and sourced from a nearby nursery along the Yamuna Expressway to ensure climate compatibility and healthy establishment.
Figure 4. Constructed wetland design
3.5 Ecological and community integration
The design prioritises low-energy operation, minimal maintenance, and cost-effectiveness, aligning with YEIDA’s socio-economic and environmental context. The natural treatment processes comprising sedimentation, filtration, microbial degradation, plant uptake, and photolysis were integrated into a modular and flexible layout to accommodate future expansions or adjustments based on community needs. The summary of key design features is listed in Table 1.
This well-structured CW system reflects a holistic design approach, combining engineering efficiency with ecological functionality. It stands as a replicable model for future decentralised wastewater treatment initiatives in other urban-industrial regions of India, especially where land, energy, and operational simplicity are critical considerations (Figure 5).
Table 1. Summary of key design features
|
Feature |
Specification |
|
Location |
YEIDA, NCR, India |
|
Treatment capacity |
5 MLD (5,000 m³/day) |
|
Number of cells |
5 parallel units |
|
Cell dimensions |
17.5 m × 6.85 m (each) |
|
Total surface area |
599.38 m² |
|
Substrate layers |
40 mm (bottom), 20 mm (middle), 10 mm (top), 15 cm sand (surface) |
|
Flow system |
Bottom-up vertical flow, gravity-driven |
|
Slope |
1% bed slope |
|
Vegetation |
Phragmites (1st 10 m), Typha (next 10 m) |
|
Plant spacing |
30 cm grid pattern |
|
Pretreatment |
Bar screens and a sediment chamber |
|
Post-treatment |
UV disinfection |
|
Design emphasis |
Low energy, high sustainability, community-integrated |
Figure 5. Sample collection
The constructed wetland (CW) system developed at YEIDA and vegetated with Phragmites and Typha has demonstrated a high capacity for treating domestic and light industrial wastewater. This section presents a comprehensive evaluation of the system’s performance, combining quantitative water quality data, plant tissue analysis, mass balance calculations, and field observations. The findings highlight the ecological viability and operational reliability of large-scale hybrid CWs under urban-industrial Indian conditions.
The uniqueness of this study lies in the incorporation of plant growth behavior, resilience to seasonal variations and organic shock loads, spatial degradation profiling, and the practical assessment of treated water reuse suitability via the newly introduced Treated Water Reuse Quality Index (RWQI). These elements extend beyond conventional performance metrics, thereby adding a novel dimension to the real-world applicability of constructed wetlands.
4.1 Reduction of organic pollutants
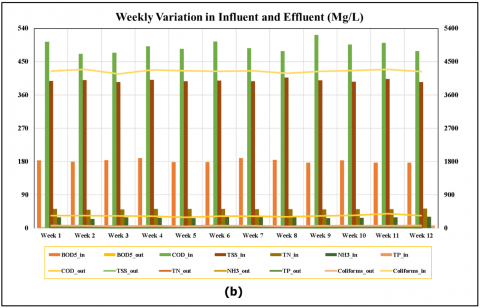
The constructed wetland (CW) system demonstrated a high degree of efficiency in removing organic pollutants from the influent wastewater. This was substantiated through consistent weekly sampling and laboratory analysis conducted over the operational period. The Biochemical Oxygen Demand (BOD₅) and Chemical Oxygen Demand (COD) values, which are key indicators of organic pollution, showed significant reductions between influent and effluent streams (Figure 6(a)).
Figure 6. (a) Organic pollutant removal performance in CW system; (b) Weekly variation in influent and effluent water quality parameters (BOD₅, COD, TSS, TN, NH₃-N, TP, and total coliforms) over 12 weeks of monitoring
The influent BOD₅ levels averaged 180 mg/L, while the effluent consistently maintained values around 3.9 mg/L, indicating a removal efficiency of 97.83%. Similarly, COD concentrations declined from an influent average of 500 mg/L to an effluent average of 33.4 mg/L, corresponding to a removal efficiency of 93.33%. These substantial reductions underscore the effective biological degradation processes occurring within the wetland system.
The high removal rates are primarily attributed to aerobic and facultative microbial activity in the rhizosphere, facilitated by oxygen diffusion from plant roots (particularly Phragmites and Typha) into the surrounding substrate. These conditions support enhanced microbial colonisation, enzymatic breakdown of organic matter, and long-term pollutant transformation [19].
In addition to concentration-based efficiency, mass loading and removal rates were estimated to highlight the system’s performance under real operational flow conditions. The CW treated an average daily inflow of approximately 5000 m³/day, translating into the removal of approximately 880.5 kilograms of BOD₅ and 2333 kilograms of COD per day. These values emphasise the scalability and practicality of this CW system for high-load, decentralised wastewater treatment applications in peri-urban and industrial zones [20].
These findings validate the system’s capacity to operate reliably under varying organic load conditions and establish it as a viable eco-technological solution for sustainable wastewater treatment in the Indian context.
In addition to pollutant removal averages, it is important to assess the temporal stability of the system. Figure 6(b) presents the weekly variation of influent and effluent concentrations for major water quality parameters (BOD₅, COD, TSS, TN, NH₃-N, TP, and total coliforms) over a 12-week monitoring period. The influent showed moderate fluctuations, particularly in COD (470–520 mg/L) and Ammonia-N (25–32 mg/L), reflecting the variability of combined domestic and light industrial wastewater. Despite these variations, effluent concentrations remained consistently low and within regulatory limits, with BOD₅ below 5 mg/L, COD below 40 mg/L, and TSS around 5 mg/L. Nutrient concentrations were also stable, with TN typically < 6 mg/L and TP < 2 mg/L, indicating sustained performance of microbial and substrate-mediated processes. Total Coliform counts were reduced by nearly two orders of magnitude across all weeks, demonstrating robust microbial safety. The close clustering of effluent values across the monitoring period highlights the resilience and reliability of the hybrid CW system, even under fluctuating influent loads.
4.2 Nutrient removal efficiency
In addition to the removal of organic pollutants, the constructed wetland (CW) system demonstrated robust efficiency in eliminating nitrogenous and phosphatic compounds, which are key contributors to eutrophication and water quality degradation. Performance assessment (Table 2) was based on the analysis of various nutrient forms, including Total Kjeldahl Nitrogen (TKN), Total Nitrogen (TN), Ammonia-N, and Total Phosphorus (TP).
These outcomes confirm that the hybrid CW system is highly effective in managing nutrient loads from domestic and industrial wastewater sources. The ability to significantly reduce nitrogen and phosphorus forms supports the long-term sustainability of the system and its role in mitigating nutrient-driven environmental degradation. The high nutrient removal observed in this study likely reflects the combined effects of plant uptake, microbial transformation, and substrate adsorption. Phragmites and Typha actively assimilate nitrogen and phosphorus into biomass, particularly during their rapid growth phase, but plant uptake alone rarely exceeds 20–30% of total nitrogen removal in full-scale CWs. The substantial reduction in Total Nitrogen (91.69%), therefore, indicates a dominant contribution from microbial nitrification–denitrification processes in the rhizosphere, supported by oxygen diffusion from plant roots. Ammonia oxidation to nitrate is favoured in vertical-flow sections where oxygen availability is higher, while denitrification occurs in more anoxic horizontal sections. Phosphorus removal (~75–80%) can be partly attributed to plant assimilation but is strongly influenced by adsorption and precipitation within the sand and gravel media, processes that may gradually decline as binding sites saturate. The observed winter growth of Phragmites and Typha can be explained by their physiological resilience; both species maintain root activity and oxygen release even at ~15℃, enabling microbial processes to continue under cooler conditions.
Table 2. Nutrient removal performance in a constructed wetland system
|
Parameter |
Influent Concentration (mg/L) |
Effluent Concentration (mg/L) |
Removal Efficiency (%) |
|
Total Kjeldahl Nitrogen (TKN) |
50 |
9.6 |
80.80 |
|
Total Nitrogen (TN) |
51.8 ± 5 |
4.3 ± 2.15 |
91.69 |
|
Ammonia-N (NH₃–N) |
28.6 ± 10 |
5 ± 2.5 |
82.52 |
|
Total Phosphorus (TP) |
6–8 |
< 2 |
75–80 |
|
Total Suspended Solids (TSS) |
400 mg/L |
4.9 mg/L |
98.78 |
|
Turbidity |
1.3 ± 0.65 NTU |
<1 ± 0.5 NTU |
~23.08 |
4.3 Suspended solids and turbidity reduction
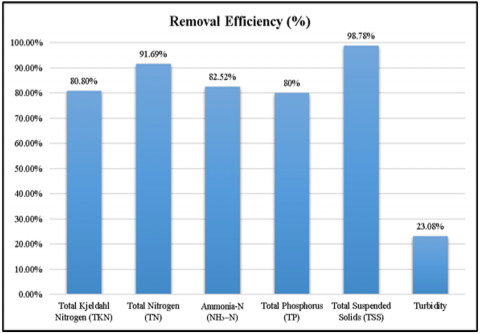
The constructed wetland (CW) system demonstrated exceptional efficiency in the removal of physical pollutants (Figure 7), particularly total suspended solids (TSS) and turbidity, which are key indicators of particulate matter and overall water clarity. The influent TSS concentration averaged 400 mg/L, which was consistently reduced to 4.9 mg/L in the effluent, resulting in a removal efficiency of 98.78%. Similarly, turbidity levels showed marked improvement, decreasing from an influent average of 1.3 ± 0.65 NTU to less than 1 ± 0.5 NTU in the treated outflow. These mechanisms collectively improve effluent clarity, minimise downstream siltation, and support the reuse potential of the treated water for applications where visual and physical water quality is a consideration.
Figure 7. Removal efficiency
The consistent reduction in suspended solids and turbidity not only supports regulatory compliance but also contributes to the operational stability of the system by preventing clogging in downstream reuse systems or discharge channels.
4.4 Heavy metal and nutrient accumulation in plants
Tissue analyses showed significant bioaccumulation of essential nutrients and trace elements. Phragmites accumulated higher concentrations of Zn, Fe, Ca, and K compared to Typha (Table 3), although Typha exhibited better uptake efficiency relative to biomass due to its faster growth rate. This finding supports the seasonal harvesting of macrophytes to prevent nutrient recirculation and enhance long-term treatment efficiency.
Table 3. Average plant tissue concentrations [21]
|
Species |
Zn |
Fe |
S |
P |
Mg |
Ca |
K |
N |
|
Phragmites |
50 |
300 |
2000 |
1500 |
2000 |
5000 |
20000 |
18000 |
|
Typha |
45 |
250 |
1800 |
1200 |
1500 |
4000 |
18000 |
16000 |
4.5 Vegetative growth and adaptability
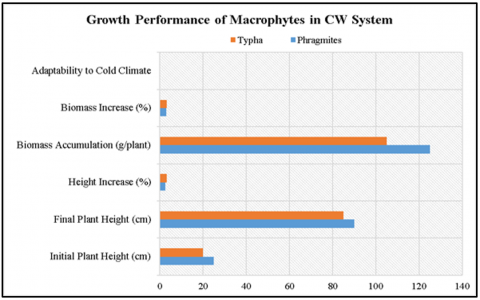
The vegetative response of the planted macrophytes, Phragmites and Typha, was closely monitored from the initiation phase in December 2023 through the active growth period ending in March 2024. Despite the onset of planting during winter, both species exhibited substantial vertical growth and biomass accumulation, validating their adaptability to climatic conditions prevalent in the National Capital Region (NCR). Initial plant heights for Phragmites and Typha were recorded at approximately 25 cm and 20 cm, respectively. By the end of the three-month period, Phragmites attained an average height of 90 cm, while Typha reached 85 cm, signifying a growth increase of over 250-300%. Similarly, above-ground biomass accumulation was observed to be 125 grams per plant for Phragmites and 105 grams per plant for Typha, with estimated biomass increases of 300% and 320%, respectively. The Growth Performance of macrophytes in the constructed wetland system is shown in Figure 8. This robust vegetative performance under low winter temperatures (minimum ~15℃) is indicative of the species’ cold-season resilience, which holds particular importance for constructed wetland (CW) implementation in northern India, where ambient conditions can limit biological activity during initial establishment.
Figure 8. Growth performance of macrophytes in the CW system
These findings reinforce the ecological suitability and operational feasibility of Phragmites and Typha in hybrid constructed wetlands intended for year-round use in subtropical climates. The ability to initiate growth and establish dense biomass during winter months extends the planting window and enhances design flexibility for future installations across northern India.
4.6 pH stability and climatic influence
The pH of wastewater plays a critical role in regulating microbial activity and enzymatic processes within constructed wetlands (CWs). Throughout the monitoring period, the effluent pH of the CW system remained stable within the range of 7.3–7.7, which is optimal for nitrification, microbial degradation of organic matter, and overall pollutant removal. This stability indicates that the system maintained buffering capacity, ensuring favorable conditions for both aerobic and anaerobic biological processes.
In contrast, the influent pH showed greater variability, ranging between 6.5 and 7.6, particularly during the initial weeks of operation. Such fluctuations are common in domestic and light industrial wastewater due to variable chemical and organic inputs. However, the CW’s substrate layers (sand and gravel) and the presence of plant root systems provided a neutralizing effect, minimizing pH swings and contributing to effluent stability. Table 4 lists the pH and temperature trends in the CW System. Ambient temperature variations during the study period ranged from 18℃ to 28℃, covering both cooler winter and early spring conditions. No adverse impacts on treatment efficiency were observed, confirming the resilience of the CW system under moderate seasonal changes. The synergistic effect of stable pH and suitable temperatures facilitated consistent enzymatic and microbial activity throughout the treatment cycle.
The maintenance of neutral-to-slightly-alkaline pH levels, coupled with temperature tolerance, underscores the robust design and ecological stability of the CW system. This characteristic is particularly advantageous for decentralised wastewater treatment in regions with fluctuating seasonal climates.
Table 4. pH and temperature trends in the CW system
|
Parameter |
Influent Range |
Effluent Range |
Observations |
|
pH |
6.5-7.6 |
7.3-7.7 |
Effluent remained within the optimal range |
|
Temperature (℃) |
18-28 |
18-28 |
Stable performance across seasonal changes |
4.7 Microbial dynamics and biofilm development
Microbial activity is the cornerstone of pollutant degradation in constructed wetlands, particularly for parameters such as BOD, Total Kjeldahl Nitrogen (TKN), and Ammonia-N. Although quantitative microbial enumeration (e.g., CFU counts, qPCR) was not performed in this study, field-level qualitative indicators provided strong evidence for the establishment and functionality of diverse microbial consortia.
Within three weeks of system startup, visible biofilm formation was observed on plant root surfaces, particularly around the submerged portions of Phragmites and Typha roots. These biofilms appeared as thin, gelatinous layers, signifying the early colonisation of microbial communities. Additionally, changes in sludge colouration from black (anaerobic) to brown (aerobic/facultative) layers were noted, especially in zones closer to the inlet and mid-sections of the wetland. This transition is indicative of the development of aerobic and facultative redox zones, necessary for efficient organic and nutrient degradation. Table 5 demonstrates the qualitative indicators of microbial establishment in the constructed wetland system.
Table 5. Qualitative indicators of microbial establishment in the CW system
|
Indicator |
Observation |
Interpretation |
|
Biofilm formation |
On roots within 3 weeks |
Early microbial colonisation |
|
Sludge colour change |
Black to brown |
Shift from anaerobic to aerobic processes |
|
Odor reduction |
Scale 5 → 1 |
Decrease in anaerobic by-products (e.g., H₂S) |
|
Plant root activity |
Dense root hairs observed |
Enhanced oxygenation and microbial support |
These observations collectively confirm the development of a functionally active microbial community within the constructed wetland, essential for sustaining pollutant removal processes without the need for external aeration or chemical additives. Future studies can integrate metagenomic or enzymatic profiling to quantify microbial dynamics and link them with treatment performance metrics more precisely.
4.8 Organic load resilience and shock absorption
An essential performance criterion for any decentralised wastewater treatment system is its ability to withstand sudden increases in organic loading, often referred to as shock loads. During the study period, the constructed wetland (CW) encountered several high-load events, particularly during holiday weekends and festival periods, which caused abrupt surges in organic pollutant concentrations.
Influent BOD₅ levels exceeded 220 mg/L, while COD concentrations peaked above 600 mg/L during these events. Despite these elevated inputs, the system demonstrated remarkable resilience, maintaining effluent BOD concentrations below 10 mg/L, well within CPCB-recommended discharge standards (Table 6). This indicates a buffering capacity of over 95%, even under fluctuating load conditions.
Table 6. CW performance during organic shock load events
|
Parameter |
Normal Range |
Shock Event Peak |
Effluent Value |
Interpretation |
|
BOD₅ (mg/L) |
160–180 |
> 220 |
< 10 |
Maintained high removal efficiency |
|
COD (mg/L) |
450–500 |
> 600 |
< 50 |
Stable performance under stress |
|
System Response |
Balanced microbial load |
Buffered through media layers |
No significant variation |
High resilience and self-regulation |
This adaptive behavior confirms the robustness and dynamic equilibrium of the CW system, making it suitable for real-world applications where influent characteristics are subject to temporal variability.
These findings reinforce the CW’s capability to function effectively under non-steady state conditions, offering a low-maintenance, high-reliability solution for peri-urban and industrial settlements with variable waste discharge patterns.
4.9 Seasonal adaptation and early planting behavior
One of the key novelties of this study is the successful establishment of the constructed wetland (CW) system during the winter season, under ambient temperatures averaging ~15℃. Typically, low temperatures can hinder root development and microbial activity in newly planted wetland systems. However, the current system exhibited strong resilience and adaptability during early establishment, offering important implications for CW implementation in northern India, where winter planting is often considered suboptimal.
These observations (Table 7) highlight the seasonal resilience of the selected macrophytes and validate the potential for year-round CW installation, especially in northern latitudes where traditional planting is postponed until spring. This finding contributes to the design innovation of CW systems adapted to diverse Indian climates. The performance of the YEIDA system aligns with or surpasses reported efficiencies of other full-scale hybrid CWs worldwide. Previous research [18] reported 85-90% BOD and COD removal in a vertical-flow CW in India, while a hybrid CW in China treating municipal wastewater achieved ~92% COD and 85% TN removal [22]. European hybrid CWs treating domestic sewage typically show 80-95% BOD and COD removal and 60-80% TN removal [23]. The YEIDA system’s results (BOD 97.8%, COD 93.3%, TN 91.7%) are therefore at the upper range of international performance, demonstrating that robust pollutant removal can be achieved even under Indian peri-urban, mixed-wastewater conditions.
Table 7. Indicators of early planting success during winter initiation
|
Parameter |
Observation Period |
Result/Trend |
Interpretation |
|
Planting Month |
December 2023 |
~15℃ average temperature |
Low-temperature start |
|
Root Hair Visibility |
Week 3 |
Clearly visible in both species |
Active root development |
|
Root Length Density |
Week 1–4 |
Increasing trend observed |
Establishment despite cold conditions |
|
Plant Dormancy |
Entire winter season |
Not observed |
Strong physiological adaptation |
|
Implication for CW Expansion |
Operational planning phase |
Planting is feasible in winter in North India |
Increases deployment flexibility |
The cumulative performance of the constructed wetland (CW) system at YEIDA was evaluated by analysing a comprehensive set of physicochemical and microbiological water quality parameters. These included indicators of organic load (BOD₅, COD), suspended solids (TSS, turbidity), nutrient concentrations (TKN, Total Nitrogen, Ammonia-N, Total Phosphorus), pathogenic contamination (Total Coliforms), and pH stability. The results affirm the system’s high pollutant removal efficiency and operational robustness under real field conditions.
Across all major parameters, the CW system exhibited significant improvements in effluent quality (Table 8). Organic pollutants were reduced by over 93%, and TSS by nearly 99%, while nutrients such as total nitrogen and ammonia-N were also effectively mitigated. Microbial safety, assessed through Total Coliform removal, achieved an impressive 98.64%, suggesting suitability for non-potable reuse. Additionally, effluent pH was maintained within the optimal range of 7.3–7.7, reflecting stable biogeochemical conditions in the system. These consistent and high-efficiency outcomes validate the CW as a viable solution for decentralised wastewater treatment, especially in peri-urban and industrial edge zones of Indian cities.
Table 8. Summary of key water quality parameters treated by the CW system
|
Parameter |
Unit |
Influent Average |
Effluent Average |
Removal Efficiency (%) |
|
BOD₅ |
mg/L |
180 |
3.9 |
97.83 |
|
COD |
mg/L |
500 |
33.4 |
93.33 |
|
TSS |
mg/L |
400 |
4.9 |
98.78 |
|
Total Kjeldahl Nitrogen (TKN) |
mg/L |
50 |
9.6 |
80.80 |
|
Total Nitrogen |
mg/L |
51.8 ± 5 |
4.3 ± 2.15 |
91.69 |
|
Ammonia-N |
mg/L |
28.6 ± 10 |
5 ± 2.5 |
82.52 |
|
Total Phosphorus |
mg/L |
6-8 |
<2 |
75–80 |
|
Turbidity |
NTU |
1.3 ± 0.65 |
<1 ± 0.5 |
~23.08* |
|
Total Coliforms |
MPN/100mL |
4250 ± 100 |
58 ± 5 |
98.64 |
|
pH |
- |
6.5-7.6 |
7.3-7.7 |
Stabilized |
*Note: Turbidity values were already low in the influent; percentage reduction is relatively modest but still operationally relevant.
The holistic removal profile exhibited by the CW confirms its alignment with CPCB Class C discharge norms and international water reuse guidelines. This performance summary serves as a baseline for future comparative studies and reinforces the scalability of hybrid CWs for integrated urban water management systems in India and similar climates.
5.1 Hypothetical spatial removal trend
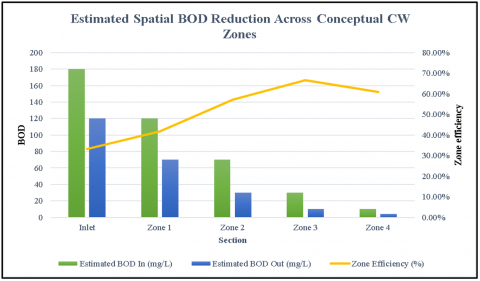
While the current study did not include direct sampling from individual sections of the constructed wetland (CW) bed, a conceptual spatial removal model was developed based on known hydraulic retention time (HRT) distribution, flow paths, and pollutant degradation kinetics observed in similar systems. This model provides a theoretical framework for understanding the progressive reduction of BOD (Biochemical Oxygen Demand) across the length of the treatment bed (Figure 9).
Figure 9. Estimated spatial BOD reduction across conceptual CW zones
This theoretical distribution emphasises that maximum BOD reduction occurs in the middle to later stages of the wetland, where organic load is lower and microbial communities are more established. The presence of deeper root zones, enhanced oxygen diffusion, and mature biofilm layers in Zones 3 and 4 contributes significantly to the final polishing of the effluent.
5.2 Pollutant removal efficiency and load estimation
The performance of the constructed wetland (CW) was quantitatively evaluated using both percentage removal efficiency and mass load reduction estimates for key wastewater pollutants (Table 9). The calculations were based on average influent and effluent concentrations measured during the monitoring period, with a daily treatment volume of 5,000 m³/day.
Table 9. Pollutant removal efficiency and daily load reduction
|
Parameter |
Influent (mg/L) |
Effluent (mg/L) |
Removal Efficiency (%) |
Load Removed (kg/day) |
|
BOD₅ |
180 |
3.9 |
97.83 |
880.5 |
|
COD |
500 |
33.4 |
93.33 |
2,333 |
|
TSS |
400 |
4.9 |
98.78 |
1,976 |
|
TKN |
50 |
9.6 |
80.80 |
202 |
|
Total Nitrogen |
51.8 |
4.3 |
91.69 |
237.5 |
|
Ammonia-N |
28.6 |
5.0 |
82.52 |
118 |
|
Total Phosphorus |
7 (average) |
<2 |
~75–80 |
~250* |
*Note: Phosphorus load removal was approximated using an average influent concentration of 7 mg/L and an estimated effluent value <2 mg/L. Actual range: 6–8 mg/L.
To evaluate the practical reusability of treated effluent from the constructed wetland (CW) system, a Treated Water Reuse Quality Index (RWQI) was developed. This index offers a holistic and quantifiable framework for assessing the suitability of reclaimed water for non-potable applications, including landscaping, toilet flushing, and industrial cooling. The RWQI was calculated using a weighted arithmetic index method, incorporating key effluent quality parameters relevant to reuse safety and compliance: each parameter's sub-index (Qi) was computed using normalized scoring, and the final RWQI was derived using the equation depicted in Section 2.7 and tabulated in Table 10.
Table 10. RWQI calculation based on treated effluent quality
|
Parameter |
Effluent Value |
Reuse Limit |
Weight (Wi) |
Quality Score (Qi) |
|
BOD (mg/L) |
3.9 |
≤10 |
0.25 |
98 |
|
COD (mg/L) |
33.4 |
≤100 |
0.15 |
94 |
|
TSS (mg/L) |
4.9 |
≤20 |
0.20 |
97 |
|
Ammonia-N (mg/L) |
5.0 |
≤5 |
0.10 |
95 |
|
Total Phosphorus (mg/L) |
<2 |
≤2 |
0.10 |
90 |
|
Total Coliforms (MPN/100mL) |
58 |
≤100 |
0.15 |
92 |
|
pH |
7.3–7.7 |
6.5–8.5 |
0.05 |
100 |
|
Final RWQI Score |
- |
- |
1.00 |
95.15 |
A final RWQI score of 95.15 categorises the treated water under the “Excellent” reuse quality bracket, indicating high suitability for non-potable reuse scenarios. All assessed parameters were well within prescribed regulatory thresholds, and the high-quality scores reflect the CW system’s consistent performance in removing both organic and pathogenic contaminants, while maintaining physicochemical stability.
The development and application of RWQI serve as a valuable decision-support tool for urban water managers, facilitating evidence-based planning for safe, sustainable, and decentralised wastewater reuse. Moreover, this index may be adapted as a performance benchmark in similar CW systems deployed across diverse climatic and hydrological regions in India.
The present study was limited by the absence of direct hydraulic measurements (e.g., tracer-based HRT), the lack of microbial community characterisation (only qualitative indicators were used), and a relatively short monitoring period of three months. Future work should include (i) seasonal monitoring over at least one year to capture performance under monsoon and summer extremes, (ii) molecular or metagenomic analysis to quantify microbial community dynamics, (iii) tracer studies to refine hydraulic performance, and (iv) long-term phosphorus balance studies to assess media saturation effects. Such investigations will strengthen the evidence base for scaling up hybrid CWs in diverse Indian contexts.
The full-scale hybrid constructed wetland (CW) system developed by the Yamuna Expressway Industrial Development Authority (YEIDA) has proven highly effective in treating 5 MLD of combined domestic and light industrial wastewater under real peri-urban conditions. The system achieved excellent removal efficiencies, reducing BOD₅ by 97.83% (880.5 kg/day), COD by 93.33% (2,333 kg/day), and TSS by 98.78% (1,976 kg/day). Nutrient elimination was equally impressive, with Total Nitrogen reduced by 91.69% (237.5 kg/day), Ammonia-N by 82.52% (118 kg/day), and Total Phosphorus by 75–80% (~250 kg/day). Pathogen load, measured as Total Coliforms, decreased by 98.64%, ensuring microbiological safety of the effluent.
The introduction of the Treated Water Reuse Quality Index (RWQI) provided a holistic measure of reuse suitability, yielding a final score of 95.15, which qualifies the treated water as “Excellent.” This ensures its safe application for non-potable uses such as landscaping and industrial cooling, while also validating its direct reuse in agriculture. With effluent BOD below 4 mg/L, TSS under 5 mg/L, and coliform counts well within reuse norms, the water is suitable for irrigation without risks of soil clogging or contamination.
Based on average irrigation demand in India (40–50 m³/ha/day), the reclaimed 5,000 m³/day could theoretically irrigate 100–120 hectares of non-edible or fodder crops daily. This estimate is indicative and subject to site-specific evaluation of crop type, soil conditions, and local water reuse regulations. Nevertheless, the results highlight the potential of CW effluent to offset freshwater demand in agriculture.
Thus, this CW system exemplifies a sustainable, low-energy wastewater treatment solution that not only ensures environmental compliance but also strengthens water reuse for agriculture, contributing to water security and circular resource recovery in urban–industrial India.
[1] Jones, E.R., Van Vliet, M.T., Qadir, M., Bierkens, M.F.P. (2021). Country-level and gridded estimates of wastewater production, collection, treatment and reuse. Earth System Science Data, 13(2): 237-254. https://doi.org/10.5194/essd-13-237-2021
[2] Qadir, M., Drechsel, P., Jiménez Cisneros, B., Kim, Y., Pramanik, A., Mehta, P., Olaniyan, O. (2020). Global and regional potential of wastewater as a water, nutrient and energy source. Natural Resources Forum, 44(1): 40-51. https://doi.org/10.1111/1477-8947.12187
[3] Schellenberg, T., Subramanian, V., Ganeshan, G., Tompkins, D., Pradeep, R. (2020). Wastewater discharge standards in the evolving context of urban sustainability–The case of India. Frontiers in Environmental Science, 8. https://doi.org/10.3389/fenvs.2020.00030
[4] Zarate, F.M., Schulwitz, S.E., Stevens, K.J., Venables, B.J. (2012). Bioconcentration of Triclosan, Methyl-Triclosan, and Triclocarban in the plants and sediments of a constructed wetland. Chemosphere, 88(3): 323-329. https://doi.org/10.1016/j.chemosphere.2012.03.005
[5] Lu, M., Guo, Z., Li, D.H. (2012). Purification efficiency of several constructed wetland plants in COD disposal in domestic sewage. Advanced Materials Research, 518-523: 2690-2694. https://doi.org/10.4028/www.scientific.net/AMR.518-523.2690
[6] Li, Y., Ye, X., Wang, Q. (2019). Microbial community structure in confluence region of Huang, Wei and Luo rivers in Guanzhong plain in central China. African Journal of Microbiology Research, 13(24): 376-381. https://doi.org/10.5897/ajmr2019.9121
[7] Pan, X., Ping, Y., Cui, L., Li, W., Zhang, X., Zhou, J., Yu, F., Prinzing, A. (2017). Plant litter submergence affects the water quality of a constructed wetland. PLoS One, 12(1): e0171019. https://doi.org/10.1371/journal.pone.0171019
[8] Ye, F., Guo, J., Hou, P., Wang, Y., Song, F., Zhang, P., Li, X. (2022). Impacts of melatonin on functionalities of constructed wetlands for wastewater treatment. Land, 11(11): 2022. https://doi.org/10.3390/land11112022
[9] Kiviat, E. (2013). Ecosystem services of Phragmites in North America with emphasis on habitat functions. AoB Plants, 5: plt008. https://doi.org/10.1093/aobpla/plt008
[10] Tulbure, M.G., Johnston, C.A. (2010). Environmental conditions promoting non-native Phragmites Australis expansion in great lakes coastal wetlands. Wetlands, 30(3): 577-587. https://doi.org/10.1007/s13157-010-0054-6
[11] Dinehart, R.M., Brewer, D.E., Gehring, T.M., Pangle, K.L.,Uzarski, D.G. (2023). Ecologically scaled responses of marsh birds to invasive Phragmites expansion and water-level fluctuations. Waterbirds, 45(3): 225-236. https://doi.org/10.1675/063.045.0302
[12] Hazelton, E.L.G., Mozdzer, T.J., Burdick, D.M., Kettenring, K.M., Whigham, D.F. (2014). Phragmites australis management in the United States: 40 years of methods and outcomes. AoB Plants, 6: plu001. https://doi.org/10.1093/aobpla/plu001
[13] Neves, A., Godina, R., Erikstad, S.O. (2024). Enhancing efficiency in the maritime industry through lean practices: A critical literature review of benefits and barriers. In Flexible Automation and Intelligent Manufacturing: Establishing Bridges for More Sustainable Manufacturing Systems, pp. 293-306. https://doi.org/10.1007/978-3-031-38165-2_35
[14] Wang, Z., Li, S., Liu, S., Wang, F., Kong, L., Li, X., Brestič, M. (2021). Effects of elevated atmospheric CO2 concentration on Phragmites Australis and wastewater treatment efficiency in constructed wetlands. Water, 13(18): 2500. https://doi.org/10.3390/w13182500
[15] Ferreira, C.S.S., Kašanin-Grubin, M., Solomun, M.K., Sushkova, S., Minkina, T., Zhao, W., Kalantari, Z. (2023). Wetlands as nature-based solutions for water management in different environments. Current Opinion in Environmental Science & Health, 33: 100476. https://doi.org/10.1016/j.coesh.2023.100476
[16] De Martis, G., Mulas, B., Malavasi, V., Michela, M. (2016). Can artificial ecosystems enhance local biodiversity? The case of a constructed wetland in a Mediterranean urban context. Environmental Management, 57(5): 1088-1097. https://doi.org/10.1007/s00267-016-0668-4
[17] 5 MLD STP JEWAR. https://maps.app.goo.gl/Wt5fmbsE5D5mkdzz7?g_st=ipc.
[18] Sharma, H.B., Sinha, P.R. (2016). Performance analysis of vertical flow constructed wetland to treat domestic wastewater using two different filter media and canna as a plant. Indian Journal of Science and Technology, 9(44): 1-7. https://doi.org/10.17485/ijst/2016/v9i44/105276
[19] Abu-Tahon, M.A., Housseiny, M.M., Aboelmagd, H.I., Daifalla, N., et al. (2025). A holistic perspective on the efficiency of microbial enzymes in bioremediation process: Mechanism and challenges: A review. International Journal of Biological Macromolecules, 308: 142278. https://doi.org/10.1016/j.ijbiomac.2025.142278
[20] Ventura, J.R.S., Tulipan, J.U., Banawa, A., Umali, K.D.C., Villanueva, J.A.L. (2024). Advancements and challenges in decentralized wastewater treatment: A comprehensive review. Desalination and Water Treatment, 320: 100830. https://doi.org/10.1016/j.dwt.2024.100830
[21] Kumar, A., Chattopadhyay, S. (2025). Performance evaluation of a constructed wetland system for wastewater treatment in the Yamuna Expressway Industrial Development Authority (YEIDA) Area, India. International Journal of Environmental Impacts, 8(4): 645-654. https://doi.org/10.18280/ijei.080402
[22] Zhang, X., Wang, T., Xu, Z., Zhang, L., Dai, Y., Tang, X., Tao, R., Li, R., Yang, Y., Tai, Y. (2020). Effect of heavy metals in mixed domestic-industrial wastewater on performance of recirculating standing hybrid constructed wetlands (RSHCWs) and their removal. Chemical Engineering Journal, 379: 122363. https://doi.org/10.1016/j.cej.2019.122363
[23] Vymazal, J., Kröpfelová, L. (2015). Multistage hybrid constructed wetland for enhanced removal of nitrogen. Ecological Engineering, 84: 202-208. https://doi.org/10.1016/j.ecoleng.2015.09.017