Arta Dollani![]() | Eugen Skura
| Eugen Skura![]() | Fatbardh Sallaku
| Fatbardh Sallaku![]() | Enkeleda Shkurta*
| Enkeleda Shkurta*![]() | Erinda Lika
| Erinda Lika![]() | Pajtim Bytyçix
| Pajtim Bytyçix![]() | Seit Shallari
| Seit Shallari![]() | Osman Fetoshi
| Osman Fetoshi![]() | Bojan Đurin
| Bojan Đurin![]() | Upaka Rathnayake
| Upaka Rathnayake![]() | Albona Shala-Abazi
| Albona Shala-Abazi![]() | Rakesh Ranjan Thakur
| Rakesh Ranjan Thakur![]() | Debabrata Nandi
| Debabrata Nandi![]() | Roshan Beuria
| Roshan Beuria![]()
© 2025 The authors. This article is published by IIETA and is licensed under the CC BY 4.0 license (http://creativecommons.org/licenses/by/4.0/).
OPEN ACCESS
This study evaluates soil and plant contamination by heavy metals lead (Pb), cadmium (Cd), nickel (Ni), copper (Cu), chromium (Cr), and zinc (Zn) in the Rehova Copper Mine area, Albania. Soil contamination was assessed using the pollution load index (PLI), geoaccumulation index (Igeo), contamination factor (CF), enrichment factor (EF), and potential ecological risk index (RI), while plant contamination was evaluated through bioaccumulation coefficients (BFC). Sixteen soil samples and three pine (Pinus spp.) samples, collected at varying distances from the mine, were analysed. The results identified Cu, Ni, and Cd as the dominant pollutants, with PLI > 1 in most locations and an extreme Igeo value for Cu at L8 (5.38). Nickel contamination was severe at L10 (Igeo = 4.71), L11 (Igeo = 4.12), and L15 (Igeo = 4.24). EF analysis confirmed moderate to high enrichment for Cu and Ni in specific sites, while RI indicated considerable ecological risk (RI > 300) at six locations. Bioaccumulation analysis revealed a bioaccumulation coefficient (BFC) greater than 1 for Pb within a 1 km radius, indicating effective uptake of lead by Pinus spp. and supporting its use as a reliable bioindicator of lead pollution. Spearman correlation showed a significant positive relationship (r = 1; p < 0.001) between Zn in soil and plants, and a strong negative correlation for Cu (r = -1; p < 0.001). To support decision-making, the PROMETHEE multi-criteria decision analysis method was applied to rank all sampling sites based on combined contamination indices and ecological risk, identifying L8, L10, and L11 as the most critical hotspots for remediation. These findings indicate severe heavy metal pollution in the Rehova Mine area, highlighting the urgent need for targeted rehabilitation and long-term monitoring.
heavy metals, soil contamination, bioaccumulation, ecological risk, PROMETHEE
The problem of terrestrial environmental pollution from mining activities is predominant in the world today, especially with the reckless use of natural resources [1-4]. One of the most critical issues is the contamination of soil, water, and air with heavy metals. These environmental contaminants endure in ecosystems and bioaccumulate in the food web, greatly endangering biodiversity and human life [5-7].
Although heavy metals are naturally occurring elements, their environmental and health impacts are amplified due to their significant bioaccumulation, especially in the industrialized world [8-11].
The risks to the environment posed by the extraction of minerals are a well-known fact, yet they remain crucial for the development of infrastructure, advancement of technologies, and sustaining any form of economic activity [12, 13]. In the same breath, these minerals are non-renewable, and the lack of proper extraction techniques results in extremely harmful and irreversible effects like deforestation, soil erosion, the destruction of habitats, and long-term environmental pollution [14, 15].
There is a diminishing number of these minerals, and this fact is starting to hurt the economy in a sustainable and ecological way [16], and perhaps one of the biggest examples is the Rehova Copper Mine located in the southeastern side of Albania. This mine has been unattended and disregarded since 1990, yet even today, it continues to pollute the pristine landscapes.
The long-term impacts of copper mining on ecosystem soil contamination are a well-studied subject due to the persistent presence of heavy metals. Rehova Mine, which operated for only 11 years until its closure in 1990, has continued to cause significant soil degradation over the past three decades due to pollutants such as heavy metals; these toxic metals lead to environmental degradation [17, 18]. This is also evident for metals like Lead (Pb), Cadmium (Cd), Nickel (Ni), Copper (Cu), Chromium (Cr), and Zinc (Zn) as they are highly toxic, resist degradation, and bio-accumulate [11, 19, 20].
To evaluate the level of contamination, some researchers rely on the enrichment factor (EF), geoaccumulation index (Igeo), pollution load index (PLI), contamination factor (CF), and potential ecological risk index (RI) [21-23]. These methodologies are effective in quantifying the observed pollutant levels and comparing them to the baseline levels of a given ecosystem.
This study explores the post-closure impacts of the Rehova Mine through the prism of heavy metal contamination of the soil and the local flora. With regard to pine (Pinus spp.) and its distance from the source of the pollution, we assess metal uptake and gauge pollution levels using EF, Igeo, PLI, CF, and RI. However, while these indices provide valuable information individually, they often yield partial or even conflicting insights when interpreted separately, making site-level prioritisation challenging. To overcome this limitation, we integrated these indices using the Preference Ranking Organization Method for Enrichment Evaluations (PROMETHEE) II multi-criteria decision analysis method, which synthesises multiple indicators into a single ranking and thus provides a transparent, reproducible basis for prioritising sites for remediation. It is important to note that this is the first study conducted in Rehova that integrates soil pollution indices and plant bioaccumulation data, which fills a critical void in Albania's post-mining environmental research.
After the mine's cessation, vegetation and soil are expected to be contaminated with heavy metals, which suggests that the Rehova's ecosystem post mine closure is still polluted. We intend to test this. The results are anticipated to contribute to the scientific literature, as well as provide recommendations to policymakers by establishing baseline contamination data in mined regions, which is critical for guiding environmentally conducive remediation.
The objective of this study is to comprehensively assess post-closure heavy metal contamination in the Rehova Mine area by combining soil and plant analyses with multimetric pollution indices. Specifically, the study quantifies the concentrations of Cu, Ni, Pb, Cr, Cd, and Zn in surface soils, evaluates contamination severity using indices such as CF, EF, Igeo, PLI, and RI, and examines bioaccumulation in Pinus spp. to explore its role as a bioindicator of metal pollution. To enable site-level prioritisation, these results are integrated using the PROMETHEE II multi-criteria decision analysis method, generating a comprehensive ranking that can guide targeted remediation and environmental management strategies.
2.1 Study area
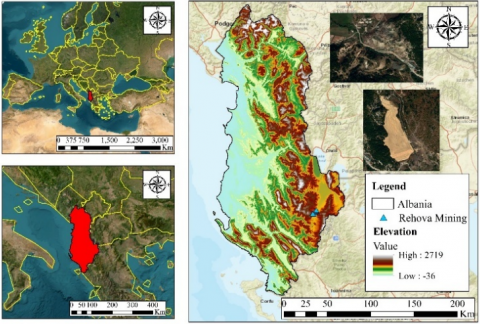
In 2011, Albania, through the UNDP-supported project “Identification and Prioritization of Environmental Hot Spots in Albania,” assessed all regions polluted by industrial activities prior to the 1990s. Among the identified hotspots, the Rehova Copper Mine in the Korça district (southeastern Albania) stands out as an understudied site (Figure 1).
Figure 1. Location map of the Rehova Copper Mine in southeastern Albania
This mine, which operated for only 11 years, produced copper concentrate with a Cu content of approximately 17.4%. The site spans an area of 100 hectares and is geographically significant, bordering North Macedonia to the northeast and Greece to the south.
Following its closure in 1990, the surrounding area has experienced increasing ecological vulnerability, despite its potential as a tourist destination post-2000.
2.2 Sampling and laboratory analysis
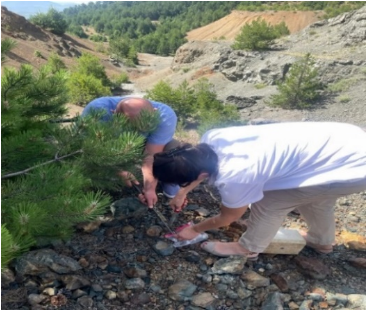
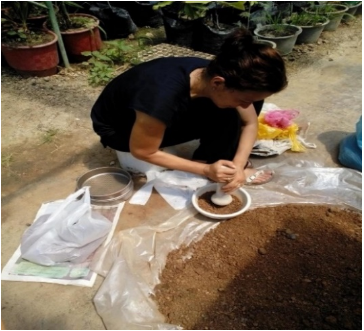
A total of sixteen (16) topsoil samples were collected in July 2023 from the Rehova Mine area at depths of 0–30 cm. Sampling was conducted at varying distances (0 m, 10 m, 100 m, and up to 10 km) from a reference point near the mine. Additionally, three pine (Pinus spp.) plant samples were collected from areas indicating early vegetation recovery (Figure 2).
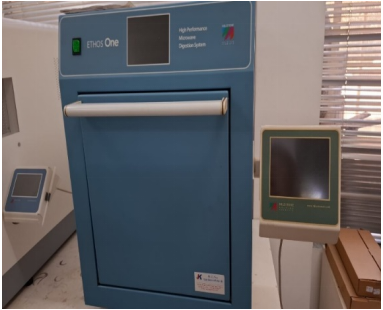
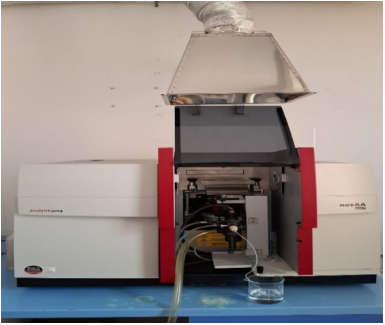
Figure 2. Field photographs showing (a) sampling of Pinus spp. near the Rehova Mine, (b) preparation of soil samples for laboratory analysis, (c) microwave digestion system for sample mineralisation, and (d) AAS unit used for heavy metal quantification
Soil samples were processed following EPA Method 3051A. Samples were air-dried, sieved through a 2 mm stainless steel mesh, and digested using aqua regia (HCl:HNO₃ = 3:1). After mineralization, samples were filtered with Whatman No. 40 filter paper, diluted with distilled water up to 100 mL, and analyzed using Atomic Absorption Spectroscopy (AAS) to determine concentrations of Cr, Cu, Pb, Ni, Zn, and Cd.
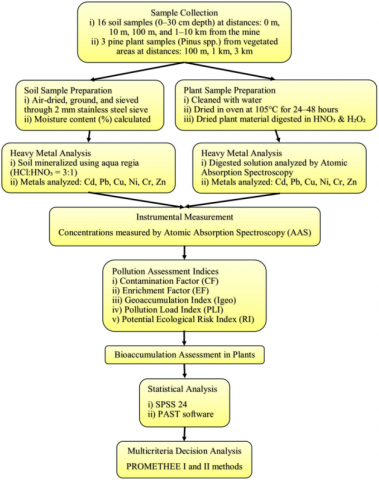
Plant samples were collected at 100 m, 1 km, and 3 km distances from the mine. The samples were transported in cold conditions, rinsed, and oven-dried at 105℃ for 24–48 hours. Dried samples were ground, and 0.1 g of material was digested using 69% HNO₃ and 30% H₂O₂ (5:1 volume ratio) at 120℃ for 8 hours. After filtration, the solutions were diluted to 30 mL, and metal concentrations were analyzed using AAS. The overall methodology adopted in this study is illustrated in the methodological flow chart (Figure 3).
Figure 3. Methodology flowchart
2.3 PROMETHEE method for multi-criteria decision analysis
The PROMETHEE method, developed by Jean-Pierre Brans in 1982, is a widely used multi-criteria decision-making technique.
PROMETHEE I provides a partial ranking, while PROMETHEE II offers a complete ranking of alternatives. Further extensions (PROMETHEE III–VI) and GAIA (Graphical Analysis for Interactive Aid) visualisations enhance its interpretability in complex decision-making contexts [24, 25].
Each alternative from a decision set A is evaluated against others based on weighted preference functions. Let a, b ∈ A be two alternatives. The preference of a over b is expressed via an outranking function π(a, b), and the following flow values are computed:
$\emptyset^{+}(a)=\frac{1}{n-1} \sum_{x \in A} \Pi(a, x)$ (1)
$\emptyset^{-}(a)=\frac{1}{n-1} \sum_{x \in A} \Pi(x, a)$ (2)
$\emptyset(a)=\emptyset^{+}(a)-\emptyset^{-}(a)$ (3)
An action $a$ is preferred over $b$ if $\emptyset(a)>\emptyset(b)$; and indifferent if $\emptyset(a)=\emptyset(b)$.
In this study, PROMETHEE II was applied to rank the sampling sites based on multimeric pollution indices. The software used was Visual PROMETHEE Academic Edition (https://bertrand.mareschal.web.ulb.be/promethee.html), which supports intuitive visualisation and ranking functionality.
2.4 Pollution assessment indices
For CF, EF, and Igeo calculations, Albanian soil background values were adopted from Gjoka et al. [26], who reported national baseline concentrations (antilog of median) for agricultural soils developed on flysch, molasse, and quaternary deposits. These values were: Cd 0.24 mg/kg, Cr 131.63 mg/kg, Cu 41.26 mg/kg, Ni 287.15 mg/kg, Pb 19.11 mg/kg, and Zn 81.80 mg/kg. The precautionary (90th percentile) values were also considered for the interpretation of contamination severity. This approach ensures that contamination assessment is referenced to local geochemical conditions rather than global averages, improving ecological relevance.
2.4.1 Pollution load index (PLI)
The PLI measures the overall level of heavy metal contamination in soil. It is computed as:
$P L I=\sqrt[n]{C F n 1 \times C F n 2 \times C F n 3 \times C F n i}$ (4)
where, CF denotes the contamination factor for each metal [27].
2.4.2 Contamination factor (CF)
The CF evaluates the contamination level of a single metal and is calculated as:
$C F=\frac{C_{\text {metal}}}{C_{\text {background}}}$ (5)
where, Cmetal is the measured concentration and Cbackground is the geochemical baseline [28].
2.4.3 Enrichment factor (EF)
EF compares the metal concentration in the sample to a reference material and is calculated as:
$E F=\frac{C / C d(\text { sample})}{C / C d(\text { background})}$ (6)
where, C is the target metal and Cd is a reference element (e.g., Fe or Al); in this study, iron (Fe) was selected as the reference element due to its conservative behaviour, low variability, and minimal anthropogenic influence in the study soils [29, 30].
2.4.4 Geoaccumulation index (Igeo)
The Igeo assesses pollution by comparing current concentrations with pre-industrial levels:
Igeo $=\log 2 \frac{C n}{1.5 B n}$ (7)
where, Cn is the measured metal concentration and Bn is the geochemical background [31, 32].
2.4.5 Potential ecological risk factor (Er) and risk index (RI)
$R I=\sum E r=\sum \operatorname{Tr} \times C F$ (8)
According to study [33], Tr indicates each metal's toxicological response factor, whereas Er denotes the potential ecological risk factor associated with that particular metal. The contamination factor (CF) for any metal is known. The evaluation criterion for the toxicity of heavy metals was selected according to the standardized data of study [28]: Cd=30, Cu=5, Pb=5, Ni=5, Cr=2, and Zn=1.
$R I=\sum E r$ (9)
RI evaluates the combined risk posed by all metals at a site.
2.4.6 Bioaccumulation coefficient (BFC)
To assess plant uptake of metals, the bioaccumulation coefficient is computed as:
$B F C=\frac{{Cplant}}{{Csoil}}$ (10)
where, Cplant is the metal concentration in plant tissue and Csoil is that in the corresponding soil sample [34].
The classification ranges and corresponding contamination levels for all pollution indices (PLI, CF, EF, Igeo, Er, and RI) described in the above subsections are summarized in Table A1 for reference.
2.5 Statistical analysis
Statistical analyses were conducted using SPSS 24 and PAST 5 software. Spearman correlation was used to determine relationships between heavy metal concentrations in soil and plants. Principal Component Analysis (PCA) and Pearson correlation were performed in PAST to identify pollution sources and inter-metal relationships.
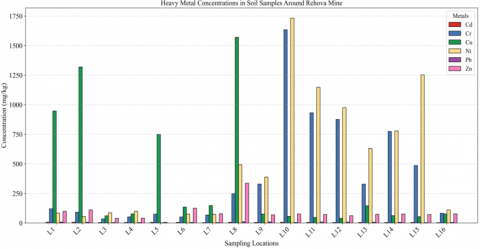
Heavy metal concentrations in soil samples collected from 16 locations around the Rehova Mine exhibited notable spatial variability (Table 1 and Figure 4). Copper levels were highest at L8 (1571 mg/kg), while nickel peaked at L10 (1732.54 mg/kg), which also recorded the maximum chromium concentration (1634.19 mg/kg) [17, 18].
Table 1. Heavy metal results from the Rehova Mine [17, 18]
|
Sampling Locations |
Cd |
Cr |
Cu |
Ni |
Pb |
Zn |
|
mg/kg |
mg/kg |
mg/kg |
mg/kg |
mg/kg |
mg/kg |
|
|
L1 |
7.55 |
120.42 |
947.73 |
84.02 |
7.50 |
99.59 |
|
L2 |
6.88 |
91.44 |
1319.85 |
54.87 |
6.72 |
111.36 |
|
L3 |
3.86 |
34.62 |
60.87 |
87.22 |
3.36 |
39.40 |
|
L4 |
4.40 |
52.06 |
77.48 |
99.70 |
3.71 |
41.44 |
|
L5 |
5.53 |
74.84 |
750.03 |
1.95 |
5.31 |
0 |
|
L6 |
5.02 |
51.19 |
135.15 |
75.55 |
4.93 |
125.26 |
|
L7 |
3.26 |
67.56 |
148.14 |
73.12 |
3.62 |
78.73 |
|
L8 |
6.36 |
249.20 |
1571.00 |
492.80 |
10.96 |
336.41 |
|
L9 |
4.77 |
329.55 |
75.70 |
388.27 |
9.43 |
69.07 |
|
L10 |
6.42 |
1634.19 |
56.60 |
1732.54 |
4.39 |
76.98 |
|
L11 |
5.16 |
932.10 |
47.05 |
1147.71 |
8.70 |
72.12 |
|
L12 |
4.72 |
875.99 |
39.88 |
974.06 |
8.14 |
61.44 |
|
L13 |
4.96 |
328.84 |
145.90 |
630.72 |
6.44 |
73.96 |
|
L14 |
4.33 |
774.17 |
62.22 |
778.59 |
6.51 |
76.69 |
|
L15 |
4.33 |
486.30 |
53.38 |
1252.56 |
2.96 |
71.82 |
|
L16 |
3.05 |
82.47 |
76.98 |
111.03 |
5.07 |
77.30 |
Figure 4. Grouped bar chart illustrating the concentrations of six heavy metals (Cd, Cr, Cu, Ni, Pb, Zn) in soil samples
In contrast, cadmium, lead, and zinc concentrations remained relatively low across most sites, with the minimum cadmium value observed at L16 (3.05 mg/kg) and undetectable zinc levels at L5 [17, 18]. These patterns indicate potential contamination hotspots, particularly near L8 and L10.
The geoaccumulation index (Igeo) values (Table 2) further confirmed intense contamination by copper and nickel. Location L8 recorded the highest Igeo for Cu at 5.388, placing it in the “extremely contaminated” category (Igeo > 5), while L10, L11, and L15 showed strong to extreme contamination for nickel (Igeo between 4.12 and 4.71).
Table 2. Geoaccumulation index values of metals in the Rehova Mine
|
Igeo_Cd |
Igeo_Cr |
Igeo_Cu |
Igeo_Ni |
Igeo_Pb |
Igeo_Zn |
|
-4.28 |
-0.08 |
4.66 |
0.35 |
-1.76 |
-0.10 |
|
-4.42 |
-0.48 |
5.14 |
-0.27 |
-1.92 |
0.06 |
|
-5.25 |
-1.88 |
0.70 |
0.40 |
-2.92 |
-1.43 |
|
-5.06 |
-1.29 |
1.047 |
0.60 |
-2.78 |
-1.36 |
|
-4.73 |
-0.77 |
4.32 |
-5.08 |
-2.26 |
0 |
|
-4.87 |
-1.32 |
1.85 |
0.20 |
-2.37 |
0.23 |
|
-5.50 |
-0.92 |
1.98 |
0.15 |
-2.82 |
-0.44 |
|
-4.53 |
0.97 |
5.39 |
2.90 |
-1.22 |
1.66 |
|
-4.94 |
1.37 |
1.01 |
2.55 |
-1.44 |
-0.6 |
|
-4.52 |
3.68 |
0.59 |
4.71 |
-2.54 |
-0.47 |
|
-4.83 |
2.87 |
0.33 |
4.12 |
-1.55 |
-0.56 |
|
-4.96 |
2.78 |
0.09 |
3.88 |
-1.65 |
-0.79 |
|
-4.89 |
1.37 |
1.96 |
3.26 |
-1.98 |
-0.53 |
|
-5.09 |
2.60 |
0.73 |
3.56 |
-1.97 |
-0.47 |
|
-5.086 |
1.93 |
0.51 |
4.25 |
-3.17 |
-0.57 |
|
-5.59 |
-0.63 |
1.04 |
0.75 |
-2.33 |
-0.46 |
In contrast, cadmium, lead, and zinc exhibited negative Igeo values in most locations, suggesting these elements were within natural background levels.
Pollution load index (PLI) results in Table 3 revealed that 14 of the 16 locations had PLI values above 1, indicating significant overall pollution. The highest PLI was found at L8 (5.86), followed by L10 (3.82) and L11 (3.37). Locations L3 and L5 had values below 1 (0.97 and 0.00, respectively), reflecting minimal cumulative contamination.
Table 3. Pollution load index (PLI) values in the monitoring area in the Rehova Mine
|
|
L1 |
L2 |
L3 |
L4 |
L5 |
L6 |
L7 |
L8 |
L9 |
L10 |
L11 |
L12 |
L13 |
L14 |
L15 |
L16 |
|
PLI |
2.80 |
2.59 |
0.97 |
1.16 |
0 |
1.56 |
1.35 |
5.86 |
2.54 |
3.82 |
3.37 |
2.99 |
2.94 |
3.0 |
2.54 |
1.40 |
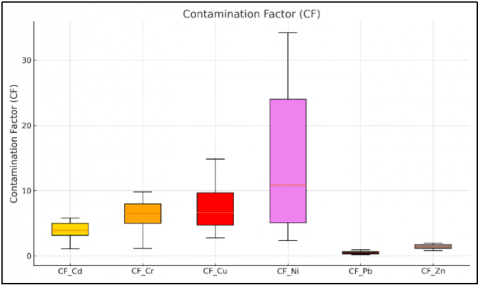
Contamination factors (CF) presented in Table 4 and illustrated in Figure 5 demonstrate severe pollution, particularly from Cu and Ni. The CF for copper at L8 was exceptionally high (62.84), while nickel reached its peak at L10 (39.38). Chromium also presented high CF values at several locations, especially L10 (19.22). In contrast, lead and zinc showed relatively low contamination factors throughout, with Pb CF as low as 0.17 and Zn CF as low as 0.0 at L5.
Table 4. Contamination factor (CF) values at locations in the Rehova Mine monitoring area
|
Sampling Locations |
CF-Cd |
CF-Cr |
CF-Cu |
CF-Ni |
CF-Pb |
CF-Zn |
|
L1 |
7.70 |
1.42 |
37.91 |
1.91 |
0.44 |
1.40 |
|
L2 |
7.02 |
1.08 |
52.79 |
1.25 |
0.40 |
1.57 |
|
L3 |
3.94 |
0.41 |
2.44 |
1.98 |
0.20 |
0.56 |
|
L4 |
4.49 |
0.61 |
3.10 |
2.27 |
0.22 |
0.58 |
|
L5 |
5.64 |
0.88 |
30.00 |
0.04 |
0.31 |
0 |
|
L6 |
5.12 |
0.60 |
5.41 |
1.72 |
0.29 |
1.76 |
|
L7 |
3.32 |
0.80 |
5.93 |
1.66 |
0.21 |
1.11 |
|
L8 |
6.49 |
2.93 |
62.84 |
11.20 |
0.64 |
4.74 |
|
L9 |
4.87 |
3.88 |
3.03 |
8.82 |
0.55 |
0.97 |
|
L10 |
6.56 |
19.23 |
2.26 |
39.38 |
0.26 |
1.08 |
|
L11 |
5.26 |
10.97 |
1.88 |
26.08 |
0.51 |
1.02 |
|
L12 |
4.81 |
10.31 |
1.60 |
22.14 |
0.48 |
0.86 |
|
L13 |
5.06 |
3.87 |
5.84 |
14.34 |
0.38 |
1.04 |
|
L14 |
4.42 |
9.11 |
2.49 |
17.70 |
0.38 |
1.08 |
|
L15 |
4.42 |
5.72 |
2.14 |
28.47 |
0.17 |
1.01 |
|
L16 |
3.11 |
0.97 |
3.08 |
2.52 |
0.30 |
1.09 |
Figure 5. Boxplot of contamination factor (CF) for each metal
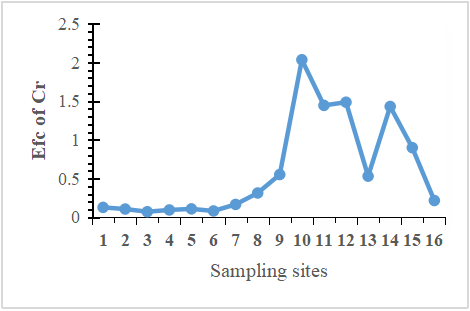
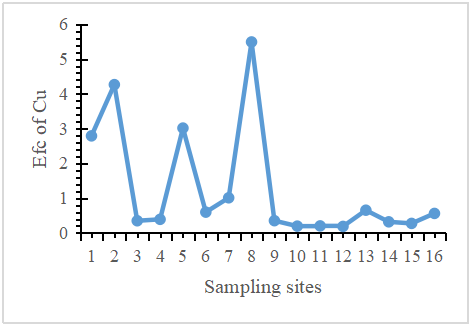
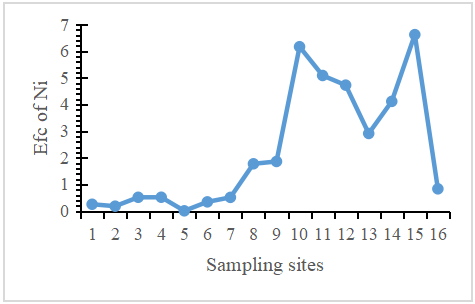
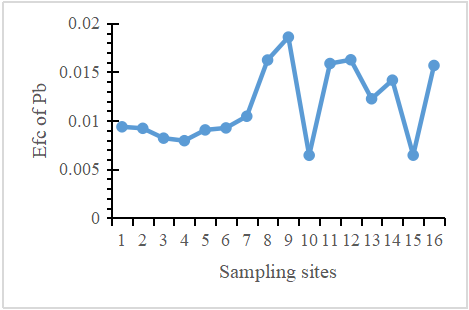
Figure 6. Enrichment factor (EF) values for heavy metals in the study area
The enrichment factor (EF), which distinguishes anthropogenic from natural contributions, indicated significant enrichment for nickel and copper at certain sites (Figure 6). Nickel displayed EF > 5 at L10, L11, and L15, with values as high as 6.67. Copper also showed moderate to significant enrichment (EF > 2) at L8, L9, and L13. Other metals like Cr, Pb, and Zn had EF values mostly below 2, suggesting minimal anthropogenic influence and a more geogenic origin.
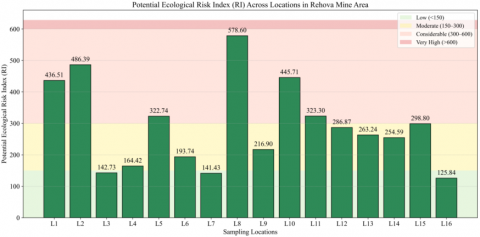
The ecological risk posed by heavy metals in the Rehova Mine area was assessed using the potential ecological risk index (RI), calculated based on Hakanson’s method. The RI values, as summarised in Table A2, ranged from a minimum of 125.84 at L16 to a maximum of 578.60 at L8, indicating spatial variability in pollution levels. As visualised in Figure 7, six sites, i.e., L1, L2, L5, L8, L10, and L11, fall within the “considerable risk” category (RI between 300 and 600), while L3, L7, and L16 were categorised as “low risk” (RI < 150).
Figure 7. Bar plot illustrating the potential ecological risk index (RI) for heavy metals across 16 sampling locations in the Rehova Mine area
Notably, no site crossed the high-risk threshold (RI ≥ 600), although L8 was close.
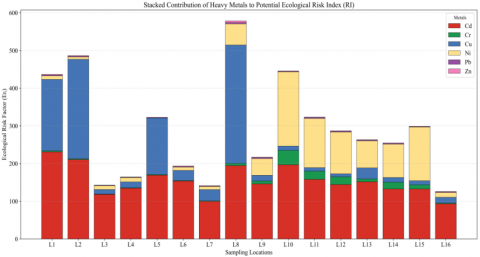
Further insight into the composition of risk at each site is provided in Figure 8, which displays a stacked bar chart of ecological risk factors (Erᵢ) per metal. Among all metals, cadmium (Cd) was the dominant contributor to RI in most locations, primarily due to its high toxic response factor (Tr = 30). For instance, Cd alone contributed Erᵢ = 230.96 at L1, representing more than 50% of the total RI there.
Figure 8. Stacked bar chart showing the contribution of individual heavy metals to the potential ecological risk index (RI) across 16 sampling locations in the Rehova Mine area
Copper (Cu) and nickel (Ni) also contributed significantly to the total ecological risk at locations L2, L5, L8, and L10, where mining-related contamination is evident. In contrast, zinc (Zn) and lead (Pb) showed minimal contributions across all sites.
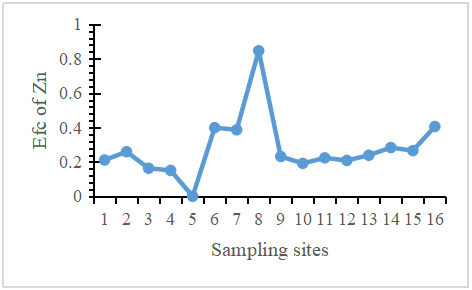
Bioaccumulation studies revealed that pine trees near the mine site absorbed certain metals to varying degrees (Tables 5 and 6). Lead showed the highest bioaccumulation across all distances, with values >1 at 100 m (2.25), 1 km (2.79), and 3 km (0.91), classifying it as a hyperaccumulator.
Table 5. Concentration of metals in soil and plants at different distances
|
Distance |
Metal |
Soil (mg/kg) |
Plant (mg/kg) |
|
100 m |
Cd |
5.02 |
0.55 |
|
Cr |
51.19 |
9.39 |
|
|
Cu |
135.15 |
21.80 |
|
|
Pb |
4.93 |
10.10 |
|
|
Zn |
125.26 |
37.64 |
|
|
1 km |
Cd |
3.26 |
0.45 |
|
Cr |
67.56 |
10.36 |
|
|
Cu |
148.14 |
27.14 |
|
|
Pb |
3.62 |
8.63 |
|
|
Zn |
78.73 |
30.14 |
|
|
3 km |
Cd |
4.78 |
1.11 |
|
Cr |
329.55 |
14.51 |
|
|
Cu |
75.7 |
25.54 |
|
|
Pb |
9.43 |
11.10 |
|
|
Zn |
69.07 |
40.7 |
Table 6. Coefficient of bioaccumulation for the values of metals in plants and soil
|
Distance |
Cd |
Cr |
Cu |
Pb |
Zn |
|
100 m |
0.22 |
0.28 |
0.19 |
2.25 |
0.32 |
|
1 km |
0.17 |
0.14 |
0.15 |
2.79 |
0.48 |
|
3 km |
0.09 |
0.03 |
0.36 |
0.92 |
0.44 |
Cadmium and copper showed their highest uptake at 100 m (BFC = 0.22 and 0.19, respectively), indicating proximity to the source increased accumulation. Chromium was least bioavailable, with the lowest BFC (0.031) at 3 km.
To better understand soil–plant transfer, Spearman correlation analysis was conducted (Table 7). A perfect positive correlation (r = 1, p < 0.001) was observed for zinc, suggesting efficient and linear soil-to-plant translocation. Conversely, copper showed a strong negative correlation (r = –1, p < 0.001), implying possible suppression of uptake due to phytotoxicity.
Table 7. Spearman correlation between heavy metals in soil and plants
|
Metal |
Spearman Coefficient |
p-value |
Statistical Significance |
|
Cd |
0.5 |
0.6667 |
|
|
Cr |
-0.5 |
0.6667 |
|
|
Cu |
-1 |
0 |
*** |
|
Pb |
-0.5 |
0.6667 |
|
|
Zn |
1 |
0 |
*** |
|
*** (p < 0.001) – highly significant |
|||
Moderate but non-significant correlations were observed for cadmium (positive) and for chromium and lead (negative), possibly influenced by plant species traits and soil pH.
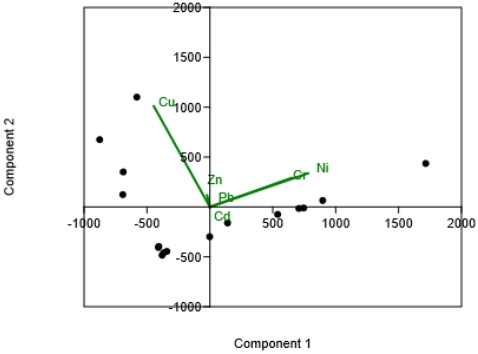
Principal component analysis (Figure 9) revealed that copper was the dominant contributor to data variance, with the longest vector in the biplot. Nickel and chromium appeared closely aligned, indicating a common source, likely mining operations. Zinc, lead, and cadmium were more scattered, pointing to distinct geochemical behaviours and potentially mixed origins.
Figure 9. Principal component analysis (PCA) for heavy metals in soil samples in the studied area
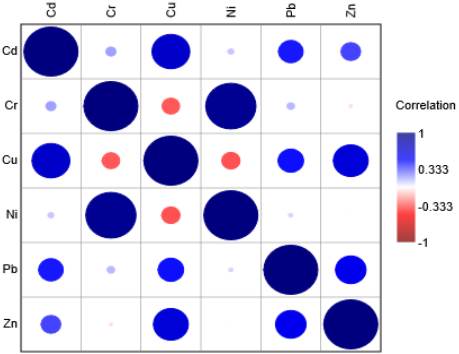
Figure 10. Analysis of the correlation of the Pearson between heavy metals in the soil in the study area
Pearson correlation (Figure 10) supported these findings, showing strong positive associations between Cd, Cu, Zn, and Ni, suggesting co-occurrence and possibly similar anthropogenic inputs. Chromium was less correlated with the others, indicating different geochemical pathways or sources.
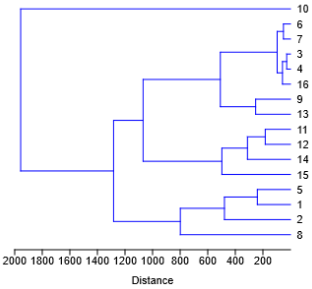
Figure 11. Hierarchical cluster analysis of the surveyed locations based on the concentrations of heavy metals in the soil
Hierarchical cluster analysis (Figure 11) categorised the 16 sampling sites into three main clusters. Cluster I included highly polluted sites (L1, L2, L5, L8), while Cluster II comprised moderately polluted sites (L11–L15). The third cluster (L3, L4, L6, L7, L10, L16) grouped sites with comparatively lower heavy metal burdens. Interestingly, although L10 and L8 showed extreme values for individual metals, their overall pollution profiles varied, likely due to differences in pollutant combinations or interactions.
Table 8. Ranking of the analyzed locations regarding the pollution
|
Rank |
Location |
Φ (Net Flow) |
Φ⁺ (Positive Flow) |
Φ⁻ (Negative Flow) |
|
1 |
L3 |
0.711 |
0.856 |
0.144 |
|
2 |
L4 |
0.422 |
0.711 |
0.289 |
|
3 |
L7 |
0.333 |
0.667 |
0.333 |
|
4 |
L5 |
0.244 |
0.622 |
0.378 |
|
5 |
L16 |
0.222 |
0.611 |
0.389 |
|
6 |
L15 |
0.211 |
0.600 |
0.389 |
|
7 |
L6 |
0.089 |
0.544 |
0.456 |
|
8 |
L12 |
–0.022 |
0.489 |
0.511 |
|
9 |
L14 |
–0.078 |
0.456 |
0.533 |
|
10 |
L9 |
–0.089 |
0.456 |
0.544 |
|
11 |
L13 |
–0.156 |
0.422 |
0.578 |
|
12 |
L11 |
–0.267 |
0.367 |
0.633 |
|
13 |
L2 |
–0.289 |
0.356 |
0.644 |
|
14 |
L10 |
–0.311 |
0.344 |
0.656 |
|
15 |
L1 |
–0.378 |
0.311 |
0.689 |
|
16 |
L8 |
–0.644 |
0.178 |
0.822 |
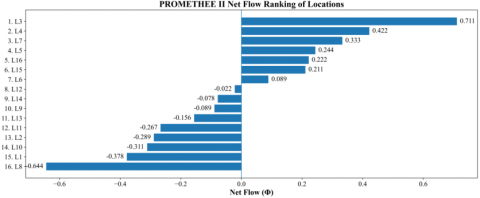
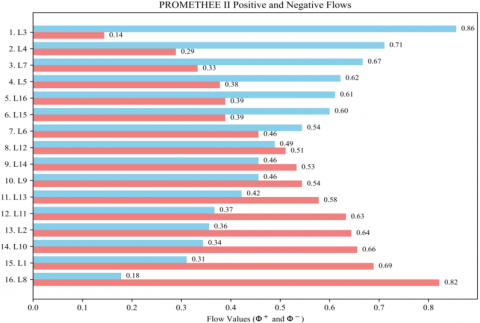
To synthesise site performance, the PROMETHEE II ranking (Table 8 and Figure 12(a)) was applied. L3 ranked highest overall (Φ = 0.7111), followed by L4 and L7. Surprisingly, L8, despite its high pollution loads in individual indices, ranked lowest (Φ = –0.6444), suggesting that its impact may be spatially or chemically localised. The breakdown of positive and negative flow values for each location (Figure 12(b)) further highlights the contribution of each component to the overall ranking, with L3 showing the highest Φ⁺ (0.856) and lowest Φ⁻ (0.144), while L8 recorded the inverse pattern.
Figure 12. (a) PROMETHEE II Net Flow ranking of the studied locations, (b) PROMETHEE II Positive (Φ⁺) and Negative (Φ⁻) flow values for each location
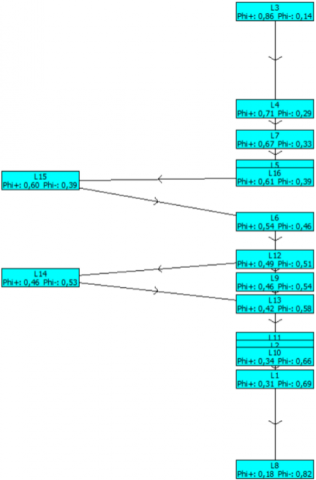
The partial ranking and proximity relationships between locations derived from PROMETHEE I analysis are shown in Figure 13, illustrating the relative dominance and similarity patterns among sites. This finding underscores the importance of using composite decision-making tools that account for multidimensional data.
Figure 13. Visual presentation of the location rankings
4.1 Summary
The results from this study at the Rehova Mine clearly demonstrate high levels of heavy metal pollution, particularly for Cu, Ni, and Cd. Based on the calculated pollution indices, these metals are present at concentrations considered highly toxic by international standards [17, 18]. For instance, WHO/FAO permissible limits for agricultural soils are Cu (100 mg/kg), Ni (50 mg/kg), Pb (60 mg/kg), Cr (100 mg/kg), Zn (300 mg/kg), and Cd (3 mg/kg). Maximum concentrations measured in this study were substantially higher. Cu reached 452 mg/kg at L8 (4.5 times the limit), Ni exceeded 600 mg/kg at L10 (over 12 times the limit), and Cd crossed the 3 mg/kg threshold at several sites. These exceedances confirm severe contamination and underline the ecological and human health risks. Similar findings have been reported in Albania [26, 35] and neighbouring countries such as Kosovo [36-41] and North Macedonia [42, 43], where elevated heavy metal concentrations in soils near metallurgical and other industrial activities have been recorded.
Globally, similar patterns have been documented near metallurgical industries [22, 44-51]. The pollution load index (PLI) indicated significant contamination (PLI > 1) in most localities, with the highest value of 5.86 recorded at L8, confirming severe pollution and aligning with reports from other industrialised regions where PLI values often exceed 3 near pollution sources [52-56].
Contamination factor (CF) analysis further highlighted extremely high values for Cu, Ni, and Cr, with Cu reaching 62.84, far exceeding the critical limit of CF > 6 [28]. These values surpass those reported by the studies [57, 58] and, while higher CFs for Ni, Cd, and Pb have been documented near railways in Iran [59], the magnitude of Cu contamination at Rehova remains particularly notable.
Enrichment factor (EF) results reinforce these observations, with Ni showing EF > 5 in three locations and Cu in one location, consistent with findings from studies [60-62]. The potential ecological risk index (RI) revealed considerable risk (RI > 300) in six locations, a pattern consistent with the findings of the study [63].
Bioaccumulation analysis confirmed Pinus spp. as a hyperaccumulator for Pb (BFC > 1), consistent with findings of studies [45, 56, 64-66]. Spearman correlation analysis showed a strong positive relationship for Zn, in line with its known physiological role in plants [19, 67-69], and a negative relationship for Cu, consistent with its phytotoxic impacts [70-73].
4.2 Interpretation
Overall, the multi-index assessment confirms that Cu, Ni, and Cd are the dominant pollutants in the Rehova mining area, posing significant ecological risks as revealed through CF, EF, PLI, RI, and bioaccumulation indices. The integration of PROMETHEE II ranking provides a comprehensive, multidimensional view of site performance, highlighting L8 as the most severely impacted despite variability in individual indices. Extreme Igeo and CF values, which indicate extremely high Cu and Ni contamination and significant ecological risk (RI > 300), are the main causes of L8's poor performance. Because of its downslope location close to drainage convergence, metal accumulation from surface runoff is probably made easier, which increases the severity of pollution. L3, on the other hand, ranks highest because most contamination indices stay close to background (CF ≈ 1, low EF and RI), and because of its greater distance from the mine, upslope location, and vegetation cover, which all help to reduce pollutant deposition. Thus, both contamination intensity and spatial controls are captured in the PROMETHEE results, with ranking patterns that are influenced by local terrain effects but generally consistent with distance from the source.
The identification of Pinus spp. as an effective bioindicator for Pb contamination up to 1 km from the pollution source is a novel contribution for this region, with practical implications for long-term biomonitoring. The high BFC of Pb reflects its greater mobility and root adsorption, enabling efficient uptake by Pinus spp., whereas the low and negatively correlated BFC of Cu likely results from strong soil binding and plant homeostatic control that restricts uptake under excess concentrations.
Comparisons with national, regional, and global studies confirm that the contamination levels at Rehova are among the highest reported for similar post-mining landscapes, reinforcing the need for targeted remediation and ongoing monitoring.
4.3 Limitations
This study, while comprehensive, is limited by its temporal scope, as sampling was conducted only in July 2023, providing a single-season perspective without capturing potential seasonal variability in metal concentrations and bioavailability. The analysis was restricted to six heavy metals (Cd, Cr, Cu, Ni, Pb, Zn), excluding other potentially harmful elements such as arsenic and mercury.
Bioaccumulation was assessed solely in Pinus spp. at three distances, which, while valuable, do not provide a full picture of interspecies differences in uptake potential.
The baseline values used for CF, EF, and Igeo calculations may vary across microhabitats, introducing some uncertainty into the results. Additionally, the PROMETHEE analysis was applied only to pollution indices; incorporating socio-economic and land-use data could yield a more holistic site prioritisation for remediation planning.
4.4 Future scope
Future research should incorporate multi-season monitoring to assess temporal changes in heavy metal concentrations and plant uptake patterns. Expanding the scope of metal analysis to include a broader range of contaminants, such as arsenic and mercury, would allow for a more complete pollution profile. Bioaccumulation studies should be extended to multiple plant species with varying uptake capacities to identify candidates for phytoremediation.
Field trials using soil amendments, phytoremediation, or other remediation techniques could be implemented to test their effectiveness in reducing metal mobility. Integrating remote sensing and geospatial modelling with PROMETHEE outputs could provide spatially explicit contamination maps to guide management actions.
Finally, comparative studies between post-mining landscapes in Albania and similar sites worldwide could help identify and adapt best practices for ecological rehabilitation.
The multimetric index assessments conducted in this study identify Cu, Ni, and Cd as the dominant heavy metals posing the greatest ecological risk in the Rehova Mine area, with risk levels ranging from moderate to high.
Bioaccumulation analysis of Pinus spp. revealed elevated accumulation of Pb within a 1 km radius of the site, confirming the species’ potential as an effective bioindicator of lead pollution in post-mining environments. Given the scarcity of integrated assessments combining soil pollution indices and plant bioaccumulation in Albania’s post-mining landscapes, this study fills a critical gap in environmental monitoring for the region. The integration of the PROMETHEE II multi-criteria decision analysis method further enhances the utility of this work by ranking sites based on multiple contamination indicators, thereby providing a practical prioritisation tool for environmental management and targeted remediation planning.
The results underscore the urgent need for targeted rehabilitation interventions and the development of a strategic management plan to address the severe pollution originating from the Rehova Mine, historically recognised for its copper production. Without prompt action, the ecological and biological impacts of these contamination levels may persist or intensify, further degrading the surrounding ecosystem.
Table A1. Classification range of pollution indices according to their respective values
|
|
Index Value |
Contamination Level |
References |
|
Pollution load index (PLI) |
PLI = 0 PLI = 1 PLI > 1 |
Denotes an ideal condition of no pollution Denotes the presence of merely baseline levels of pollutants Denotes the site's ongoing deterioration |
[26] |
|
Contamination factor (CF) |
CF ˂ 1 (class 1), 1 ≤ CF < 3 (class 2), 3 ≤ CF < 6 (class 3) and CF ≥ 6 (class 4). |
Low contamination factor Moderate contamination factor Considerable contamination factor Very high contamination factor |
[27, 74] |
|
Enrichment Factor (EF) |
<2-minimal; 2–5- moderate; 5–20- substantial; 20–40- very high; and >40 - extremely high. |
Deficiency to minimal enrichment Moderate enrichment Significant enrichment Very high enrichment Extremely high enrichment |
[28, 29] |
|
Geoaccumulation index (Igeo) |
Igeo ≤ 0 0 < Igeo < 1 1< Igeo < 2 2 < Igeo < 3 3 < Igeo< 4 4 < Igeo< 5 5 < Igeo |
Uncontaminated Uncontaminated/moderately contaminated Moderately contaminated Moderately/strongly contaminated Strongly contaminated Strongly/extremely contaminated Extremely contaminated |
[75] |
|
Potential ecological risk factor (Eif) |
RI < 150 150 ≤ RI < 300 80 ≤ Er < 160 160 ≤ Er < 320 Er ≥ 320 |
Low risk, Moderate risk, Considerable risk, High risk, Very high risk |
[76] |
|
Potential ecological risk index (RI) |
RI < 150 150 ≤ RI < 300 300 ≤ RI < 600 RI ≥ 600 |
Low risk Moderate risk Considerable risk High risk |
[77] |
Table A2. Potential ecological risk factors and possible environmental risk indices of heavy metals in the studied area of the Rehova Mine
|
Potential Ecological Risk Factor |
|||||||
|
Sampling Locations |
Cd |
Cr |
Cu |
Ni |
Pb |
Zn |
Potential Ecological Risk Index (RI) |
|
L1 |
230.97 |
2.83 |
189.55 |
9.55 |
2.21 |
1.40 |
436.51 |
|
L2 |
210.49 |
2.15 |
263.97 |
6.24 |
1.98 |
1.57 |
486.39 |
|
L3 |
118.29 |
0.81 |
12.17 |
9.91 |
0.99 |
0.56 |
142.73 |
|
L4 |
134.70 |
1.22 |
15.50 |
11.33 |
1.09 |
0.58 |
164.42 |
|
L5 |
169.19 |
1.76 |
150.00 |
0.22 |
1.56 |
0 |
322.74 |
|
L6 |
153.70 |
1.20 |
27.03 |
8.58 |
1.45 |
1.76 |
193.74 |
|
L7 |
99.74 |
1.59 |
29.63 |
8.31 |
1.06 |
1.11 |
141.43 |
|
L8 |
194.57 |
5.86 |
314.20 |
56.00 |
3.22 |
4.74 |
578.60 |
|
L9 |
146.14 |
7.75 |
15.14 |
44.12 |
2.77 |
0.97 |
216.90 |
|
L10 |
196.68 |
38.45 |
11.32 |
196.88 |
1.29 |
1.08 |
445.71 |
|
L11 |
157.96 |
21.93 |
9.41 |
130.42 |
2.56 |
1.02 |
323.30 |
|
L12 |
144.34 |
20.61 |
7.98 |
110.69 |
2.39 |
0.86 |
286.87 |
|
L13 |
151.71 |
7.74 |
29.18 |
71.67 |
1.90 |
1.04 |
263.24 |
|
L14 |
132.46 |
18.22 |
12.44 |
88.48 |
1.91 |
1.08 |
254.59 |
|
L15 |
132.46 |
11.44 |
10.68 |
142.34 |
0.87 |
1.012 |
298.80 |
|
L16 |
93.31 |
1.94 |
15.40 |
12.62 |
1.49 |
1.09 |
125.84 |
[1] Haghighizadeh, A., Rajabi, O., Nezarat, A., Hajyani, Z., Haghmohammadi, M., Hedayatikhah, S., Asl, S.D., Beni, A.A. (2024). Comprehensive analysis of heavy metal soil contamination in mining Environments: Impacts, monitoring Techniques, and remediation strategies. Arabian Journal of Chemistry, 17(6): 105777. https://doi.org/10.1016/j.arabjc.2024.105777
[2] Dehkordi, M.M., Nodeh, Z.P., Dehkordi, K.S., Khorjestan, R.R., Ghaffarzadeh, M. (2024). Soil, air, and water pollution from mining and industrial activities: Sources of pollution, environmental impacts, and prevention and control methods. Results in Engineering, 23: 102729. https://doi.org/10.1016/j.rineng.2024.102729
[3] Shiquan, D., Amuakwa-Mensah, F., Deyi, X., Yue, C., Yue, C. (2022). The impact of mineral resource extraction on communities: How the vulnerable are harmed. The Extractive Industries and Society, 10: 101090. https://doi.org/10.1016/j.exis.2022.101090
[4] Xiong, Y., Guo, H., Nor, D.D.M.M., Song, A., Dai, L. (2023). Mineral resources depletion, environmental degradation, and exploitation of natural resources: COVID-19 aftereffects. Resources Policy, 85: 103907. https://doi.org/10.1016/j.resourpol.2023.103907
[5] Angon, P.B., Islam, M.S., Das, A., Anjum, N., Poudel, A., Suchi, S.A. (2024). Sources, effects and present perspectives of heavy metals contamination: Soil, plants and human food chain. Heliyon, 10(7): e28357. https://doi.org/10.1016/j.heliyon.2024.e28357
[6] Kanwar, V.S., Sharma, A., Srivastav, A.L., Rani, L. (2020). Phytoremediation of toxic metals present in soil and water environment: a critical review. Environmental Science and Pollution Research, 27(36): 44835-44860. https://doi.org/10.1007/s11356-020-10713-3
[7] Rai, P.K., Lee, S.S., Zhang, M., Tsang, Y.F., Kim, K.H. (2019). Heavy metals in food crops: Health risks, fate, mechanisms, and management. Environment International, 125: 365-385. https://doi.org/10.1016/j.envint.2019.01.067
[8] Dane, H., Şi̇şman, T. (2020). A morpho-histopathological study in the digestive tract of three fish species influenced with heavy metal pollution. Chemosphere, 242: 125212. https://doi.org/10.1016/j.chemosphere.2019.125212
[9] Guzzi, G., Ronchi, A., Pigatto, P. (2021). Toxic effects of mercury in humans and mammals. Chemosphere, 263: 127990. https://doi.org/10.1016/j.chemosphere.2020.127990
[10] Mehmood, M.A., Qadri, H., Bhat, R.A., Rashid, A., Ganie, S.A., Dar, G.H. (2019). Heavy metal contamination in two commercial fish species of a trans-Himalayan freshwater ecosystem. Environmental Monitoring and Assessment, 191(2): 104. https://doi.org/10.1007/s10661-019-7245-2
[11] Zaynab, M., Al-Yahyai, R., Ameen, A., Sharif, Y., Ali, L., Fatima, M., Khan, K.A., Li, S. (2022). Health and environmental effects of heavy metals. Journal of King Saud University-Science, 34(1): 101653. https://doi.org/10.1016/j.jksus.2021.101653
[12] Li, A., Zhou, S. (2024). Role of mineral-based industrialization in promoting economic growth: Implications for achieving environmental sustainability through financial management. Resources Policy, 92: 105020. https://doi.org/10.1016/j.resourpol.2024.105020
[13] Lodhia, S.K. (2018). Mining and Sustainable Development: Current Issues. Routledge & CRC Press.
[14] Liu, J., Liu, G., Ma, Z., Chen, F., Wu, Y., Ge, C., Wang, X. (2024). Evaluation of geoenvironment carrying capacity in mineral resource-based cities from the perspective of sustainable development. Sustainability, 16(18): 7934. https://doi.org/10.3390/su16187934
[15] Zaehringer, J.G., Michelotti, M., Andriambalohary, M., Rajerison, F., Rakotoarinosy, A., Eckert, S., Ramamonjisoa, B., Andriamihaja, O.R. (2024). How are large-scale extractive industries affecting progress toward the sustainable development goals in Madagascar? Perceived social-ecological impacts of mining investments. Current Research in Environmental Sustainability, 8: 100257. https://doi.org/10.1016/j.crsust.2024.100257
[16] Haddaway, N.R., Cooke, S.J., Lesser, P., Macura, B., Nilsson, A.E., Taylor, J.J., Raito, K. (2019). Evidence of the impacts of metal mining and the effectiveness of mining mitigation measures on social–ecological systems in Arctic and boreal regions: A systematic map protocol. Environmental Evidence, 8(1): 9. https://doi.org/10.1186/s13750-019-0152-8
[17] Dollani, A., Sallaku, F., Shkurta, E., Shallari, S. (2024). Hot spot of Rehova in Albania through sustainable development. Macedonian Geographical Society, pp. 129-133. https://doi.org/10.37658/MGD24129d
[18] Dollani, A., Shkurta, E., Sallaku, F., Shallari, S. (2024). Evaluating heavy metal contamination in the Rehova Cu-mine area for sustainable soil management. In: Lorencowicz, E., Huyghebaert, B., Uziak, J. (eds) Farm Machinery and Processes Management in Sustainable Agriculture. FMPMSA 2024. Lecture Notes in Civil Engineering, vol 609. Springer, Cham. https://doi.org/10.1007/978-3-031-70955-5_14
[19] Hassan, M.U., Nawaz, M., Mahmood, A., Shah, A.A., Shah, A.N., Muhammad, F., Batool, M., Rasheed, A., Jaremko, M., Abdelsalam, N.R., Hasan, M.E., Qari, S.H. (2022). The role of zinc to mitigate heavy metals toxicity in crops. Frontiers in Environmental Science, 10: 990223. https://doi.org/10.3389/fenvs.2022.990223
[20] Saravanan, P., Saravanan, V., Rajeshkannan, R., Arnica, G., Rajasimman, M., Baskar, G., Pugazhendhi, A. (2024). Comprehensive review on toxic heavy metals in the aquatic system: Sources, identification, treatment strategies, and health risk assessment. Environmental Research, 258: 119440. https://doi.org/10.1016/j.envres.2024.119440
[21] Afifudin, A.F.M., Pramesti, H.N., Irawanto, R., Sari, A., Soegianto, A., Affandi, M., Payus, C.M. (2025). Spatial distribution and risk assessment of heavy metal contamination in Western Madura Strait Sediments. Results in Engineering, 26: 105157. https://doi.org/10.1016/j.rineng.2025.105157
[22] Chen, Y., Hu, Z., Bai, H., Shen, W. (2022). Variation in road dust heavy metal concentration, pollution, and health risk with distance from the factories in a city–industry integration area, China. International Journal of Environmental Research and Public Health, 19(21): 14562. https://doi.org/10.3390/ijerph192114562
[23] Muller, G. (1969). Index of igeo accumulation in sediments of the Rhine River. Geojournal, 2: 108-118.
[24] Brans, J.P., Mareschal, B. (2005). Promethee methods. In Multiple Criteria Decision Analysis: State of the Art Surveys, pp. 163-186. https://doi.org/10.1007/0-387-23081-5_5
[25] Mareschal, B. (2015). Visual PROMETHEE User Manual (including tutorials). https://doi.org/10.13140/RG.2.1.4004.3042
[26] Gjoka, F., Felix-Henningsen, P., Wegener, H.R., Salillari, I., Beqiraj, A. (2011). Heavy metals in soils from Tirana (Albania). Environmental Monitoring and Assessment, 172(1): 517-527. https://doi.org/10.1007/s10661-010-1351-5
[27] Tomlinson, D.L., Wilson, J.G., Harris, C.R., Jeffrey, D.W. (1980). Problems in the assessment of heavy-metal levels in estuaries and the formation of a pollution index. Helgoländer Meeresuntersuchungen, 33(1): 566-575. https://doi.org/10.1007/BF02414780
[28] Hakanson, L. (1980). An ecological risk index for aquatic pollution control. A sedimentological approach. Water Research, 14(8): 975-1001. https://doi.org/10.1016/0043-1354(80)90143-8
[29] Andrews, S., Sutherland, R.A. (2004). Cu, Pb and Zn contamination in Nuuanu watershed, Oahu, Hawaii. Science of the Total Environment, 324(1-3): 173-182. https://doi.org/10.1016/j.scitotenv.2003.10.032
[30] Zoller, W.H., Gladney, E.S., Duce, R.A. (1974). Atmospheric concentrations and sources of trace metals at the South Pole. Science, 183(4121): 198-200. https://doi.org/10.1126/science.183.4121.198
[31] Birch, G. (2013). 14.24 use of sedimentary-metal indicators in assessment of estuarine system health. Treatise on Geomorphology, 14: 282-291. https://doi.org/10.1016/B978-0-12-374739-6.00392-4
[32] Saroop, S., Tamchos, S. (2021). 4- Monitoring and impact assessment approaches for heavy metals. In Heavy Metals in the Environment, pp. 57-86. Elsevier. https://doi.org/10.1016/B978-0-12-821656-9.00004-3
[33] Duodu, G.O., Goonetilleke, A., Ayoko, G.A. (2016). Comparison of pollution indices for the assessment of heavy metal in Brisbane River sediment. Environmental Pollution, 219: 1077-1091. https://doi.org/10.1016/j.envpol.2016.09.008
[34] Chen, X., Qadeer, A., Liu, M., Deng, L., Zhou, P., Mwizerwa, I.T., Liu, S., Ajmal, Z., Xingru, Z., Jiang, X. (2023). Chapter 13 - Bioaccumulation of emerging contaminants in aquatic biota: PFAS as a case study. In Emerging Aquatic Contaminants, pp. 347-374. https://doi.org/10.1016/B978-0-323-96002-1.00010-9
[35] Shallari, S., Schwartz, C., Hasko, A., Morel, J.L. (1998). Heavy metals in soils and plants of serpentine and industrial sites of Albania. Science of the Total Environment, 209(2-3): 133-142. https://doi.org/10.1016/S0048-9697(98)80104-6
[36] Aliu, M., Šajn, R., Stafilov, T. (2024). Mercury distribution and contamination in the soils of the Mitrovica region, Republic of Kosovo. Journal of Environmental Science and Health, Part A, 59(2): 76-86. https://doi.org/10.1080/10934529.2024.2331944
[37] Buqaj, L., Gashi, B., Zogaj, M., Vataj, R., Sota, V., Tuna, M. (2023). Stress induced by soil contamination with heavy metals and their effects on some biomarkers and DNA damage in maize plants at the vicinity of Ferronikel smelter in Drenas, Kosovo. Journal of Environmental Science and Health, Part B, 58(10): 617-627. https://doi.org/10.1080/03601234.2023.2253114
[38] Fetoshi, O., Koto, R., Sallaku, F., Çadraku, H., et al. (2024). Assessments of heavy metal contaminants in the Drenica River and bioremediation by Typha angustifolia. Hydrology, 11(9): 140. https://doi.org/10.3390/hydrology11090140
[39] Kastrati, G., Paçarizi, M., Sopaj, F., Tašev, K., Stafilov, T., Mustafa, M.K. (2021). Investigation of concentration and distribution of elements in three environmental compartments in the region of Mitrovica, Kosovo: Soil, honey and bee pollen. International Journal of Environmental Research and Public Health, 18(5): 2269. https://doi.org/10.3390/ijerph18052269
[40] Šajn, R., Aliu, M., Stafilov, T., Alijagić, J. (2013). Heavy metal contamination of topsoil around a lead and zinc smelter in Kosovska Mitrovica/Mitrovicë, Kosovo/Kosovë. Journal of Geochemical Exploration, 134: 1-16. https://doi.org/10.1016/j.gexplo.2013.06.018
[41] Zabergja-Ferati, F., Mustafa, M.K., Abazaj, F. (2021). Heavy metal contamination and accumulation in soil and plant from mining area of Mitrovica, Kosovo. Bulletin of Environmental Contamination and Toxicology, 107(3): 537-543. https://doi.org/10.1007/s00128-021-03223-6
[42] Stafilov, T., Stojanova, K., Таšev, K., Bačeva Andonovska, K. (2023). Accumulation and distribution of heavy metals in soil and food crops in the Pb–Zn mine environ. Case study: Region of Probištip, North Macedonia. Journal of Environmental Science and Health, Part A, 58(3): 171-182. https://doi.org/10.1080/10934529.2023.2174331
[43] Tasev, G., Serafimovski, T. (2015). Industrial contamination of soil related to some active and closed mine facilities in the Republic of Macedonia. Tehnika, 24(3): 425-432.
[44] Baruah, M.P., Singha, K., Jha, P. (2024). Heavy metal concentration in agricultural soil near industrial clusters around Raipur city: A geochemical appraisal. Environmental Quality Management, 34(1): e22190. https://doi.org/10.1002/tqem.22190
[45] Dejoie, E., Lemay, M.A., Fenton, N.J., DesRochers, A., Marion, J., Savard, M.M., Porter, T.J., Proulx, D., Gennaretti, F. (2025). Spatiotemporal assessment of lead (Pb) and cadmium (Cd) contamination in urban tree rings near an industrial smelter: High intraspecific variability but limited spatial differentiation. Atmospheric Pollution Research, 16(9): 102582. https://doi.org/10.1016/j.apr.2025.102582
[46] Guo, Y.B., Feng, H., Chen, C., Jia, C.J., Xiong, F., Lu, Y. (2013). Heavy metal concentrations in soil and agricultural products near an industrial district. Polish Journal of Environmental Studies, 22(5): 1357-1362.
[47] Khan, S.N., Nafees, M., Imtiaz, M. (2023). Assessment of industrial effluents for heavy metals concentration and evaluation of grass (Phalaris minor) as a pollution indicator. Heliyon, 9(9): e20299. https://doi.org/10.1016/j.heliyon.2023.e20299
[48] Lemessa, F., Simane, B., Seyoum, A., Gebresenbet, G. (2022). Analysis of the concentration of heavy metals in soil, vegetables and water around the bole Lemi industry park, Ethiopia. Heliyon, 8(12): e12429. https://doi.org/10.1016/j.heliyon.2022.e12429
[49] Pandey, M., Thakur, R.R., Nandi, D., Bera, D.K., Beuria, R., Kumari, M., Zhran, M. (2025). Geospatial monitoring of environmental sustainability: A remote sensing-based approach for assessing mining-induced impacts in Eastern India. Results in Engineering, 26: 104692. https://doi.org/10.1016/j.rineng.2025.104692
[50] Pati, A.K., Tripathy, A.R., Nandi, D., Thakur, R.R., Pandey, M. (2025). Irrigation water quality prognostication: An innovative ensemble architecture leveraging deep learning and machine learning for enhanced SAR and ESP estimation in the east coast of India. Journal of Environmental Chemical Engineering, 13(3): 116433. https://doi.org/10.1016/j.jece.2025.116433
[51] Su, C., Meng, J., Zhou, Y., Bi, R., Chen, Z., Diao, J., Huang, Z., Kan, Z., Wang, T. (2022). Heavy metals in soils from intense industrial areas in south China: Spatial distribution, source apportionment, and risk assessment. Frontiers in Environmental Science, 10: 820536. https://doi.org/10.3389/fenvs.2022.820536
[52] Jimoh, A., Agbaji, E.B., Ajibola, V.O., Funtua, M.A. (2020). Application of pollution load indices, enrichment factors, contamination factor and health risk assessment of heavy metals pollution of soils of welding workshops at old Panteka Market, Kaduna-Nigeria. Open J Anal Bioanal Chem, 4(1): 011-019. https://dx.doi.org/10.17352/ojabc.000019
[53] Ahmed, M., Rahman, M.A., Hoque, M.Z., Parvin, S., Hossain, M.S., Rubayet, M.T. (2023). Pollution of toxic heavy metals and ecological risk in mirzapur industrialized zone of Gazipur, Bangladesh. Journal of Science and Technology Research, 5(1): 45-52. https://doi.org/10.3329/jscitr.v5i1.74001
[54] Albuja, M., Jeong, H., Ra, K. (2024). Distribution of potentially toxic elements and health risk assessment of road dust in a steel industrial area. International Journal of Environmental Science and Technology, 21(5): 4967-4978. https://doi.org/10.1007/s13762-023-05327-4
[55] Zakir, H.M., Sumi, S.A., Sharmin, S., Mohiuddin, K.M., Kaysar, S. (2015). Heavy metal contamination in surface soils of some industrial areas of Gazipur. Bangladesh. Journal of Chemical, Biological and Physical Sciences, 5(2): 2191-2206.
[56] Solgi, E., Keramaty, M., Solgi, M. (2020). Biomonitoring of airborne Cu, Pb, and Zn in an urban area employing a broad leaved and a conifer tree species. Journal of Geochemical Exploration, 208: 106400. https://doi.org/10.1016/j.gexplo.2019.106400
[57] Solgi, E. (2015). Assessment of copper and zinc contamination in soils of industrial estates of Arak region (Iran). Iranian Journal of Toxicology, 9(28): 1277-1283.
[58] Rahman, M.S., Ahmed, Z., Seefat, S.M., Alam, R., Islam, A.R.M.T., Choudhury, T.R., Begum, B.A., Idris, A.M. (2022). Assessment of heavy metal contamination in sediment at the newly established tannery industrial Estate in Bangladesh: A case study. Environmental Chemistry and Ecotoxicology, 4: 1-12. https://doi.org/10.1016/j.enceco.2021.10.001
[59] Safadoust, A., Khaleghi, S., Kolahchi, Z. (2025). Environmental risks of heavy metals in railway soils: Challenges to ecosystem management. Science of The Total Environment, 974: 179217. https://doi.org/10.1016/j.scitotenv.2025.179217
[60] Spahić, M.P., Sakan, S., Cvetković, Ž., Tančić, P., Trifković, J., Nikić, Z., Manojlović, D. (2018). Assessment of contamination, environmental risk, and origin of heavy metals in soils surrounding industrial facilities in Vojvodina, Serbia. Environmental Monitoring and Assessment, 190(4): 208. https://doi.org/10.1007/s10661-018-6583-9
[61] Wang, H., Yu, S., Sun, L., Wang, Y., Wu, H., Wang, X. (2025). Pollution assessment and health risk of metals in surface soil near a Pb–Zn mine, northeast China. Frontiers in Environmental Science, 13: 1585272. https://doi.org/10.3389/fenvs.2025.1585272
[62] Aliu, M., Šajn, R., Stafilov, T. (2021). Occurrence and enrichment sources of cobalt, chromium, and nickel in soils of Mitrovica Region, Republic of Kosovo. Journal of Environmental Science and Health, Part A, 56(5): 566-571. https://doi.org/10.1080/10934529.2021.1898248
[63] Wang, J., Wang, B., Zhao, Q., Cao, J., Xiao, X., Zhao, D., Chen, Z., Wu, D. (2025). Sources analysis and risk assessment of heavy metals in soil in a polymetallic mining area in southeastern Hubei based on Monte Carlo simulation. Ecotoxicology and Environmental Safety, 290: 117607. https://doi.org/10.1016/j.ecoenv.2024.117607
[64] Jonczak, J., Sut-Lohmann, M., Polláková, N., Parzych, A., Šimanský, V., Donovan, S. (2021). Bioaccumulation of potentially toxic elements by the needles of eleven pine species in low polluted area. Water, Air, & Soil Pollution, 232(1): 28. https://doi.org/10.1007/s11270-020-04959-3
[65] Kharkan, J., Sayadi, M.H., Rezaei, M.R. (2019). Investigation of heavy metals accumulation in the soil and pine trees. Environmental Health Engineering and Management Journal, 6(1): 17-25. https://doi.org/10.15171/EHEM.2019.03
[66] Zeiner, M., Sjöberg, V., Olsman, H. (2025). Metal uptake by birches and scots pines grown on a porcelain landfill. Molecules, 30(10): 2196. https://doi.org/10.3390/molecules30102196
[67] Madaan, I., Sharma, P., Singh, A.D., Dhiman, S., Kour, J., Kumar, P., Kaur, G., Sharma, I., Gautam, V., Kaur, R., Sharma, A., Sirhindi, G., Bhardwaj, R. (2025). Chapter 8 - Zinc and plant hormones: an updated review. In Zinc in Plants, pp. 193-223. Academic Press. https://doi.org/10.1016/B978-0-323-91314-0.00016-8
[68] Umair Hassan, M., Aamer, M., Umer Chattha, M., Haiying, T., Shahzad, B., Barbanti, L., Nawaz, M., Rasheed, A., Afzal, A., Liu, Y., Huang, G. (2020). The critical role of zinc in plants facing the drought stress. Agriculture, 10(9): 396. https://doi.org/10.3390/agriculture10090396
[69] Xu, D., Shen, Z., Dou, C., Dou, Z., Li, Y., Gao, Y., Sun, Q. (2022). Effects of soil properties on heavy metal bioavailability and accumulation in crop grains under different farmland use patterns. Scientific Reports, 12(1): 9211. https://doi.org/10.1038/s41598-022-13140-1
[70] Cruz, F.J.R., da Cruz Ferreira, R.L., Conceição, S.S., Lima, E.U., de Oliveira Neto, C.F., Galvão, J.R., da Cunha Lopes, S., Viegas, I.D.J.M. (2022). Copper toxicity in plants: Nutritional, physiological, and biochemical aspects. In Advances in Plant Defense Mechanisms. IntechOpen. https://doi.org/10.5772/intechopen.105212
[71] Gong, Q., Li, Z.H., Wang, L., Zhou, J.Y., Kang, Q., Niu, D.D. (2021). Gibberellic acid application on biomass, oxidative stress response, and photosynthesis in spinach (Spinacia oleracea L.) seedlings under copper stress. Environmental Science and Pollution Research, 28(38): 53594-53604. https://doi.org/10.1007/s11356-021-13745-5
[72] Li, Y., Shi, S., Zhang, Y., Zhang, A., Wang, Z., Yang, Y. (2023). Copper stress-induced phytotoxicity associated with photosynthetic characteristics and lignin metabolism in wheat seedlings. Ecotoxicology and Environmental Safety, 254: 114739. https://doi.org/10.1016/j.ecoenv.2023.114739
[73] Xu, E., Liu, Y., Gu, D., Zhan, X., Li, J., Zhou, K., Zhang, P., Zou, Y. (2024). Molecular mechanisms of plant responses to copper: From deficiency to excess. International Journal of Molecular Sciences, 25(13): 6993. https://doi.org/10.3390/ijms25136993
[74] Turekian, K.K., Wedepohl, K.H. (1961). Distribution of the elements in some major units of the earth's crust. Geological Society of America Bulletin, 72(2): 175-192. https://doi.org/10.1130/0016-7606(1961)72[175:DOTEIS] 2.0.CO;2
[75] Rahman, S.H., Khanam, D., Adyel, T.M., Islam, M.S., Ahsan, M.A., Akbor, M.A. (2012). Assessment of heavy metal contamination of agricultural soil around Dhaka Export Processing Zone (DEPZ), Bangladesh: Implication of seasonal variation and indices. Applied Sciences, 2(3): 584-601. https://doi.org/10.3390/app2030584
[76] Miranzadeh Mahabadi, H., Ramroudi, M., Asgharipour, M.R., Rahmani, H.R., Afyuni, M. (2020). Evaluation of the ecological risk index (Er) of heavy metals (HMs) pollution in urban field soils. SN Applied Sciences, 2(8): 1420. https://doi.org/10.1007/s42452-020-03219-7
[77] Kang, Z., Wang, S., Qin, J., Wu, R., Li, H. (2020). Pollution characteristics and ecological risk assessment of heavy metals in paddy fields of Fujian province, China. Scientific Reports, 10(1): 12244. https://doi.org/10.1038/s41598-020-69165-x