Mujiyo*![]() | Wahyu Dyah Pramesti
| Wahyu Dyah Pramesti![]() | Ganjar Herdiansyah
| Ganjar Herdiansyah![]() | Hery Widijanto
| Hery Widijanto![]()
© 2025 The authors. This article is published by IIETA and is licensed under the CC BY 4.0 license (http://creativecommons.org/licenses/by/4.0/).
OPEN ACCESS
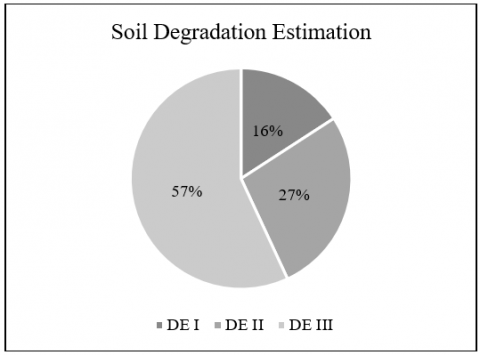
Soil degradation significantly affects land productivity and the sustainability of natural resources, particularly in watershed areas. This research aims to estimate and identify the level of soil degradation in the Tirtomoyo Sub-Watershed, assess its accuracy, and provide improvement recommendations based on key determining factors. The research was conducted in the districts of Wonogiri (Central Java) and Pacitan (East Java) using the Object-Based Image Analysis (OBIA) method with Sentinel-2A imagery, combined with a scoring system and exploratory descriptive analysis. Analysis of 45 samples was conducted using ANOVA to determine the effect of sources of diversity on factors determining soil degradation, DMRT to determine the average value of sources of diversity, correlation to determine the relationship between parameters and soil degradation, and the main method, the T-test, was used to evaluate the accuracy between soil degradation estimation (SDE) and soil degradation status (SDS). The results indicated that the estimated soil degradation in the sub-watershed area falls into three categories: DE I (Very Low Degradation Estimation) covering 2,959 hectares, DE II (Low Degradation Estimation) covering 5,091 hectares, and DE III (Moderate Degradation Estimation) covering 10,630 hectares, with porosity identified as the primary contributing factor. The actual status of soil degradation is categorized into DI (Light Degradation) covering 17,256 hectares and DII (Moderate Degradation) covering 1,424 hectares, with bulk density being the primary determining factor. Recommendations for mitigating soil degradation include the application of organic fertilizers, the cultivation of cover crops, and the implementation of conservation tillage. The T-test results showed no significant difference between the SDE and SDS, showing T-Value < T-Table (1.15 < 1.67) with P-Value > 0.05, meaning that the two are not significantly different, so the OBIA method is accurate in mapping land use to estimate soil damage without having to take an actual approach.
accuracy assessment, Bengawan Solo watershed, Object-Based Image Analysis (OBIA), remote sensing, T-test, Sentinel-2A, soil degradation status
Soil is one of the most complex [1] and heterogeneous natural resources essential for human life [2]. Soil characteristics vary in mountainous regions, karst areas, and watershed zones. Soil conditions support biomass production; when these conditions fall below a certain threshold, the soil is degraded [3]. Soil degradation commonly occurs in areas with complex topography, such as watersheds. Soil degradation is mainly caused by soil management practices and land use [4]. Soil degradation can be observed through physical, chemical, and biological properties. For example, soil degradation due to erosion and continuous cultivation increases the likelihood that the soil cannot produce optimally, reducing agricultural sector output [5]. Degraded soil undergoes a decline in function and food production quality, which impacts human survival and various other organisms [6].
A watershed is a land area topographically bounded by mountain ridges and can collect rainwater [7]. The watershed area also plays a role in draining water to be widely utilized [8]. One of the largest watersheds in Java is the Bengawan Solo watershed, which has many sub-watersheds. Tirtomoyo Sub-Watershed is a sub-watershed of the Upper Bengawan Solo 3 watershed, which empties into the Gajah Mungkur Reservoir in Wonogiri. Tirtomoyo Sub-Watershed has an undulating topography and a fairly steep slope. Factors that can trigger various types of land degradation are erosion and landslides. The Wonogiri District Government recorded landslides and floods at the end of 2007 in the Tirtomoyo Sub-district due to the rainy season at the end of the year, and 14 people died due to these natural disasters. These landslides indicate the region's vulnerability to such events [9]. Degradation in the sub-watershed area requires mitigation efforts to achieve ecosystem sustainability [10] and enhance the sustainable utilization of natural resources for human benefit, particularly in the agricultural sector [11]. Degradation mitigation can be done by mapping the affected areas through soil degradation estimation (SDE) and determining soil degradation status (SDS). SDE and SDS serve to identify the level of soil degradation and the parameters that contribute to the degradation [12].
The soil degradation method used in this research is the OBIA-based analysis method with Sentinel-2A satellite imagery and weighting, and the Exploratory Descriptive Method through a field survey approach. OBIA not only considers the spectral aspects but also the spatial characteristics of the object [13]. The results of satellite image extraction using OBIA provide object-based classification to calculate the conversion of agricultural land to more precise built-up land. The OBIA approach reduces spurious changes caused by high spectral variability in high-resolution spatial imagery, such as Sentinel-2A imagery [14]. A three-year research on OBIA to determine soil damage was conducted in 2023, mapping soil damage using the OBIA method but using Sentinel-2B satellite imagery in the Lawu mountain slope area, producing damage estimation data that showed that slope and land use variables had a significant effect on the level of soil damage, but accuracy testing against field conditions had not yet been carried out [15]. A study in 2019 using OBIA on Landsat 8 imagery successfully mapped the earthquake-affected area in Palu City with a wide coverage area but limited spatial detail due to a 30-meter resolution, whereas Sentinel-2A has a 10-meter resolution, potentially producing more detailed damage maps capable of accurately identifying small-scale changes. Sentinel-2A also has more spectral bands in the visible, near-infrared (NIR), and shortwave infrared (SWIR) regions with narrower band widths, enabling it to distinguish land cover types or damage levels with better spectral contrast.
This research aims to map the estimation and actual status of soil degradation, as well as to test the accuracy of soil degradation estimation using Sentinel-2A satellite imagery compared to degradation status obtained through field surveys and laboratory analysis, to determine the accuracy and effectiveness of the OBIA method relative to actual results. The results obtained from this study are intended to produce maps of the distribution of SDE and SDS in the Tirtomoyo Sub-Watershed area, based on the OBIA method using Sentinel-2A satellite imagery, which can serve as a guide for formulating recommendations to address and prevent soil Degradation in the Tirtomoyo Sub-Watershed area. This research can also be used as a reference for future studies related to the application of the OBIA method, the utilization of Sentinel-2A satellite imagery, and land resource management.
2.1 Research location
This research was conducted in the Tirtomoyo Sub-Watershed, Wonogiri Regency, Central Java Province. The Tirtomoyo Sub-Watershed is astronomically located between 7°54'00" N–S to 7°59'30" N–S and 111°03'00" E to 111°12'30" E. The Tirtomoyo Sub-Watershed is situated in the southeastern part of Wonogiri Regency and is dominated by hilly to undulating topographic conditions. The elevation ranges from 200 to 700 meters above sea level [16]. These geographical conditions significantly influence the hydrological and land use characteristics of the sub-watershed area [17]. The Tirtomoyo Sub-Watershed covers an area of 21,669 hectares. It spans across 10 sub-watersheds, which are distributed within Wonogiri Regency, Central Java Province, Baturetno, Batuwarno, Jatiroto, Karangtengah, Kismantoro, Ngadirojo, Nguntoronadi, Sidoarjo, Tirtomoyo, and Nawangan in Pacitan Regency, East Java.
2.2 Data collection and soil sampling
Materials used in research activities include land maps unit (LMU) processed from Sentinel-2A imagery, topographic maps processed from DEM data, rainfall, and soil types. Soil sample analysis in the laboratory, based on parameters in the standard criteria for soil damage in Government Regulation of the Republic of Indonesia Number 150 of 2000. Based on the Minister of Environment Regulation No. 7 of 2006, soil parameters measured to determine the status of soil degradation include soil physical properties consisting of texture (pipette method), bulk density (ring method), particle density (pycnometer), and porosity (ratio of bulk density and particle density).
2.3 Map of land unit
A land use map is created to determine SDE by retrieving image data in Google Earth Engine. Sentinel-2A satellite images were obtained through the Google Earth Engine platform on 24 November 2024 with maximum cloud cover <10% and then processed using ArcGIS through atmospheric correction, object segmentation, and image classification using the Support Vector Machine (SVM) method. This study utilized Sentinel-2A imagery with a spatial resolution of 10 m for visible and near-infrared bands, and 20 m for red-edge and shortwave infrared bands. Atmospheric correction aims to remove atmospheric disturbances such as water vapor, dust, and clouds using the Dark Object Subtraction (DOS) method [18]. Object segmentation was performed using a scale of 10–20, a region growing segmentation algorithm with a small spectral threshold, a shape of 0.10–0.20, a compactness of 0.4–0.6, and a minimum segment area of 1–2 pixels. Classification was carried out using Normalized Difference Vegetation Index (NDVI) analysis, which separates areas based on color to indicate the presence of vegetation, bare land, settlements, rice fields, drylands, and water bodies [19]. Image classification employed the Support Vector Machine (SVM) algorithm to distinguish land cover classes in the image [20]. NDVI analysis combined Band 8 and Band 4 raster data to differentiate areas based on vegetation presence.
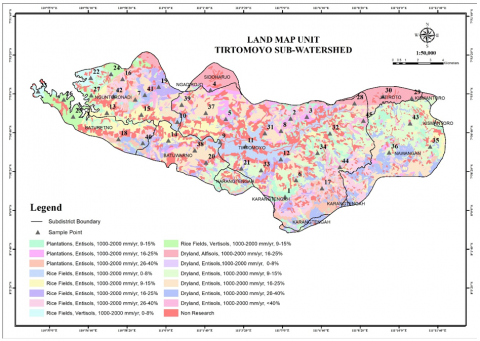
The land maps unit used to determine the status of soil degradation is the Indonesian landform map. The map is then overlaid with the soil type, rainfall, and slope maps, and produces a land unit map. Work map in 15 land map units for SDE and SDS with 3 replications, so that 45 sample points are obtained that represent the entire research area (Figure 1). The results of the OBIA method land use map analysis with the Indonesian landform map have similarities at 45 sample points, consisting of plantations, rice fields, and drylands, to use one LMU to determine SDE and SDS.
Figure 1. Land map unit of the Tirtomoyo Sub-Watershed area
2.4 Data analysis
2.4.1 Determination of soil degradation estimation
SDE is carried out using a scoring approach based on several sources of variability that have been processed using the OBIA method with Sentinel-2A satellite imagery. The total area and proportion for each land map unit are shown in Table 1. Secondary data used to determine the level of soil degradation include land use (Table 2), slope (Table 3), rainfall (Table 4), and soil type (Table 5). Scoring and weighting are applied to determine the soil degradation class of an area (Table 6), based on the contributing factors [21]. The weighted score is obtained by multiplying each parameter's weight by its rating. This calculation aims to provide an overview of soil conditions and to support the design of appropriate management strategies according to the level of degradation observed [22].
Table 1. Area of land map unit in the study site
|
LMU |
Area (ha) |
Proportion (%) |
|
1 |
1,107 |
6.5% |
|
2 |
944 |
5.5% |
|
3 |
1,078 |
6.3% |
|
4 |
421 |
2.5% |
|
5 |
1,874 |
10.9% |
|
6 |
257 |
1.5% |
|
7 |
1,100 |
6.4% |
|
8 |
848 |
4.9% |
|
9 |
1,329 |
7.8% |
|
10 |
2,906 |
17.1% |
|
11 |
274 |
1.6% |
|
12 |
456 |
2.6% |
|
13 |
2,634 |
15.5% |
|
14 |
1,412 |
8.3% |
|
15 |
441 |
2.6% |
Table 2. Land use score for soil degradation estimation (SDE)
|
Land Use |
Classification |
Weight |
Rating |
Score |
|
Natural forest, Rice fields, Reeds |
Very low |
2 |
1 |
2 |
|
Mixed plantations, Shrubs, Grasslands |
Low |
2 |
2 |
4 |
|
Production forests, Plantations |
Moderate |
2 |
3 |
6 |
|
Dryland (annual crops) |
High |
2 |
4 |
8 |
|
Bare Land |
Very High |
2 |
5 |
10 |
Table 3. Slope score for soil degradation estimation (SDE)
|
Slope (%) |
Classification |
Weight |
Rating |
Score |
|
0-8 |
Very low |
3 |
1 |
3 |
|
9-15 |
Low |
3 |
2 |
6 |
|
16-25 |
Moderate |
3 |
3 |
9 |
|
26-40 |
High |
3 |
4 |
12 |
|
>40 |
Very High |
3 |
5 |
15 |
Table 4. Rainfall score for soil degradation estimation (SDE)
|
Rain Fall (mm/year) |
Classification |
Weight |
Rating |
Score |
|
<1000 |
Very Dry |
1 |
1 |
1 |
|
1000-1500 |
Dry |
1 |
2 |
2 |
|
1501-2000 |
Moderate/Moist |
1 |
3 |
3 |
|
2001-2500 |
Wet |
1 |
4 |
4 |
|
>2500 |
Very Wet |
1 |
5 |
5 |
Table 5. Soil type score for soil degradation estimation (SDE)
|
Soil Type |
Classification |
Weight |
Rating |
Score |
|
Vertisols |
Very low |
2 |
1 |
2 |
|
Oxisols |
Low |
2 |
2 |
4 |
|
Alfisols, Mollisols, Ultisols |
Moderate |
2 |
3 |
6 |
|
Entisols, Histosols, Inceptiols |
High |
2 |
4 |
8 |
|
Andisols, Spodosols |
Very High |
2 |
5 |
10 |
Table 6. SDE classification
|
Symbol |
Soil Degradation Potential |
Weighting Score |
|
DE 1 |
Very low |
<15 |
|
DE 2 |
Low |
15-24 |
|
DE 3 |
Moderate |
25-34 |
|
DE 4 |
High |
35-44 |
|
DE 5 |
Very High |
>45 |
Table 7. Physical parameters of soil degradation status (SDS)
|
Soil Parameters |
Critical Threshold |
|
Solum Thickness |
< 20 cm |
|
Texture |
< 18% colloidal; > 80% quartzitic sand |
|
Bulk Density (BD) |
> 1.4 g/cm3 |
|
Porosity |
< 30%; >70 % |
Table 8. Soil degradation score based on relative frequency
|
Relative Frequency of Soil Degradation (%) |
Score |
SDS |
|
0-10 |
0 |
Not Degraded |
|
11-25 |
1 |
Slightly Degraded |
|
26-50 |
2 |
Moderately Degraded |
|
51-75 |
3 |
Severely Degraded |
|
76-100 |
4 |
Extremely Degraded |
Table 9. SDS based on accumulated soil relative frequency scores
|
Symbol |
Accumulated Score Value |
SDS |
|
N |
0 |
Not Degraded |
|
D1 |
1-14 |
Slightly Degraded |
|
D2 |
15-24 |
Moderately Degraded |
|
D3 |
25-34 |
Severely Degraded |
|
D4 |
35-40 |
Extremely Degraded |
Data were obtained from the analysis of soil samples in the laboratory. Identification and estimation of soil degradation factors were assessed and classified using quantitative analysis methods with matching and scoring approaches. Matching is performed by comparing the measured soil degradation data in the field with predetermined standard criteria. Scoring involves assigning a score to each soil parameter, which is then accumulated to determine SDS classification. Table 7 presents the critical thresholds for the physical parameters of soil degradation. The results of the sample analysis based on physical parameters were matched. Then the relative frequency score was calculated using the data in Table 8, followed by a weighting stage based on Table 9 to accumulate the relative frequency score.
2.4.3 Data analysis and accuracy level determination
An analysis of Variance (ANOVA) test was conducted to determine the effect of the source of diversity on the estimation and status of soil degradation, and the impact of soil parameters on the source of diversity on soil degradation parameters. A further test with Duncan was conducted to determine if the analysis results showed a significant effect. Correlation analysis determined the relationship between parameters and soil degradation status. A T-test was used to compare the SDE and SDS.
3.1 Soil degradation estimation
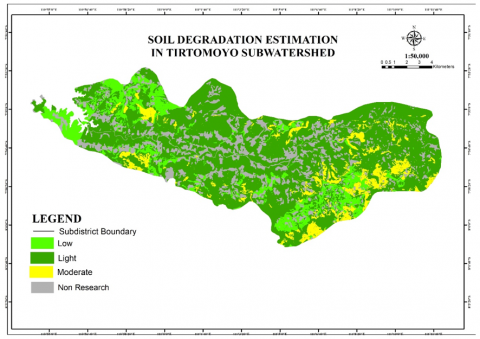
Figure 2 and Figure 3 present the classification of potential soil degradation into three distinct categories: DE I (Very Low Degradation Estimation), DE II (Low Degradation Estimation), and DE III (Moderate Degradation Estimation). This classification is based on a composite scoring system derived from multiple biophysical indicators, such as land use type, slope gradient, soil texture, rainfall intensity, and vegetative cover. Land units with a cumulative score of less than 15 are categorized as DE I, indicating minimal risk of degradation under current land management practices (Table 10). Units scoring between 15 to 24 fall under DE II, representing areas where degradation processes may initiate under persistent pressure, while those scoring between 25 and 34 are categorized as DE III, suggesting active degradation processes requiring urgent mitigation.
Figure 2. Soil degradation estimation in the Tirtomoyo Sub-Watershed
Figure 3. Soil degradation estimation in Tirtomoyo Sub-Watershed
Table 10. Scoring and weighting of soil degradation estimation in Tirtomoyo Sub-Watershed
|
LMU |
Point |
Soil Type |
Weighting Score |
Slope (%) |
Rating × Weighting |
Weighting Score |
Rainfall (mm.yr-1) |
Weighting Score |
Land Use |
Weighting Score |
Total Weighting Score |
Soil Degradation Estimation |
|
1 |
1 |
Entisols |
8 |
9-15 |
2 × 3 |
6 |
1,000-1,500 |
2 |
Plantation |
6 |
22 |
DE II |
|
2 |
Entisols |
8 |
9-15 |
2 × 3 |
6 |
1,000-1,500 |
2 |
Plantation |
6 |
22 |
DE II |
|
|
3 |
Entisols |
8 |
9-15 |
2 × 3 |
6 |
1,000-1,500 |
2 |
Plantation |
6 |
22 |
DE II |
|
|
2 |
1 |
Entisols |
8 |
16-25 |
3 × 3 |
9 |
1,000-1,500 |
2 |
Plantation |
6 |
25 |
DE III |
|
2 |
Entisols |
8 |
16-25 |
3 × 3 |
9 |
1,000-1,500 |
2 |
Plantation |
6 |
25 |
DE III |
|
|
3 |
Entisols |
8 |
16-25 |
3 × 3 |
9 |
1,000-1,500 |
2 |
Plantation |
6 |
25 |
DE III |
|
|
3 |
1 |
Entisols |
8 |
26-40 |
4 × 3 |
12 |
1,000-1,500 |
2 |
Plantation |
6 |
28 |
DE III |
|
2 |
Entisols |
8 |
26-40 |
4 × 3 |
12 |
1,000-1,500 |
2 |
Plantation |
6 |
28 |
DE III |
|
|
3 |
Entisols |
8 |
26-40 |
4 × 3 |
12 |
1,000-1,500 |
2 |
Plantation |
6 |
28 |
DE III |
|
|
4 |
1 |
Entisols |
8 |
0-8 |
1 × 3 |
3 |
1,000-1,500 |
2 |
Rice fields |
2 |
15 |
DE I |
|
2 |
Entisols |
8 |
0-8 |
1 × 3 |
3 |
1,000-1,500 |
2 |
Rice fields |
2 |
15 |
DE I |
|
|
3 |
Entisols |
8 |
0-8 |
1 × 3 |
3 |
1,000-1,500 |
2 |
Rice fields |
2 |
15 |
DE I |
|
|
5 |
1 |
Entisols |
8 |
9-15 |
2 × 3 |
6 |
1,000-1,500 |
2 |
Rice fields |
2 |
18 |
DE II |
|
2 |
Entisols |
8 |
9-15 |
2 × 3 |
6 |
1,000-1,500 |
2 |
Rice fields |
2 |
18 |
DE II |
|
|
3 |
Entisols |
8 |
9-15 |
2 × 3 |
6 |
1,000-1,500 |
2 |
Rice fields |
2 |
18 |
DE II |
|
|
6 |
1 |
Entisols |
8 |
16-25 |
3 × 3 |
9 |
1,000-1,500 |
2 |
Rice fields |
2 |
21 |
DE II |
|
2 |
Entisols |
8 |
16-25 |
3 × 3 |
9 |
1,000-1,500 |
2 |
Rice fields |
2 |
21 |
DE II |
|
|
3 |
Entisols |
8 |
16-25 |
3 × 3 |
9 |
1,000-1,500 |
2 |
Rice fields |
2 |
21 |
DE II |
|
|
7 |
1 |
Entisols |
8 |
26-40 |
4 × 3 |
12 |
1,000-1,500 |
2 |
Rice fields |
2 |
24 |
DE II |
|
2 |
Entisols |
8 |
26-40 |
4 × 3 |
12 |
1,000-1,500 |
2 |
Rice fields |
2 |
24 |
DE II |
|
|
3 |
Entisols |
8 |
26-40 |
4 × 3 |
12 |
1,000-1,500 |
2 |
Rice fields |
2 |
24 |
DE II |
|
|
8 |
1 |
Vertisols |
2 |
0-8 |
1 × 3 |
3 |
1,000-1,500 |
2 |
Rice fields |
2 |
9 |
DE I |
|
2 |
Vertisols |
2 |
0-8 |
1 × 3 |
3 |
1,000-1,500 |
2 |
Rice fields |
2 |
9 |
DE I |
|
|
3 |
Vertisols |
2 |
0-8 |
1 × 3 |
3 |
1,000-1,500 |
2 |
Rice fields |
2 |
9 |
DE I |
|
|
9 |
1 |
Vertisols |
2 |
9-15 |
2 × 3 |
6 |
<1000 |
3 |
Rice fields |
2 |
13 |
DE I |
|
2 |
Vertisols |
2 |
9-15 |
2 × 3 |
6 |
<1000 |
3 |
Rice fields |
2 |
13 |
DE I |
|
|
3 |
Vertisols |
2 |
9-15 |
2 × 3 |
6 |
<1000 |
3 |
Rice fields |
2 |
13 |
DE I |
|
|
10 |
1 |
Alfisols |
6 |
16-25 |
3 × 3 |
9 |
1,000-1,500 |
2 |
Dryland |
8 |
25 |
DE III |
|
2 |
Alfisols |
6 |
16-25 |
3 × 3 |
9 |
1,000-1,500 |
2 |
Dryland |
8 |
25 |
DE III |
|
|
3 |
Alfisols |
6 |
16-25 |
3 × 3 |
9 |
1,000-1,500 |
2 |
Dryland |
8 |
25 |
DE III |
|
|
11 |
1 |
Entisols |
8 |
0-8 |
1 × 3 |
3 |
1,000-1,500 |
2 |
Dryland |
8 |
21 |
DE II |
|
2 |
Entisols |
8 |
0-8 |
1 × 3 |
3 |
1,000-1,500 |
2 |
Dryland |
8 |
21 |
DE II |
|
|
3 |
Entisols |
8 |
0-8 |
1 × 3 |
3 |
1,000-1,500 |
2 |
Dryland |
8 |
21 |
DE II |
|
|
12 |
1 |
Entisols |
8 |
9-15 |
2 × 3 |
6 |
<1,000 |
3 |
Dryland |
8 |
25 |
DE III |
|
2 |
Entisols |
8 |
9-15 |
2 × 3 |
6 |
<1,000 |
3 |
Dryland |
8 |
25 |
DE III |
|
|
3 |
Entisols |
8 |
9-15 |
2 × 3 |
6 |
<1,000 |
3 |
Dryland |
8 |
25 |
DE III |
|
|
13 |
1 |
Entisols |
8 |
16-25 |
3 × 3 |
9 |
1,000-1,500 |
2 |
Dryland |
8 |
27 |
DE III |
|
2 |
Entisols |
8 |
16-25 |
3 × 3 |
9 |
1,000-1,500 |
2 |
Dryland |
8 |
27 |
DE III |
|
|
3 |
Entisols |
8 |
16-25 |
3 × 3 |
9 |
1,000-1,500 |
2 |
Dryland |
8 |
27 |
DE III |
|
|
14 |
1 |
Entisols |
8 |
26-40 |
4 × 3 |
12 |
1,000-1,500 |
2 |
Dryland |
8 |
30 |
DE III |
|
2 |
Entisols |
8 |
26-40 |
4 × 3 |
12 |
1,000-1,500 |
2 |
Dryland |
8 |
30 |
DE III |
|
|
3 |
Entisols |
8 |
26-40 |
4 × 3 |
12 |
1,000-1,500 |
2 |
Dryland |
8 |
30 |
DE III |
|
|
15 |
1 |
Entisols |
8 |
<40 |
5 × 3 |
15 |
<1,000 |
3 |
Dryland |
8 |
34 |
DE III |
|
2 |
Entisols |
8 |
<40 |
5 × 3 |
15 |
<1,000 |
3 |
Dryland |
8 |
34 |
DE III |
|
|
3 |
Entisols |
8 |
<40 |
5 × 3 |
15 |
<1,000 |
3 |
Dryland |
8 |
34 |
DE III |
Description: LMU = Land Map Unit; DE I = very low degradation estimation; DE II = low degradation estimation; DE III= moderate degradation estimation
The scoring reflects how different land characteristics interact with environmental forces. For instance, steep slopes (>15%) significantly increase runoff velocity and erosion potential, particularly when vegetative cover is sparse or replaced by row crops or plantation systems with low canopy closure [23]. Similarly, regions with high annual rainfall (more than 2,000 mm) experience greater kinetic energy of raindrop impact, which accelerates soil detachment, especially on unprotected surfaces [24]. These conditions are exacerbated in dryland and plantation areas where the natural soil structure is often disrupted through tillage or heavy machinery use, reducing organic matter content and water infiltration capacity. Consequently, these land use types contribute higher weights in the scoring system, reflecting their greater propensity to promote processes such as sheet erosion, rill formation, and nutrient leaching [25].
As depicted in the soil degradation estimation (SDE) map of the Tirtomoyo Sub-Watershed in Figure 4, the spatial distribution of degradation potential is evident across the landscape. Areas with very low degradation estimation (DE I), totaling approximately 2,959 hectares, are generally located on flatter terrain with stable land use practices, such as forested zones or well-managed agricultural plots. In contrast, zones with low degradation estimation (DE II) cover around 5,091 hectares and are more widely dispersed across sub-district boundaries, indicating intermediate conditions where either topography or land management practices begin to compromise soil stability. Notably, moderate degradation estimation (DE III) dominates the study area, spanning approximately 10,630 hectares. These areas are characterized by a convergence of vulnerable factors—steep slopes, erosive rainfall, and intensive land use—making them priority zones for targeted soil conservation interventions such as contour farming, vegetative buffer strips, and agroforestry systems to restore ecological function and prevent further degradation [26].
The land use composition in the Tirtomoyo Sub-Watershed is dominated by dryland, covering an area of 8,411 ha or 45.1% of the total sub-watershed. This is followed by rice fields, which occupy 6,164 ha (32.9%), and plantations, with a coverage of 4,113 ha (22%). In terms of rainfall distribution, the majority of the area (14,371 ha or 63.6%) receives annual precipitation of less than 1,000 mm, while the remaining 8,217 ha (36.4%) falls within the 1,000–1,500 mm range. This variation in land use and rainfall patterns is an important factor influencing soil degradation processes in the study area. The slope distribution in the Tirtomoyo Sub-Watershed shows a predominance of moderately steep terrains, with slopes of 16–25% covering 6,178 ha (27.3%) and slopes of 26–40% occupying 6,066 ha (26.8%). Steeper slopes above 40% account for 4,435 ha (19.8%), while gentle slopes of 9–15% and 0–8% comprise 4,010 ha (17.7%) and 1,895 ha (8.4%), respectively. In terms of soil types, Entisols dominate the area with 19,982 ha (88.4%), followed by Alfisols at 1,344 ha (6%) and Vertisols at 1,260 ha (5.6%). This combination of varied slope classes and diverse soil types provides a wide range of opportunities for implementing site-specific land management practices. The presence of different slope gradients and soil characteristics enables the application of tailored conservation strategies that can optimize land productivity while maintaining environmental sustainability.
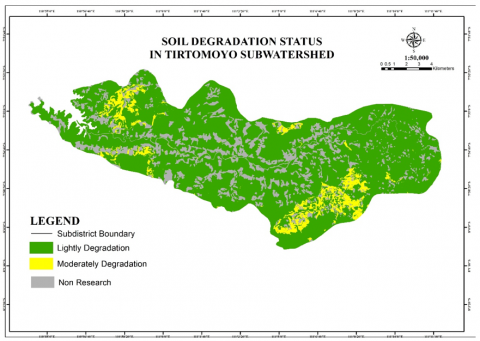
Figure 4. Soil degradation status in the Tirtomoyo Sub-Watershed
3.2 Soil degradation status
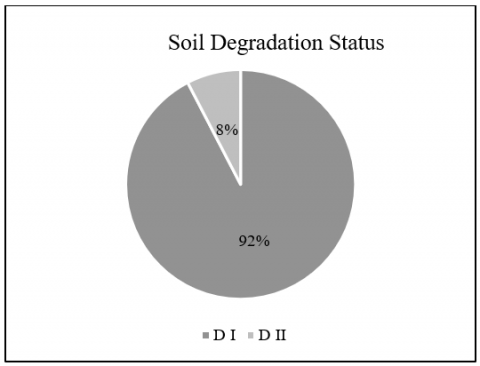
Degradation categories can be used for sustainable land management [27]. Based on the results of the scoring calculation of soil degradation in the Tirtomoyo Sub-Watershed area, Table 11 shows that there are 2 categories of degradation: DI (light degradation), which dominates almost all LMUs except LMU 9, and DII (moderate degradation) [28]. The SDS map of the Tirtomoyo Sub-Watershed in Figure 4 and Figure 5 shows the distribution of areas based on the level of soil degradation, which is divided into lightly degraded and moderately degraded categories. Lightly degraded areas dominate with 17,256 hectares, spread across most sub-watershed regions, especially in the western and central parts. Moderately degraded areas totaling 1,424 hectares are concentrated in the eastern and southeastern provinces. The SDS maps provide essential information on prioritized areas that require conservation treatment [29], to prevent more severe land degradation in the future [30]. Seasonal factors, including rainfall not significantly affect the actual level of soil degradation (SDS). During the observation period because low rainfall intensity in dry to very dry areas significantly limits water erosion. These drought conditions are still taken into account in the estimation weighting because they have the potential to indirectly reduce soil quality through reduced vegetation cover, increased vulnerability to wind erosion, and soil structure degradation due to reduced moisture. Although its influence is not directly significant, rainfall remains an important factor in predicting long-term soil degradation.
Figure 5. Soil degradation status in Tirtomoyo Sub-Watershed
3.3 Determinants of soil degradation
3.3.1 Soil degradation estimation
Table 12 presents the significant influence of several sources of variability on SDE. The factors of land use and soil type are at a very high level of significance (p = 0.000**), meaning that these factors significantly influence the level of soil degradation. This indicates that the variety of sources of diversity is an essential factor that is proven to affect the level of soil degradation in the Tirtomoyo Sub-Watershed area [31]. The rainfall and slope factors do not affect SDE, with significance values of 0.433 and 0.233. Rainfall is generally considered one of the factors causing soil degradation [32], but the uniformity of rainfall and scores in the study area did not affect soil degradation. This could be due to the homogeneity of rainfall in the Tirtomoyo Sub-Watershed or the dominant influence of other factors such as land use and slope. Figures 6 and 7 present the results of the significant difference in SDE values concerning land use and soil type.
Table 11. Results of the scoring calculation of soil degradation status (SDS) in Tirtomoyo Sub-Watershed area
|
LMU |
Texture |
Bulk Density (g.cm-3) |
Particle Density (mg.m-3) |
Porosity (%) |
Total Score |
Symbol |
Limiting Factors |
|
|
Colloidal |
Sand |
|||||||
|
1 |
2 |
0 |
0 |
2 |
4 |
8 |
D I |
Texture, Particle Density, Porosity |
|
2 |
0 |
0 |
0 |
0 |
4 |
4 |
D I |
Porosity |
|
3 |
4 |
0 |
2 |
0 |
4 |
10 |
D I |
Texture, Bulk Density, Porosity |
|
4 |
0 |
0 |
4 |
4 |
3 |
11 |
D I |
Bulk Density, Particle Density, Porosity |
|
5 |
0 |
0 |
4 |
4 |
3 |
11 |
D I |
Bulk Density, Particle Density, Porosity |
|
6 |
0 |
0 |
4 |
4 |
4 |
12 |
D I |
Bulk Density, Particle Density, Porosity |
|
7 |
0 |
0 |
4 |
2 |
4 |
10 |
D I |
Bulk Density, Particle Density, Porosity |
|
8 |
0 |
0 |
4 |
2 |
4 |
10 |
D I |
Bulk Density, Particle Density, Porosity |
|
9 |
4 |
0 |
4 |
3 |
4 |
15 |
D II |
Texture, Bulk Density, Particle Density, Porosity |
|
10 |
0 |
0 |
3 |
4 |
2 |
9 |
D I |
Bulk Density, Particle Density, Porosity |
|
11 |
0 |
0 |
0 |
4 |
2 |
6 |
D I |
Bulk Density, Particle Density, Porosity |
|
12 |
2 |
0 |
2 |
4 |
3 |
11 |
D I |
Texture, Bulk Density, Particle Density, Porosity |
|
13 |
0 |
0 |
4 |
4 |
0 |
8 |
D I |
Bulk Density, Particle Density |
|
14 |
0 |
0 |
4 |
4 |
2 |
10 |
D I |
Bulk Density, Particle Density, Porosity |
|
15 |
0 |
0 |
4 |
4 |
4 |
12 |
D I |
Bulk Density, Particle Density, Porosity |
Description: LMU = Land Map Unit
Table 12. Effect of the source of variance on SDE
|
Source of Diversity |
Soil Degradation Estimation |
|
Land Use |
0.000** |
|
Slope |
0.233ns |
|
Soil Type |
0.000** |
|
Rainfall |
0.433ns |
Remark: ns) = not significant, *) = significant, **) = highly significant
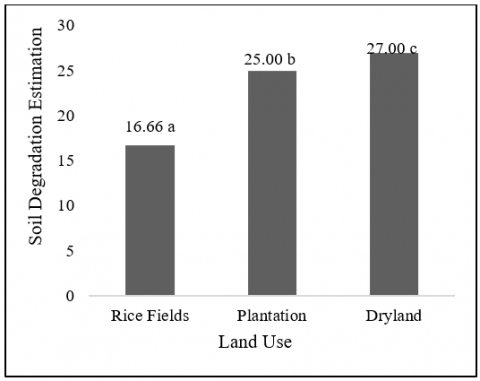
Figure 6 shows significant differences in SDE based on land use type. The highest average value of SDE was found in dryland at 27.00c, followed by plantation land at 25.00b, and the lowest in paddy field at 16.66a. Paddy fields differ significantly from plantation and dryland fields, but plantation and dryland fields do not show significant differences. These results indicate that land use has an essential influence on soil degradation. Rice fields experience lower soil degradation compared to plantations and drylands. This difference can be caused by the characteristics of more regular management of paddy fields and the protection from water cover [33]. Plantation and dryland are more exposed to factors that cause soil erosion and degradation [34].
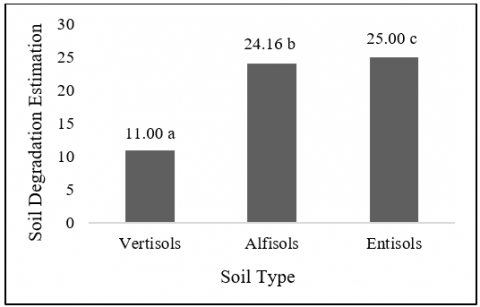
Figure 7 shows the significant differences in SDE across the different soil types. Entisols soils had the highest mean SDE of 25.00c, notably different from the other soil types. This shows that soil degradation in Entisols is statistically significantly different from other soil types. Alfisols had an average soil degradation value of 14.16b, and Vertisols showed the lowest SDE value of 11.00a. These results indicate that the characteristics of each soil type play an important role in determining the level of soil degradation [35]. Vertisols, which have a more stable soil structure and good water retention ability [36], experience lower soil degradation. In contrast, Entisols, which are young and have undeveloped soil horizons, tend to be more susceptible to degradation.
Table 13. Determinants of SDE
|
Soil Degradation Parameters |
SDE |
|
Porosity |
-0.384* |
|
Bulk Density |
0.111 |
|
Particle Density |
0.252 |
|
Texture |
-0.127 |
Remark: *) = significant, **) = highly significant
Soil porosity has a strong relationship with the level of soil degradation, with a correlation coefficient value (r = -0.384) (Table 13). Soils with high porosity can reduce surface runoff and erosion because more water is absorbed into the soil [37]. Soils with low porosity accelerate runoff and increase the potential for soil degradation, especially in sloping areas. Particle Density has a positive correlation value of 0.252, indicating a tendency that the higher the particle density, the greater the estimated soil degradation, although this relationship is not significant. High particle density generally reflects a high content of heavy minerals or soil particle density, which can reduce pore space and decrease infiltration capacity. Bulk density showed a positive correlation of 0.111, meaning that the greater the bulk density, the greater the estimated degradation. This aligns with soil conservation theory, as high bulk density is associated with dense, poorly permeable soils prone to surface erosion. Soil texture showed a negative correlation (-0.127), which was also not significant. These parameters were analyzed integratively, as they influence each other in determining soil susceptibility to degradation.
Soil porosity is significantly affected by land use with a significance value (p = 0.000**). This indicates that differences in land use, such as dry fields, rice fields, or plantations, have a significant effect on soil porosity values. These findings underscore the importance of considering soil physical properties, such as porosity, in determining land use patterns and management practices to align with the characteristics and capabilities of the soil. Figure 8 shows that soil porosity varies across land uses, with the highest value in rice fields (31.14%), followed by plantations (15.91%) and the lowest in dry fields (14.15%). These differences reflect the significant influence of land management on the physical properties of the soil, where rice cultivation activities and waterlogged conditions in rice fields tend to increase porosity, while soil compaction in dry fields and plantations decreases it.
3.3.2 Soil degradation status
Table 14 shows that all environmental factors tested significantly influence SDS. The significance values for the land use and rainfall variables are at a very high level of significance (p = 0.000), indicating that these two factors significantly affect soil degradation status. High rainfall can increase the risk of erosion and nutrient leaching [38]. Without conservation, settlement, or dryland land use types are more prone to soil degradation. Slope and soil type also significantly influenced soil degradation status, with significance values of 0.016 and 0.017, respectively. Steeper slopes increase the velocity of surface runoff, which can accelerate erosion [39]. Certain soil types degrade more easily depending on their aggregate structure and stability [40]. The analysis results reinforce the importance of a land management approach that considers a combination of environmental factors to minimize soil degradation effectively [41]. Decision-making in land management can be more targeted and data-driven by identifying the factors that significantly influence soil degradation status.
Table 14. Environmental factor effects on SDS
|
Environmental Factor |
Soil Degradation Status |
|
Land Use |
0.000** |
|
Slope |
0.152ns |
|
Soil Type |
0.142ns |
|
Rainfall |
0.233ns |
Remark: ns) = not significant; **) = very significant
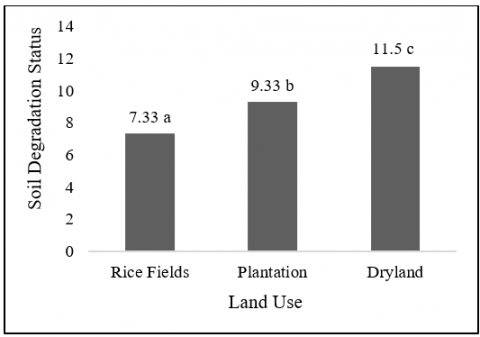
Figure 9 shows that land use significantly influences the status of soil degradation, as indicated by the significant differences between land use types. Rice fields have the lowest soil degradation status value of 7.33a, indicating that the management system in rice fields tends to maintain stable soil conditions and prevent severe degradation. Plantation land has an average degradation value of 9.33b, indicating a higher level of soil degradation than rice fields, but still lower than dryland. Dryland recorded the highest soil degradation status, at 11.5c significantly different from the other two land use types. This suggests that when managed openly without adequate conservation systems, dryland is more vulnerable to soil degradation [42].
Table 15. Determinant factors of SDS
|
Soil Degradation Parameters |
SDS |
|
Porosity |
-0.149 |
|
Bulk Density |
0.488** |
|
Particle Density |
0.162 |
|
Texture |
-0.213 |
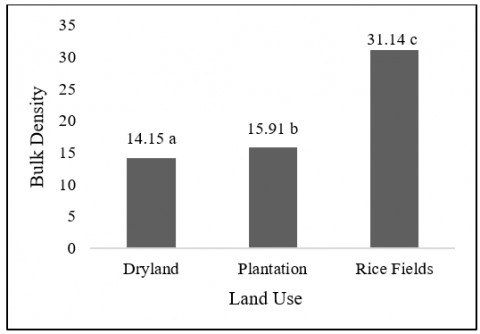
Soil bulk density is significantly influenced by land use factors. This indicates that variations in land use types such as fields, plantations, or rice paddies cause noticeable differences in soil bulk density (Figure 10). Land with intensive cultivation tends to have higher bulk density due to soil compaction, low organic matter content, and soil structure disturbance. The highest bulk density values were found in dry fields, followed by mixed plantations, and the lowest in rice fields. The high bulk density in dry fields is due to minimal soil cultivation activities and low organic matter content, and vegetation cover. Rice fields are often flooded and undergo intensive cultivation such as plowing, which can increase soil aggregation and reduce particle density. Mixed plantations do not have the same high intensity of soil cultivation as rice fields. High bulk density values indicate that the soil is in a more compacted state, hindering the movement of water and air within the soil. Dryland fields have the highest potential for soil degradation, followed by mixed plantations, while rice fields show the most stable conditions. Bulk density plays a role as a determining factor for SDS because it is influenced by land use and has a correlative relationship with SDS values.
3.3.3 Accuracy level
The average value of SDE is 20.80 (Table 16), while the average value of SDS is much lower at 9.80. This shows that the results of SDE tend to be higher than the actual degradation values based on SDS. The standard deviation (StDev) for SDE is 5.25, higher than that of SDS, which is only 2.56, indicating that the data of SDE is more spread out or has greater diversity than that of SDS.
Table 16. Data description of accuracy between SDE and SDS
|
Sample |
N |
Mean |
StDev |
|
SDE |
45 |
20.80 |
5.25 |
|
SDS |
45 |
9.80 |
2.56 |
Remark: N = Total sample
Table 17. Accuracy between SDE and SDS
|
DF |
P-Value |
T-Value |
T-Table |
|
63 |
0.255 |
1.15 |
1.67 |
Remark: DF= Degree of Freedom
The results of the T-test analysis between the SDE and SDS in the Tirtomoyo Sub-Watershed showed a T-Value < T-Table (1.15 < 1.67). The results prove that there is no significant difference between estimated (SDE) and actual (SDS) measurements of soil degradation (Table 17). The estimated results of soil degradation conform with actual conditions, so the potential for soil degradation mapped estimatively can be used as a reference in assessment without always having to conduct field surveys. The OBIA method can be used as an efficient soil degradation evaluation tool [46], especially for large or hard-to-reach areas. It can save time, costs, and energy in continuous environmental monitoring.
3.4 Land management recommendations
Based on the analysis, soil porosity and bulk density are the main determinants of soil degradation. These two parameters have a strong relationship in determining the physical quality of the soil, where low porosity is associated with high bulk density. This leads to reduced water infiltration, increased surface runoff, and ultimately accelerates the erosion process and the deterioration of soil structure. Soil management recommendations include Land management should include the application of organic materials to improve soil aggregation through organic fertilization adapted to sloping topography in the form of contour fertilization, so that the fertilizer is not easily washed away. This not only prevents fertilizer washout but also increases soil organic matter, which improves aggregation, thereby increasing porosity and decreasing bulk density [47]. Cover crops such as legumes or vetiver grass are also planted on sloping land to strengthen soil structure and reduce erosion. Cover crops help improve soil structure naturally through roots that penetrate compacted soil [48]. Cover crops increase soil pore space, thereby improving porosity, and help lower bulk density by promoting soil aggregation and reducing compaction. Conservation techniques such as minimum tillage and organic mulching help maintain stable soil structure and minimize mechanical disturbances that contribute to increased bulk density [49]. These steps can effectively reduce soil degradation by improving the fundamental physical properties of the soil [50]. Further research is needed to ensure that the analysis results are accurate and representative. It is recommended that the research area cover at least one subdistrict with varied land use, using high-resolution satellite imagery such as Sentinel-2A, and utilizing more than one source of data diversity, such as land use, soil type, and topography, to improve the accuracy of classification and weighting.
Agricultural land in the sub-watershed area is vulnerable to degradation due to erosion and landslide events that reduce the soil's carrying capacity. The results showed that the estimation of soil degradation in the Tirtomoyo Sub-Watershed area based on OBIA analysis of Sentinel-2A satellite imagery and weighting was classified as very low degradation estimation (DE I), low degradation estimation (DE II), and moderate degradation estimation (DE III). The actual soil degradation status is classified as lightly degraded (DI) and moderately degraded (DII). The level of accuracy between the estimation and actual conditions is not significantly different, indicating that the OBIA method using Sentinel-2A satellite imagery is accurate for estimating soil degradation. The determining factor for the SDE is porosity. At the same time, for the SDS, it is bulk density; thus, appropriate land management recommendations to address and prevent soil degradation include the application of organic matter through organic fertilizers, additional planting of cover crops, and organic mulching, as well as conservation tillage techniques aligned with contour lines. This study refers to applicable regulations and is modified using the OBIA Sentinel-2A approach with a focus on physical soil parameters so that further research can expand the study by including chemical and biological soil parameters and comparing them with other OBIA applications at the watershed scale to produce more comprehensive damage estimates and improve accuracy.
The authors thank Muhammad Rizky Romadhon, Tiara Hardian, and Viviana Irmawati, also to the Institute of Research and Community Service, for the research funding with a contract number 371/UN27.22/PT.01.03/2025.
[1] Wahyuti, I.S., Zulaika, I., Supriyadi, S., Tonabut, W. (2023). Precise land evaluation implementation of the regional spatial plan in the Sleman Regency to maintain human health and food security. AgriHealth: Journal of Agri-Food, Nutrition and Public Health, 4(2): 81. https://doi.org/10.20961/agrihealth.v4i2.67850
[2] Byaro, M., Nkonoki, J., Mafwolo, G. (2023). Exploring the nexus between natural resource depletion, renewable energy use, and environmental degradation in sub-Saharan Africa. Environmental Science and Pollution Research, 30(8): 19931-19945. https://doi.org/10.1007/s11356-022-23104-7
[3] Ferreira, C.S.S., Seifollahi-Aghmiuni, S., Destouni, G., Ghajarnia, N., Kalantari, Z. (2022). Soil degradation in the European Mediterranean region: Processes, status and consequences. Science of the Total Environment, 805: 150106. https://doi.org/10.1016/j.scitotenv.2021.150106
[4] Sukwika, T., Firmansyah, I. (2020). Mapping and policy strategy: The impact of soil degradation on biomass production in Depok City. Jurnal Pendidikan Geografi, 25(2): 114-127. https://doi.org/10.17977/um017v25i22020p114
[5] Sonderegger, T., Pfister, S. (2021). Global assessment of agricultural productivity losses from soil compaction and water erosion. Environmental Science & Technology, 55(18): 12162-12171. https://doi.org/10.1021/acs.est.1c03774
[6] Mosier, S., Córdova, S.C., Robertson, G.P. (2021). Restoring soil fertility on degraded lands to meet food, fuel, and climate security needs via perennialization. Frontiers in Sustainable Food Systems, 5: 1-18. https://doi.org/10.3389/fsufs.2021.706142
[7] Meles, M.B., Bradford, S., Casillas-Trasvina, A., Chen, L., Osterman, G., Hatch, T., Ajami, H., Crompton, O., Levers, L., Kisekka, I. (2024). Uncovering the gaps in managed aquifer recharge for sustainable groundwater management: A focus on hillslopes and mountains. Journal of Hydrology, 639: 131615. https://doi.org/10.1016/j.jhydrol.2024.131615
[8] Nita, I., Ayuningtyas, P., Prijono, S., Putra, A.N. (2024). Analysis of agricultural land infiltration capacity in Kalisari sub-watershed, Malang. Jurnal Tanah Dan Sumberdaya Lahan, 11(1): 117-123. https://doi.org/10.21776/ub.jtsl.2024.011.1.13
[9] Arrogante-Funes, P., Bruzón, A. G., Arrogante-Funes, F., Ramos-Bernal, R.N., Vázquez-Jiménez, R. (2021). Integration of vulnerability and hazard factors for landslide risk assessment. International Journal of Environmental Research and Public Health, 18(22): 1-21. https://doi.org/10.3390/ijerph182211987
[10] Widhiyastuti, A.N., Adjie, E.M.A., Fauzan, A.A., Supriyadi, S. (2023). Sustainable food agricultural land preservation at Sleman Regency, Indonesia: An attempt to preserve food security. AgriHealth: Journal of Agri-Food, Nutrition and Public Health, 4(1): 41. https://doi.org/10.20961/agrihealth.v4i1.67471
[11] Supangat, A.B., Basuki, T.M., Indrajaya, Y., Setiawan, O., et al. (2023). Sustainable management for healthy and productive watersheds in Indonesia. Land, 12(11): 1963. https://doi.org/10.3390/land12111963
[12] Hou, H., Ding, Z., Zhang, S., Guo, S., Yang, Y., Chen, Z., Mi, J., Wang, X. (2021). Spatial estimate of ecological and environmental damage in an underground coal mining area on the Loess Plateau: Implications for planning restoration interventions. Journal of Cleaner Production, 287: 125061. https://doi.org/10.1016/j.jclepro.2020.125061
[13] Htitiou, A., Boudhar, A., Lebrini, Y., Lionboui, H., Chehbouni, A., Benabdelouahab, T. (2021). Classification and status monitoring of agricultural crops in central Morocco: A synergistic combination of OBIA approach and fused Landsat-Sentinel-2 data. Journal of Applied Remote Sensing, 15(1): 14504. https://doi.org/10.1117/1.JRS.15.014504
[14] Serbouti, I., Raji, M., Hakdaoui, M., Pradhan, B., Lee, C.W., Alamri, A. M. (2021). Pixel and object-based machine learning classification schemes for lithological mapping enhancement of Semi-Arid Regions using Sentinel-2A imagery: A case study of the Southern Moroccan Meseta. IEEE Access, 9: 119262-119278. https://doi.org/10.1109/ACCESS.2021.3107294
[15] Basuki, Hermiyanto, B., Budiman, S.A. (2023). Identification and estimation of land damage using a method based on sentinel-2B satellite image OBIA and weighting of Mount Raung's slopes. Jurnal Ilmiah Rekayasa Pertanian Dan Biosistem, 11(1): 56-72. https://doi.org/10.29303/jrpb.v11i1.443
[16] Pirenaningtyas, A., Muryani, E., Santoso, D.H. (2020). Slope engineering techniques for soil mass movement management in Bengle Hamlet, Dlepih Village, Tirtomoyo District, Wonogiri Regency, Central Java Province. Jurnal Geografi: Media Informasi Pengembangan Dan Profesi Kegeografian, 17(1). https://doi.org/10.15294/jg.v17i1.21757
[17] Abbaszadeh, M., Bazrafshan, O., Mahdavi, R., Sardooi, E.R., Jamshidi, S. (2023). Modeling future hydrological characteristics based on land use/land cover and climate changes using the SWAT model. Water Resources Management, 37(10): 4177-4194. https://doi.org/10.1007/s11269-023-03545-6
[18] Guo, Y., Deng, R., Yan, Y., Li, J., Hua, Z., Wang, J., Tang, Y., Cao, B., Liang, Y. (2024). Dark-object subtraction atmosphere correction for water body information extraction in Zhuhai-1 hyperspectral imagery. The Egyptian Journal of Remote Sensing and Space Sciences, 27(2): 382-391. https://doi.org/10.1016/j.ejrs.2024.04.007
[19] Tian, J., Tian, Y., Wan, W., Yuan, C., Liu, K., Wang, Y. (2024). Research on the temporal and spatial changes and driving forces of rice fields based on the NDVI difference method. Agriculture, 14(7). https://doi.org/10.3390/agriculture14071165
[20] Chandra, M.A., Bedi, S.S. (2021). Survey on SVM and their application in image classification. International Journal of Information Technology, 13(5): 1-11. https://doi.org/10.1007/s41870-017-0080-1
[21] Romadhon, M.R., Aziz, A. (2022). Determination of flood susceptibility index using overlay-scoring data method based on geographic information system (GIS) in Semarang City, Central Java, Indonesia. AgriHealth: Journal of Agri-Food, Nutrition and Public Health, 3(2): 104. https://doi.org/10.20961/agrihealth.v3i2.60451
[22] Arisandy, T., Yuwono, S.B., Banuwa, I.S., Wahono, E.P., Kusumastuti, D.I., Endaryanto, T. (2023). Estimation of erosion hazard level using the USLE method and conservation directions in the watershed of Watermelon, Lampung. Jurnal Hutan Tropis, 11(3): 402. https://doi.org/10.20527/jht.v11i3.17635
[23] Erfani, S., Naimullah, M., Winardi, D. (2023). SIG GIS scoring and overlay methods for mapping landslide vulnerability in Lebak Regency, Banten. Jurnal Fisika Flux: Jurnal Ilmiah Fisika FMIPA Universitas Lambung Mangkurat, 20(1): 61-79. https://doi.org/10.20527/flux.v20i1.15057
[24] Mutiara, C., Wahyuni, S., Mujiyo, M., Cahyono, O., Dewi, W.S., Herawati, A., Romadhon, M.R., Istiqomah, N.M., Irmawati, V., Hardian, T., Hasanah, K., Anggita, A. (2024). Multi-source environmental diversity mapping to assess potential level of soil degradation on coffee plantations: Ende Regency, East Nusa Tenggara. IOP Conference Series: Earth and Environmental Science, 1413: 012008. https://doi.org/10.1088/1755-1315/1413/1/012008
[25] Mutiara, C., Bolly, Y.Y., Hutubessy, J.I.B., Aggrey, H., Dahiba, S., Palelet, E.Y., Romadhon, M.R., Irmawati, V., Hasanah, K. (2025). Rice field soil quality assessment through various environmental diversity sources in Ende District, East Nusa Tenggara, Indonesia. Asian Journal of Agriculture, 9(1): 264-275. https://doi.org/10.13057/asianjagric/g090128
[26] AbdelRahman, M.A.E. (2023). An overview of land degradation, desertification and sustainable land management using GIS and remote sensing applications. Rendiconti Lincei. Scienze Fisiche e Naturali, 34(3): 767-808. https://doi.org/10.1007/s12210-023-01155-3
[27] Maroah, S., Mujiyo, M., Cahyono, O., Romadhon, M.R., Irmawati, V., Istiqomah, N. M. (2025). Potential drought of agricultural land due to soil damage based on land mapping unit. Journal of Agricultural Engineering, 14(3): 1051. https://doi.org/10.23960/jtep-l.v14i3.1051-1060
[28] Pakasi, S., Mamahit, J. (2024). PKM Tulap farmers group Kombi District: Application of vegetative soil conservation technology with mango plants. Techno Science Journal, 6(1): 61-66. https://doi.org/10.35799/tsj.v6i1.54396
[29] Fadhlan, K., Tarigan, A.P.M., Nasution, Z.P. (2021). Determining deli riverwater management priorities using the erosion potential index. Jurnal Ilmiah Indonesia, 6(5): 399-405.
[30] Kapitan, N., Leuwol, F.S., Riry, R.B. (2025). Landslide hazard vulnerability level analysis in Hukuanakota Village, Inamoso District, West Seram Regency. Jurnal Jendela Pengetahuan, 18(2): 280-293. https://ojs3.unpatti.ac.id/index.php/jp/article/download/17826/9760.
[31] Jiwa, J.K.B., Maroeto, Purwadi. (2023). Standard study of soil damage in various land uses in Sukodono Village, Dampit District, Malang Regency, Indonesia. Agro Bali: Agricultural Journal, 6(1): 150-162. https://doi.org/10.37637/ab.v6i1.1112
[32] Zhao, L., Fang, Q., Hou, R., Wu, F. (2021). Effect of rainfall intensity and duration on soil erosion on slopes with different microrelief patterns. Geoderma, 396: 115085. https://doi.org/10.1016/j.geoderma.2021.115085
[33] Hikmat, M., Yatno, E. (2022). Karakteristik Tanah Sawah yang Terbentuk dari Bahan Endapan Aluvium dan Marin di DAS Cimanuk Hilir, Kabupaten Indramayu. Jurnal Tanah Dan Iklim, 46(1): 103-115. https://doi.org/10.21082/jti.v46n1.2022.103-11
[34] Aisyah, B.N., Baskoro, D.P.T., Murtilaksono, K. (2022). Estimated soil erosion and land cover planning of the upstream Jeneberang Watershed, South Sulawesi. Jurnal Ilmu Pertanian Indonesia, 27(2): 302-310. https://doi.org/10.18343/jipi.27.2.302
[35] Peng, X., Dai, Q. (2022). Drivers of soil erosion and subsurface loss by soil leakage during karst rocky desertification in SW China. International Soil and Water Conservation Research, 10(2): 217-227. https://doi.org/10.1016/j.iswcr.2021.10.001
[36] Utami, R.W., Lestariningsih, I.D., Wicaksono, K.S., Anggara, A.D., Lathif, S. (2024). The effect of land cover and rainfall on the physical properties of soil and spring water discharge in Cempaka Forest, Pasuruan, East Java. Jurnal Tanah Dan Sumberdaya Lahan, 11(1): 271-281. https://doi.org/10.21776/ub.jtsl.2024.011.1.29
[37] Kadir, S., Ridwan, I., Nurlina, N., Faisol, H., Badaruddin, B., Yarnie, N.S., Pratiwi, Y.E. (2022). Infiltration of various land covers of the Tabunio and Maluka watersheds, South Kalimantan Province. Jurnal Hutan Tropis, 10(3): 329. https://doi.org/10.20527/jht.v10i3.14976
[38] Lidarti, R., Putra, T.H.A., Amir, Y. (2025). Analysis of land suitability for avocado plants in Nagari Taeh Bukik, Payakumbuh District, Fifty Cities Regency. Jurnal Agroteknologi, 7: 49-56. https://doi.org/10.25077/jagur.7.1.49-56.2025
[39] Rahayu, E.M., Hidayat, K. (2025). Konservasi Tanah Longsor melalui Penanaman Akar Wangi di Desa Sukomulyo, Malang. Jurnal Abdi Masyarakat Indonesia (JAMSI), 5(2): 489-494. https://doi.org/10.54082/jamsi.1760
[40] Sefiana, R.R., Ma’shum, M., Padusung, P., Tejowulan, R.S. (2022). Soil consistency value levels on various types of degraded land in the Kayangan Area, North Lombok Regency. Journal of Soil Quality and Management, 1(2): 18-22. https://doi.org/10.29303/jsqm.v1i2.62
[41] Wirdatul, C., Hardianti, S., Sumianto, Asnimawati, Gustriana, E. (2020). The role of community education and the impact of floods on environmental health and the learning process of elementary school children in Batu Belah Village, Kampar Regency. Education and Learning Journal Volume, 4(2): 19-28. https://doi.org/10.31004/anthor.v4i2.373
[42] Toboroza, P.A., Febriyanti, D. (2025). The role of Walhi South Sumatra in advocating for flood problems in Palembang City in 2024. The Journalish: Social and Government, 6(1): 87-98. https://doi.org/10.55314/tsg.v6i1.897
[43] Shaheb, M.R., Venkatesh, R., Shearer, S.A. (2021). A review on the effect of soil compaction and its management for sustainable crop production. Journal of Biosystems Engineering, 46(4): 417-439. https://doi.org/10.1007/s42853-021-00117-7
[44] Sibiryakov, B., Leite, L.W.B., Sibiriakov, E. (2021). Porosity, specific surface area and permeability in porous media. Journal of Applied Geophysics, 186: 104261. https://doi.org/10.1016/j.jappgeo.2021.104261
[45] Robinson, D.A., Thomas, A., Reinsch, S., Lebron, I., Feeney, C.J., Maskell, L.C., Wood, C.M., Seaton, F.M., Emmett, B.A., Cosby, B.J. (2022). Analytical modelling of soil porosity and bulk density across the soil organic matter and land-use continuum. Scientific Reports, 12: 7085. https://doi.org/10.1038/s41598-022-11099-7
[46] Purwanto, A.D., Ibrahim, A., Ulfa, A., Parwati, E., Supriyono, A. (2022). Development of a benthic habitat identification model using an object-based image analysis (OBIA) segmentation approach and machine learning algorithm (Case study: Pari Island, Seribu Islands). National Maritime, 17(2): 131. https://doi.org/10.15578/jkn.v17i2.10377
[47] Mujiyo, M., Rahayu, R., Sutopo, N.R. (2020). Implementation of land evaluation for crop commodity development based on agroclimate suitability. AgriHealth: Journal of Agri-Food, Nutrition and Public Health, 1(2): 62-70. https://doi.org/10.20961/agrihealth.v1i2.44239
[48] Audette, Y., Congreves, K.A., Schneider, K., Zaro, G.C., Nunes, A.L.P., Zhang, H., Voroney, R.P. (2021). The effect of agroecosystem management on the distribution of C functional groups in soil organic matter. Biology and Fertility of Soils, 57(7): 881-894. https://doi.org/10.1007/s00374-021-01580-2
[49] Rossi, G., Beni, C., Neri, U. (2024). Organic Mulching: A sustainable technique to improve soil quality. Sustainability, 16(23): 10261. https://doi.org/10.3390/su162310261
[50] Guo, L., Liu, R., Men, C., Wang, Q., Miao, Y., Shoaib, M., Wang, Y., Jiao, L., Zhang, Y. (2021). Multiscale spatiotemporal characteristics of landscape patterns, hotspots, and influencing factors for soil erosion. Science of the Total Environment, 779: 146474. https://doi.org/10.1016/j.scitotenv.2021.146474