Bambang Sunardi![]() | Sismanto*
| Sismanto*![]() | Eddy Hartantyo
| Eddy Hartantyo![]() | Mochamad Nukman
| Mochamad Nukman![]()
© 2025 The authors. This article is published by IIETA and is licensed under the CC BY 4.0 license (http://creativecommons.org/licenses/by/4.0/).
OPEN ACCESS
Assessing seismic vulnerability is crucial for disaster preparedness and urban planning, especially in regions with complex geological conditions like the Yogyakarta Basin. The devastating 2006 earthquake caused severe structural damage, numerous casualties, and significant economic losses, highlighting the need for continuous seismic vulnerability assessment. This study assessed seismic vulnerability by determining the site’s resonant frequency, the horizontal-to-vertical spectral ratio (HVSR) peak amplitude, and the ground vulnerability index across the Yogyakarta Basin. Seismic microtremors were recorded at 707 locations within the Yogyakarta Basin. The analysis employed the log-normal distribution and automated frequency domain window rejection algorithms to process the microtremor data. These methods effectively eliminated noisy windows in high-variance datasets while minimizing the unnecessary exclusion of valid windows in low-variance datasets. Areas with Kg values exceeding 10 and low resonant frequencies were considered highly vulnerable because of the potential for ground motion amplification. Such regions include Sanden, Kretek, Pundong, Bambanglipuro, Jetis, Pleret, Sewon, Berbah, Prambanan, Banguntapan, Kalasan, and parts of Yogyakarta City, Depok, Gamping, and Kasihan. The results offer valuable insights for guiding land-use planning, prioritizing mitigation efforts, and informing seismic risk management. Moreover, the findings emphasize the need for integrated seismic hazard modeling to improve resilience and preparedness across the Yogyakarta Basin.
automated frequency-domain window rejection, basin environments, HVSR, seismic vulnerability, Yogyakarta Basin
Building damage caused by seismic activity is influenced by numerous factors, such as local geological conditions, building structures, soil-structure interactions, and earthquake characteristics, such as the distance to the epicenter [1-4]. Recent studies have indicated that local site effects play a critical role in determining ground motions during earthquakes [5-8], as they can substantially amplify or attenuate seismic ground motions [9]. The seismic vulnerability of an area is predominantly determined by site conditions rather than by other factors affecting ground shaking. It is widely acknowledged that ground motions are significantly amplified at sites with soft soils compared to those located near bedrock.
Several earthquakes have shown how local geological features significantly affect ground motions. Rokko Island in Kobe, Japan, experienced extensive damage during the 1995 earthquake due to soft soil deposits [10]. The Michoacán earthquake of 1985 and the Christchurch Earthquake Sequence of 2010–2011 also highlight the amplifying effects of soft sediment deposits on ground shaking. The 2004 Niigata-Chuetsu earthquake in Nagaoka, Japan, resulted in elevated ground accelerations and extensive structural damage due to the presence of soft sediment deposits. In Indonesia, the 2006 Yogyakarta earthquake was likely influenced by site effects associated with the region’s geological characteristics [11, 12].
Understanding local geological characteristics is essential for assessing site response during earthquakes, especially in seismically vulnerable regions such as sedimentary basins. Accurate site characterization allows for the design of more effective mitigation strategies to reduce infrastructure damage and protect public safety. Common assessment approaches include non-invasive techniques such as the Horizontal-to-Vertical Spectral Ratio (HVSR) method. These non-invasive techniques allow efficient field data collection to delineate subsurface profiles and assess soil vulnerability.
In site response analysis, the HVSR method has gained popularity due to its effectiveness in capturing local site effects and its operational simplicity [13-15]. HVSR analysis began with Bertelli [16] and Omori [17] and was further advanced by Aki [18], Gutenberg [19], Kanai and Tanaka [20]. Refinements were made by Nogoshi and Igarashi [21, 22], and the first English-language HVSR paper was published by Nakamura [23]. Japanese researchers developed HVSR [24-26], which has since spread globally. Although the adoption of HVSR was initially limited in the United States, its application has been steadily increasing in recent years [27-29]. The HVSR method is used to determine resonant site frequency (F0), peak HVSR amplitude (A0), and the ground vulnerability index (Kg). The resonant site frequency serves as a key indicator in site response and classification schemes [4, 30, 31], while the ground vulnerability index reflects dynamic soil properties and aids in identifying structurally weak areas [32, 33]. Damage caused by local geological factors can be assessed through various parameters, including F0, A0, and Kg derived from HVSR [34].
Seismic investigations increasingly rely on the resonant site frequency derived from HVSR analysis. However, the variability of ambient noise and environmental conditions introduces uncertainties in the determination of resonant site frequency, which can be categorized as temporal, azimuthal, or spatial [14, 35]. Temporal variations can affect the HVSR curve’s amplitude and shape and lead to deviations in resonant site frequency [36]. Additionally, the installation quality of equipment significantly influences the accuracy of HVSR measurements. Errors arise from the effectiveness of sensor isolation and sensor-ground coupling, which can contribute to uncertainties in determining the resonant site frequency [37, 38]. To address these challenges, a new method that combines log-normal distribution (LD) and automated frequency domain window rejection (AFDWR) has been developed to improve HVSR analysis. LD enables the smooth conversion of HVSR statistics from frequency to period, which is highly beneficial in earthquake engineering. AFDWR reduces variance and enhances data quality by effectively identifying and rejecting noisy windows [14, 35].
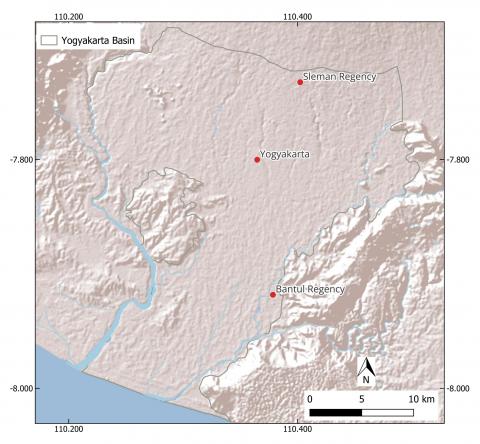
The Yogyakarta Basin, shaped by volcanic activity and fluvial processes, provides a unique environment for studying seismic characteristics using HVSR microtremor. The global population surge in recent decades has led to increased urbanization, concentrating people and infrastructure in cities. This trend, particularly in sedimentary basins, has heightened earthquake vulnerability due to soft soils and sediments. This study employed LD and AFDWR for HVSR analysis in the Yogyakarta Basin, located in southern Central Java (Figure 1). The area, bordered by the Progo River, Opak River, Mount Merapi, and the Indian Ocean, primarily consists of soft and stiff soils, including Quaternary deposits from Merapi volcano and weathered Tertiary sedimentary rocks. The loose soils amplify seismic waves, thereby increasing the potential for ground shaking and building damage. The Basin experienced severe devastation during the 2006 earthquake (Mw 6.3), which caused significant loss of life, injuries, and economic damage [39, 40]. The geological complexity of the area amplifies these risks, with soft sediment layers potentially increasing seismic wave amplification. This study aimed to determine the resonant site frequency (F0), peak HVSR amplitude (A0), and estimate the ground vulnerability index (Kg) across the Yogyakarta Basin.
Since the mid-Eocene, the Indo-Australian Plate has been subducting beneath the Eurasian Plate, leading to the formation of the Yogyakarta Basin in southern Central Java [41]. The subduction zone, located south of Java Island, progresses at a rate of 67–70 mm/year [42, 43], generating frequent seismic activity and contributing to the region’s high seismic vulnerability. Positioned within a forearc basin, the Yogyakarta Basin is subject to intense tectonic deformation and magmatism, forming prominent volcanic features such as the highly active Mount Merapi (Figure 1) [44]. This geodynamic setting shapes the region’s seismic hazard profile, underscoring the need for seismic vulnerability assessments.
Figure 1. The study area in the Yogyakarta Basin
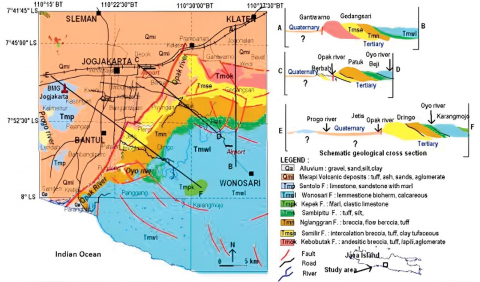
Geologically, the basin spans approximately 20 km in width and 45 km in length, extending from Yogyakarta City to the Indian Ocean. Its formation began in the Cenozoic era, resulting from volcanic extrusions from the Kulon Progo and Southern Mountains. Since the Oligo-Miocene period, these processes have shaped the region into a volcano-tectonic depression [45, 46]. Figure 2 illustrates the geological framework of the Yogyakarta Basin.
The basin is predominantly filled with thick volcanic and alluvial deposits derived from Mount Merapi, with sediment thickness exceeding 100 meters in several locations [47]. These soft, unconsolidated sediments create a strong impedance contrast with the underlying bedrock, defined as a significant difference in seismic wave velocity between geological layers, which plays a critical role in amplifying seismic waves. When seismic waves travel from high-velocity bedrock into lower-velocity sediments, their energy becomes trapped and amplified, increasing ground shaking intensity. This effect is particularly pronounced in areas with thicker sedimentary cover, where resonance can occur at lower frequencies, heightening structural vulnerability.
The destructive 2006 Yogyakarta earthquake exemplifies the impact of this geological configuration. Despite its moderate magnitude (Mw 6.3), the quake caused widespread damage and loss of life, particularly in regions under thick alluvium. The soft sediments amplified ground motion, demonstrating how local geological and stratigraphic conditions significantly influence seismic hazards in the basin.
The lithology of the Yogyakarta Basin includes several formations. The oldest is the Pre-Tertiary metamorphic rock, followed by the Wungkal Gamping Formation, which contains Upper to Middle Eocene calcarenite, sandstone, and mudstone [44]. Next is the Kebo Formation, consisting of conglomerates, sandstones, and tuff shales. The Butak Formation, often confused with the Kebo Formation, features Oligocene breccia, tuffaceous sandstone, and conglomerate. The Semilir Formation (Tmse) is characterized by tuff, pumice breccia, tuff dacite, andesite tuff, and tuffaceous mudstone and shale from the Lower Miocene. The Nglanggran Formation (Tmn) consists of Lower to Middle Miocene volcanic breccia. The Sambipitu Formation (Tms) includes Middle Miocene sandstone, shale, tuff, and conglomerate. The Oyo Formation features bioclastic limestone, marl, calcarenite, and limestone conglomerate from the Middle Miocene. The Wonosari Formation (Tmpw) contains Middle to Upper Miocene reef limestone, calcarenite, and tuff. Finally, the Kepek Formation consists of Upper Miocene layered limestone and marble, which interfingers with the Wonosari Formation. The top layer comprises alluvial deposits from Mount Merapi. In the western region, andesite breccias and lava flows dominate, while the eastern part is characterized by carbonate volcanic rock and limestone, forming a karst landscape [41].
Figure 2. Geology map of Yogyakarta Basin and surrounding [48]
The field surveys were conducted to record microtremor data in the Yogyakarta Basin in the Special Region of Yogyakarta. This area is characterized by its high population density and is a crucial region for studying seismic activity due to its unique geological features.
3.1 Data acquisition
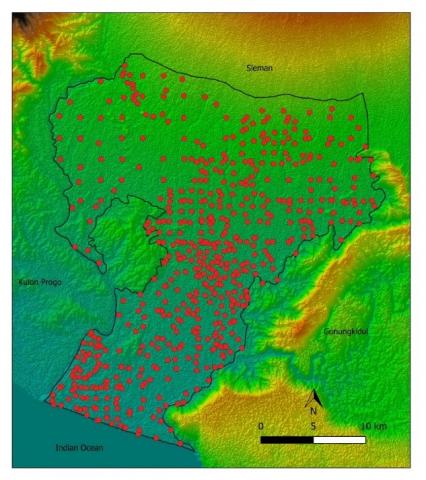
Seismic microtremors are low-amplitude, continuous ground vibrations caused by various natural and human activities. These microtremors can originate from ocean waves, wind, traffic, industrial machinery, and other daily sources. They are commonly used in geophysical studies to assess soil properties and analyze site response. In this study, microtremor data were collected across the Yogyakarta Basin using a Taurus digital seismograph and a Lennartz compact seismometer, recording at 707 sites, as shown in Figure 3. The 707 measurement sites were strategically distributed across the basin to ensure comprehensive spatial coverage. This distribution strategy supports regional interpolation and local analysis, contributing to developing a detailed and geologically representative site characterization map.
The recording duration at each site varied between 30 and 60 minutes, with a sampling rate of 100 samples per second. The data analysis concentrated on the frequency range of 0.2 to 20 Hz. During the analysis, extended time windows were employed to mitigate the influence of non-stationary noise sources, such as nearby cultural activities and heavy traffic. Specifically, only the stable segments of the recording, typically during periods of minimal transient disturbances, were selected by visually inspecting the amplitude and spectral stability over time. Time windows exhibiting irregular spikes or non-stationary patterns were excluded from further analysis. Additionally, measures were taken to avoid underground structures like conduits, water channels, and fiber optic cables. The data were evenly distributed to facilitate interpolation and create a detailed regional map.
Figure 3. The red dot indicates the microtremor experiment locations
3.2 HVSR processing of microtremor data
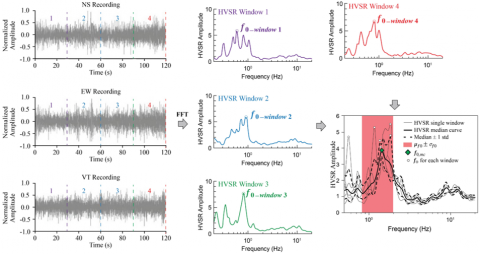
The procedure for processing HVSR data from ambient noise recordings is illustrated in Figure 4. The noise records, which include three components (NS, EW, V), are segmented into time windows that are at least ten times the duration of the estimated fundamental site period [49]. The HVSR curves are derived by calculating each window's Fourier amplitude spectra (FAS) ratio between the horizontal and vertical components. The horizontal components can be analyzed either separately or combined. In this study, we employ the geometric mean (GM) methodology [50, 51].
Figure 4. The schematic illustrates the typical process of deriving a median HVSR curve and its peak frequency from multiple ambient noise time windows
It shows individual HVSR curves for each window and summarizes statistical measures such as the median and standard deviation from the set of samples, adapted from Cox et al. [35].
The amplitude in the HVSR curves should follow a log-normal distribution (LD) for each window at each frequency. Subsequently, the median amplitude at each frequency is calculated by averaging the data over various windows. These median amplitudes are then connected across frequencies to create median HVSR curves [35]. Log-normal distribution ensures consistency with earthquake ground motion analysis and facilitates smooth transitions between HVSR statistics across frequencies and their corresponding reciprocal periods.
To improve the reliability of the HVSR curves, we apply an automated frequency-domain window rejection (AFDWR) method based on the approach proposed by Cox et al. [35]. This method objectively differentiates between viable and noisy windows by statistically evaluating the spectral stability of each window in the frequency domain. The logarithmic mean and standard deviation of HVSR values across all windows are calculated for each frequency. A window is considered an outlier and rejected if more than 20% of its HVSR values deviate beyond ±2 logarithmic standard deviations from the mean. Additionally, windows are excluded if they exhibit sharp spectral peaks, high variability, or transient noise spikes inconsistent with the general trend of other windows. After rejection, the final HVSR curve is computed as the median of the accepted windows, providing a robust estimate that is less sensitive to outliers and contamination. This approach enhances the consistency of the HVSR analysis, particularly in noisy or urban environments where ambient vibrations may be highly variable.
This study utilized a Python package designed for conducting HVSR processing [35, 52], detailing the AFDWR and LD. Cheng et al. describe the statistical approach incorporating azimuth variability [53]. In their 2021 work, Cheng et al. outline the methodology for defining statistics from spatially distributed HVSR measurements [14]. Using the HVSR method, we can effectively determine crucial seismic characteristics. The first resonant site frequency (F0) indicates the natural frequency of the soil or rock formations at the site, influenced by geological conditions such as soil type, depth, and stratification. The second characteristic is the peak amplitude of the HVSR (A0), which refers to the maximum value of the HVSR curve at the resonant site frequency. The peak amplitude estimates the amplification factor of the ground motion at the resonant frequency; high peak amplitudes suggest significant ground motion amplification, which is crucial for seismic hazard assessment and earthquake-resistant design. The ground vulnerability index (Kg) can predict weak areas in the ground and estimate potential damage from destructive earthquakes [4]. It is calculated by dividing the square of the peak amplitude of the HVSR curve by the resonant site frequency. The Kg value is utilized to identify soil vulnerability and qualitatively estimate areas susceptible to damage. As fundamental site response indicators, F0, A0, and Kg facilitate high-resolution spatial mapping.
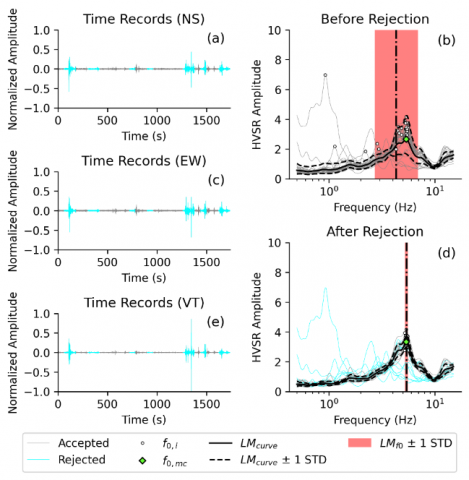
This study processed microtremor data in the Yogyakarta Basin using the log-normal distribution (LD) and automated frequency domain window rejection (AFDWR) algorithms. Figure 5 illustrates the HVSR noise recording process employing both LD and AFDWR. The example dataset was collected at point HV723. Figures 5(a), (c), and (e) depict the locations of the rejected windows within the time records of the three components. Meanwhile, Figures 5(b) and (d) showcase the HVSR data before and after applying the AFDWR algorithm. Using the proposed AFDWR algorithm, 9 out of 29 windows (32 percent) were rejected. When analyzing the time windows, it was found that many rejected windows displayed transient spikes in both the vertical and horizontal components. Methods based on the frequency domain were more effective in identifying and eliminating contaminated windows, thus improving the statistical reliability of the HVSR data. Applying the LD and AFDWR algorithms in the Yogyakarta Basin has demonstrated efficacy in rejecting noisy windows within datasets exhibiting high variance while avoiding excessive rejection of viable windows in datasets with low variance.
Figure 5. (a, c, and e) Records from a three-component (NS, EW, and VT) HVSR measurement at site HV723, with data segments rejected by AFDWR indicated by cyan windows, (b) Initial HVSR curves showing all values are highlighted with black circles before applying AFDWR, (d) Revised HVSR curves obtained by using the LD and AFDWR algorithms, with all rejected curves marked in cyan
4.1 Resonant site frequency
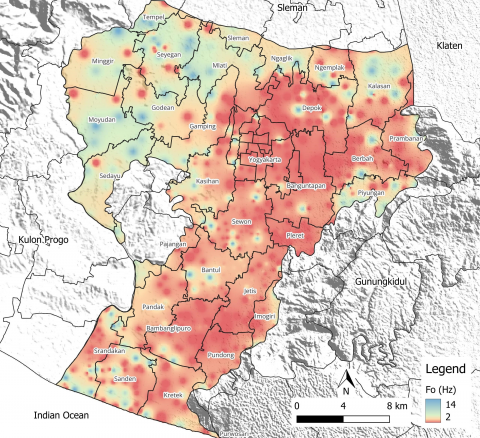
The soil structure within the study area shows a strong correlation with the HVSR curve patterns. The site's resonant frequency reflects the thickness of the sedimentary or alluvial layers. Lower frequencies point to thicker or softer deposits, while higher frequencies correspond to shallower layers [54, 55]. Relatively high frequencies correlate with thin sediment layers above the bedrock. In this study, the site response function at various ground locations exhibits peaks in the resonant site frequency ranging from 0.51 to 14.75 Hz, as indicated on the map of the resonant site frequency in Figure 6. Generally, these resonant site frequency values exhibit lateral fluctuations across the Yogyakarta Basin, highlighting substantial variations in bedrock depth. It is important to note that location effect parameters are robust; when comparing two nearby locations, changes in the resonant site frequency and peak amplitude of the HVSR level are minimal, and the fundamental shape of both horizontal components remains proportional.
Figure 6. Map of the resonant site frequency (F0) in Yogyakarta Basin
In the distal zones of the Yogyakarta Basin, such as the Bantul Regency, the relatively low frequencies suggest thick deposits or very soft materials. These areas commonly display HVSR curves with resonance peaks at lower frequencies, indicating thick sediment layers above the bedrock. Conversely, higher resonance frequencies in proximal zones, like the northwestern part of Sleman Regency, reflect thinner sediment layers above the bedrock. These areas register higher HVSR frequency values, indicating shallower sediment layers than distal regions.
Overall, the observed variations in resonance frequencies illustrate lateral fluctuations in bedrock depth across the Yogyakarta Basin. These spatial variations are likely influenced by depositional environments, tectonic history, and geomorphological processes, contributing to the heterogeneous sediment thickness distribution across the basin. These differences are critical for understanding the region's seismic response to soil structures, with distal zones generally characterized by lower frequencies and proximal zones by higher frequencies in HVSR curves. During seismic events, areas with lower resonant frequencies, typically indicating thicker, softer sediments, may be more prone to prolonged shaking and greater ground motion amplification, potentially increasing structures' seismic vulnerability in those regions.
The results indicate relatively low-frequency values in the southwest to the northeast areas covering Bantul Regency, including the subdistricts of Kretek, Pundong, Bambanglipuro, Jetis, Pleret, Sewon, Bantul, and Banguntapan, as well as in the city of Yogyakarta and the eastern part of Sleman. In contrast, relatively higher frequency values are observed in the northwestern region, namely Sleman Regency, including Moyudan, Minggir, Tempel, Seyegan, Godean, and parts of Gamping, Mlati, Sleman, and Sedayu subdistricts in Bantul Regency.
Previous research has bolstered the findings of a study examining local site conditions in the Yogyakarta Basin based on drill logs [46]. The investigation in the Pundong area, which explored drill holes reaching depths of 35 and 40 m, revealed extensive deposits of unconsolidated sediment. Specifically, clayey and muddy sand layers were identified at depths of up to 30 meters in Pundong. These findings suggest a propensity for high amplification and significant ground movements in this region.
Moreover, analyses indicate the prevalence of well-graded and poorly graded sand layers, along with silty sand layers, along Jl. Parangtritis. Consequently, this area may be classified as hazardous for residential purposes concerning seismic activity [46]. In the Bambanglipuro region, low shear wave velocity suggests the presence of loose, unconsolidated sediments. Meanwhile, the shear wave velocity structure indicates that medium-density sediments are predominant in the Kasihan, Banguntapan, and Sedayu areas [46].
From a disaster preparedness and urban planning perspective, these findings are essential. Areas with lower resonance frequencies, particularly in Bantul and Yogyakarta City, indicate thicker, softer sediments prone to prolonged shaking and amplification during seismic events. Urban infrastructure in these areas may require enhanced seismic design parameters, including deeper foundation systems, base isolation techniques, or stricter land-use regulations. Conversely, areas with higher frequencies may be less susceptible to intense shaking but still require localized assessments depending on structural density and occupancy.
4.2 HVSR amplitudes
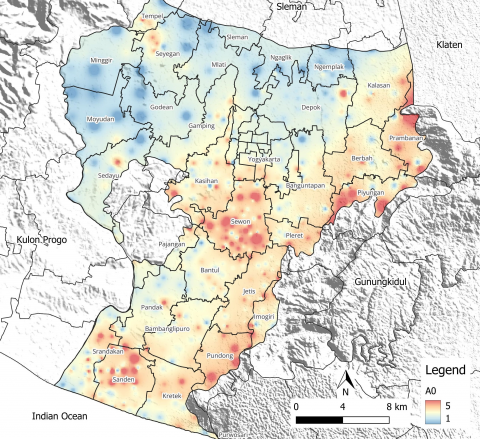
The differences in impedance between the bedrock and the overlying sediment layers are represented by the variation in HVSR peak amplitudes, as illustrated in Figure 7. The peak amplitude of the HVSR coefficients ranges from 0.01 to 14.46, indicating that certain soils in the Yogyakarta Basin may experience significant amplification during an earthquake. Excessive peak amplitudes of the HVSR levels are sometimes associated with resonance frequencies far below 1 Hz. Due to lateral and vertical fluctuations in the type and thickness of the ground surface, these values are randomly distributed.
Figure 7. Map of the peak amplitude of HVSR (A0) in Yogyakarta Basin
The amplitude of the HVSR curve correlates with the impedance contrast. A low amplitude indicates minimal contrast between the soft sediments and the underlying bedrock, while a high amplitude suggests a significant contrast between the soft sediments and the bedrock beneath.
Spatial variations in HVSR amplitudes can be attributed to heterogeneity in sediment composition, compaction levels, and depth to bedrock across the basin. High peak amplitudes are more frequently observed in areas with thick, unconsolidated sediments, such as the Bantul Regency, signifying strong impedance contrasts and the potential for high ground motion amplification. Conversely, lower amplitudes found in the northwestern part of Sleman may correspond to stiffer soils and shallower bedrock. These amplitude patterns directly affect seismic hazard assessment, as zones with higher HVSR amplitudes are more susceptible to intense shaking, which may exacerbate structural damage during an earthquake.
This knowledge is directly applicable to zoning regulations and emergency planning. Areas with high HVSR amplitudes may require stricter building codes, prioritization for retrofitting older structures, and designation as zones of special concern in emergency response strategies. For example, critical facilities such as hospitals, schools, and government buildings in these areas should be constructed with heightened structural resilience in mind.
4.3 Ground vulnerability index (Kg)
Researchers [4, 10] proposed the ground vulnerability index (Kg) to identify zones prone to seismic stress. Nakamura [4] emphasized that the most effective way to ensure safety is by obtaining Kg values before an earthquake, as these values can aid in reliably predicting potential seismic damage in a given area. The Kg value, which indicates soil vulnerability, is derived from the resonant site frequency (F0) and the peak amplitude of HVSR (A0), as defined by researchers in studies [4, 56]. This Kg value assigned to a site location enables the determination of its strength or weakness, allowing for the estimation of potential damage. Nakamura noted that locations exhibiting severe soil deformation tend to have Kg values much higher than 20, whereas undamaged sites generally have relatively lower Kg values [4]. As stated by Akkaya [33], the Kg value thresholds are categorized as follows: Kg ≤ 3 indicates low vulnerability; values between 3 and 5 suggest moderate vulnerability; values from 5 to 10 reflect high vulnerability; and Kg ≥ 10 corresponds to very high vulnerability.
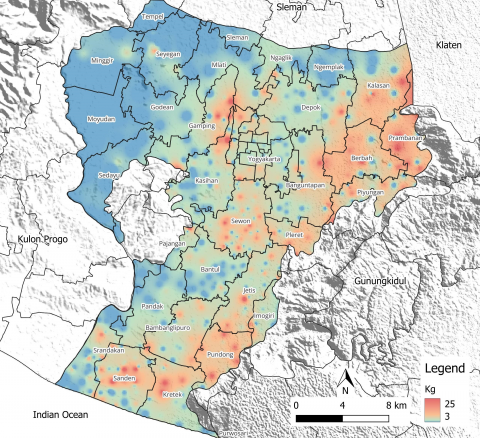
As depicted in Figure 8, the vulnerability index (Kg), derived from microtremor observations in the Yogyakarta Basin, is presented in a two-dimensional vulnerability index map of the studied region. The Kg varies from 0.1 to 49.71. The relatively high Kg values stretch across the southwest to northeast areas, including the subdistricts of Kretek, Pundong, Bambanglipuro, Jetis, Pleret, Sewon, Banguntapan, Berbah, Prambanan, and Kalasan. The results indicate that the moderate vulnerability index corresponds to areas with stiff ground, thus posing a moderate risk. Conversely, the ground vulnerability index is relatively low in the western region of the study area, primarily in the Sedayu, Moyudan, Godean, Seyegan, Minggir, Mlati, and Tempel subdistricts.
Figure 8. Map of the ground vulnerability index (Kg) in Yogyakarta Basin
The Kg reflects site effects and can strongly correlate with past damages in a seismic area, assessing potential liquefaction risk. Higher vulnerability indices are evident in areas where liquefaction is more likely [57, 58]. A study of liquefaction in the Yogyakarta Basin revealed significant risk in many regions, extending from southwest to northeast. At a depth of 1 to 2.3 meters below the ground surface, several clusters indicate where liquefaction has the potential to occur. The potential for very high liquefaction is found in Bantul, north of Banguntapan District, west of Piyungan District, and north of Pundong District. High liquefaction potential exists in Bantul, southern Kotagede subdistrict, and west of Piyungan subdistrict. Medium potential is observed in Kotagede, Banguntapan, Pajangan, Piyungan, and eastern Berbah subdistricts [59]. The results of this study also show a relatively high distribution of ground vulnerability index values in the region. Several areas not analyzed in previous research exhibit relatively high ground vulnerability index values, including the eastern part of Depok subdistrict, portions of Yogyakarta City, parts of Gamping subdistrict, and areas of Kasihan and Mlati.
Regions identified as highly vulnerable to earthquake hazards typically exhibit relatively high Kg values exceeding 10 alongside low dominant frequencies. The ground vulnerability index quantifies the vulnerability of the ground to seismic disturbances. A Kg value greater than 10, considered notably high, suggests that the soil characteristics significantly amplify seismic risk by enhancing the amplification of seismic waves. This amplification results in more intense surface vibrations during an earthquake. Furthermore, the resonant site frequency in HVSR analysis corresponds to the natural frequency at which the soil layers resonate when subjected to seismic waves. Lower frequency values usually indicate deeper and softer soil layers, more susceptible to significant seismic wave amplification. The ability of soft soils to resonate at these lower frequencies leads to prolonged shaking and increased vibration amplitude, thereby intensifying the effects of an earthquake.
In this study, specific areas identified as most vulnerable to earthquake hazards, characterized by ground vulnerability index (Kg) values greater than 10 and relatively low resonant site frequencies, include the subdistricts of Sanden, Kretek, Pundong, Bambanglipuro, Jetis, Pleret, Sewon, Berbah, Prambanan, Banguntapan, and Kalasan, as well as specific areas in Yogyakarta City, Depok, Gamping, and Kasihan. These regions require careful consideration in future earthquake risk reduction and mitigation plans. This underscores the importance of further research, including scenario-based earthquake hazard modeling, to effectively address seismic hazards in the Yogyakarta Basin environment.
The implications of these findings are substantial for disaster risk reduction and urban planning. The ground vulnerability index is a proxy for identifying areas where structural damage and soil deformation are more likely during an earthquake. Integrating Kg mapping into land-use planning can inform the designation of seismic microzonation areas, guide infrastructure investment decisions, and help prioritize the retrofitting of vulnerable structures. Furthermore, these maps can support the development of targeted evacuation routes and temporary shelter zones in highly vulnerable areas.
Additionally, local government agencies and stakeholders could incorporate Kg values into early warning and community awareness systems, strengthening preparedness efforts at the neighborhood level. Given that some areas with high Kg values, such as eastern Depok and parts of Mlati, were not highlighted in previous studies, the findings here offer new insights for updating existing hazard maps and resilience plans.
This study processed microtremor data from the Yogyakarta Basin using log-normal distribution (LD) and automated frequency domain window rejection (AFDWR) algorithms. The AFDWR algorithm successfully filtered out contaminated data windows, many exhibiting transient spikes in both vertical and horizontal components. Frequency domain-based methods proved effective in identifying and excluding noisy windows, improving the statistical accuracy of HVSR data. The application of LD and AFDWR algorithms showed strong efficacy in rejecting noisy windows within high-variance datasets while minimizing excessive rejection in low-variance datasets.
The observed site resonance frequencies are closely tied to the soil structure in the study area. Lower resonance frequencies correspond to thicker alluvial or sedimentary layers, while higher frequencies indicate shallower deposits. Site resonance frequencies across the Yogyakarta Basin range from 0.51 to 14.75 Hz, suggesting considerable lateral variations in bedrock depth. The peak amplitude of the HVSR reflects impedance contrasts between the bedrock and overlying sediments, with higher amplitudes indicating significant contrasts between soft sediments and bedrock or stiff sediments and lower amplitudes suggesting minimal contrasts.
The ground vulnerability index (Kg), calculated from the site resonance frequency (F0) and HVSR peak amplitude (A0), indicates areas of significant seismic risk. Kg values in the Yogyakarta Basin range from 0.1 to 49.71, with the most vulnerable areas extending from the southwest to northeast, including several subdistricts in Bantul and Sleman. This study also identified regions with high ground vulnerability indices that require attention in future earthquake risk mitigation planning, particularly in the subdistricts of Sanden, Kretek, Pundong, Bambanglipuro, Jetis, Pleret, Sewon, Berbah, Prambanan, Banguntapan, and Kalasan, as well as parts of Yogyakarta City, Depok, Gamping, and Kasihan.
These findings provide critical input for seismic risk assessment and urban planning in the Yogyakarta Basin. Regions identified with high Kg values and low resonance frequencies should be prioritized in disaster preparedness strategies, including enforcing stricter building codes, site-specific hazard mapping, and retrofitting plans for existing infrastructure. The vulnerability index maps can serve as a baseline to guide zoning decisions, restrict the development of high-occupancy or essential facilities in high-risk zones, and integrate seismic resilience into regional development policies.
Future research should expand on these results by incorporating scenario-based earthquake modeling and exploring the integration of site response characteristics into building code regulations. Further studies are also recommended to evaluate the relationship between Kg values and observed damage from past earthquakes, and to explore joint inversion techniques with borehole data and MASW profiles to refine 3D subsurface models for microzonation purposes.
This study was conducted in the Special Region of Yogyakarta, specifically in the Yogyakarta Basin. A team collected the data from the Meteorological, Climatological, and Geophysical Agency of Indonesia (BMKG). The data analysis and manuscript preparation were supported through the Domestic Scholarships for Master's (S2) and Doctoral (S3) Programs provided by the Center for Human Resources Development of the BMKG.
[1] Al-Amri, A.M., Abdelrahman, K., Fnais, M.S. (2022). Evaluation of seismic vulnerability index in Makkah Al-Mukarramah urban area, Saudi Arabia, using microtremor measurements. Arabian Journal of Geosciences, 15: 1305. https://doi.org/10.1007/s12517-022-10594-5
[2] Gosar, A., Roser, J., Motnikar, B.S., Zupancic, P. (2010). Microtremor study of site effects and soil-structure resonance in the city of Ljubljana (central Slovenia). Bulletin of Earthquake Engineering, 8(3): 571-592. https://doi.org/10.1007/s10518-009-9113-x
[3] Herak, M., Allegretti, I., Herak, D., Kuk, K., Kuk, V., Maric, K., Markusic, S., Stipcevic, J. (2010). HVSR of ambient noise in Ston (Croatia): Comparison with theoretical spectra and with the damage distribution after the 1996 Ston-Slano earthquake. Bulletin of Earthquake Engineering, 8(3): 483-499. https://doi.org/10.1007/s10518-009-9121-x
[4] Nakamura, Y. (1997). Seismic vulnerability indices for ground and structures using microtremor. In World Congress on Railway Research in Florence, Italy.
[5] Yuan, Y., Li, S., Yu, H., Xiao, M., Li, R., Li, R. (2023). Local site effect of soil-rock ground: 1-g shaking table test. Bulletin of Earthquake Engineering, 21: 3251-3272. https://doi.org/10.1007/s10518-023-01679-x
[6] Zahoor, F., Satyam, N., Rao, K.S. (2023). A comprehensive review of the nonlinear response of soil deposits and its implications in ground response analysis. Indian Geotechnical Journal, 54: 781-799. https://doi.org/10.1007/s40098-023-00798-1
[7] Ci̇velekler, E., Okur, V.D., Afacan, K.B. (2021). A study of the local site effects on the ground response for the city of Eskişehir, Turkey. Bulletin of Engineering Geology and the Environment, 80: 5589-5607. https://doi.org/10.1007/s10064-021-02285-4
[8] Sitharam, T.G., James, N., Kolathayar, S. (2018). Local site effects for seismic zonation. In Comprehensive Seismic Zonation Schemes for Regions at Different Scales, pp. 75-108. https://doi.org/10.1007/978-3-319-89659-5_5
[9] Kawase, H. (2003). Site effects on strong ground motions. In International Geophysics, 81: 1013-1030. https://doi.org/10.1016/S0074-6142(03)80175-4
[10] Nakamura, Y., Sato, T., Nishinaga, M. (2000). Local site effect of Kobe based on microtremor measurement. In Proceeding of the Sixth International Conference on Seismic Zonation EERI, Palm Springs California.
[11] Pawirodikromo, W. (2020). Middle value ground acceleration map and site effect in the Merapi sedimentary basin under the 2006 Yogyakarta, Indonesia earthquake. Natural Hazards, 102: 419-443. https://doi.org/10.1007/s11069-020-03932-x
[12] Rayhani, M.H.T., El Naggar, M.H., Tabatabaei, S.H. (2008). Nonlinear analysis of local site effects on seismic ground response in the Bam earthquake. Geotechnical and Geological Engineering, 26: 91-100. https://doi.org/10.1007/s10706-007-9149-0
[13] Alzahrani, M., Abdelrahman, K., Alfaifi, A., Al-Otaibi, N., Aljaber, A. (2022). Site effect estimation for shallow engineering bedrock using microtremor HVSR method and geotechnical borehole data, Riyadh city, Saudi Arabia. Journal of King Saud University - Science, 34(8): 102285. https://doi.org/10.1016/j.jksus.2022.102285
[14] Cheng, T., Hallal, M.M., Vantassel, J.P., Cox, B.R. (2021). Estimating unbiased statistics for fundamental site frequency using spatially distributed HVSR measurements and Voronoi Tessellation. Journal of Geotechnical and Geoenvironmental Engineering, 147(8). https://doi.org/10.1061/(ASCE)GT.1943-5606.0002551
[15] Zhu, C., Pilz, M., Cotton, F. (2020). Which is a better proxy, site period or depth to bedrock, in modelling linear site response in addition to the average shear-wave velocity? Bulletin of Earthquake Engineering, 18: 797-820. https://doi.org/10.1007/s10518-019-00738-6
[16] Bertelli, T. (1872). Osservazioni Sui Piccoli Movimenti Dei Pendoli in Relazione Ad Alcuni Fenomeni Meteorologici Del Pd Timoteo Bertelli Barnabita. Rome: Tip. Delle Scienze Matematiche e Fisiche.
[17] Omori, F. (1909). Preliminary report on the Messina-Reggio earthquake of Dec. 28, 1908. Bulletin of the Imperial Earthquake Investigation Committee, 3(1): 1909.
[18] Aki, K. (1957). Space and time spectra of stationary stochastic waves, with special reference to microtremors. Bulletin of the Earthquake Research Institute, 35: 415-456.
[19] Gutenberg, B. (1958). Microseisms. In Advances in Geophysics, 5: 53-92. https://doi.org/10.1016/S0065-2687(08)60075-8
[20] Kanai, K., Tanaka, T., (1961). On microtremors VIII. Bulletin of Earthquakes Research Institute, 39: 97-114.
[21] Nogoshi, M., Igarashi, T. (1970). On the amplitude characteristics of microtremor (Part 1). Earthquake, 23(4): 281-303. https://doi.org/10.4294/zisin1948.23.4_281
[22] Nogoshi, M., Igarash, T. (1971). On the amplitude characteristics of microtremor (Part 2). Earthquake, 24(1): 26-40. https://doi.org/10.4294/zisin1948.24.1_26
[23] Nakamura, Y. (1989). A method for dynamic characteristics estimation of subsurface using microtremor on the ground surface. Quarterly Report of Railway Technical Research, 30(1): 25-33.
[24] Arai, H., Tokimatsu, K. (2004). S-wave velocity profiling by inversion of microtremor H/V spectrum. Bulletin of the Seismological Society of America, 94(1): 53-63. https://doi.org/10.1785/0120030028
[25] Horike, M., Zhao, B., Kawase, H. (2001). Comparison of site response characteristics inferred from microtremors and earthquake shear waves. Bulletin of the Seismological Society of America, 91(6): 1526-1536. https://doi.org/10.1785/0120000065
[26] Satoh, T., Kawase, H., Matsushima, I.S. (2001). Estimation of S-wave velocity structures in and around the Sendai Basin, Japan, using array records of microtremors. Bulletin of the Seismological Society of America, 91(2): 206-218. https://doi.org/10.1785/0119990148
[27] Stephenson, W.J., Odum, J.K., Asten, M.W., Frankel, A.D. (2019). Shear-wave velocity in the Seattle Basin to 2 km depth characterized with the KRSPAC microtremor array method: Insights for urban basin-scale imaging. Seismological Research Letters, 90(3): 1230-1242. https://doi.org/10.1785/0220180194
[28] Teague, D.P., Cox, B.R., Rathje E.R. (2018). Measured vs. predicted site response at the Garner Valley downhole array considering shear wave velocity uncertainty from borehole and surface wave methods. Soil Dynamics and Earthquake Engineering, 113: 339-355. https://doi.org/10.1016/j.soildyn.2018.05.031
[29] Yong, A.K., Martin, A.J., Stokoe, K., Diehl, J. (2013). ARRA-funded VS30 measurements using multi-technique approach at strong-motion stations in California and Central-Eastern United States. U.S. Geological Survey, Reston, VA. Open File Report 2013-1102. https://doi.org/10.3133/ofr20131102
[30] Sabegh, Y.S., Rupakhety, R. (2020). A new method of seismic site classification using HVSR curves: A case study of the 12 November 2017 Mw 7.3 Ezgeleh earthquake in Iran. Engineering Geology, 270: 105574. https://doi.org/10.1016/j.enggeo.2020.105574
[31] Zhao, J.X., Irikura, K., Zhang, J., Fukushima, Y., Somerville, P.G., Asano, A., Ohno, Y., Oouchi, T., Takahashi, T., Ogawa, H. (2006). An empirical site-classification method for strong-motion stations in Japan using H/V response spectral ratio. Bulletin of the Seismological Society of America, 96(3): 914-925. https://doi.org/10.1785/0120050124
[32] Guven, I.T. (2022). Seismic vulnerability indices for ground in Derince-Kocaeli (NW Turkey). Environmental Earth Sciences, 81: 167. https://doi.org/10.1007/s12665-022-10288-x
[33] Akkaya, I. (2020). Availability of seismic vulnerability index (Kg) in assessing building damage in Van, Eastern Turkey. Earthquake Engineering and Engineering Vibration, 19(1): 189-204. https://doi.org/10.1007/s11803-020-0556-z
[34] Nadi, M.A.B., Nurfaizia, Karunia, M.N., Aspar, W.A.N., Barasa, W., Fudholi, A. (2022). Characterization of site effect and natural frequency of railway bridges. International Journal of Sustainable Development and Planning, 17(1): 243-249. https://doi.org/10.18280/ijsdp.170124
[35] Cox, B.R., Cheng, T.J, Vantassel, J.P., Manuel, L. (2020). A statistical representation and frequency-domain window-rejection algorithm for single-station HVSR measurements. Geophysical Journal International, 221(3): 2170-2183. https://doi.org/10.1093/gji/ggaa119
[36] Cipta, A., Cummins, P., Dettmer, J., Saygin, E., Irsyam, M., Rudyanto, A., Murjaya, J. (2018). Seismic velocity structure of the Jakarta Basin, Indonesia, using trans-dimensional Bayesian inversion of horizontal-to-vertical spectral ratios. Geophysical Journal International, 215(1): 431-449. https://doi.org/10.1093/gji/ggy289
[37] Molnar, S., Cassidy, J.F., Castellaro, S., Cornou, C., Crow, H., Hunter, J.A., Matsushima, S., Sánchez-Sesma, F.J., Yong, A. (2018). Application of microtremor horizontal-to-vertical spectral ratio (MHVSR) analysis for site characterization: State of the art. Surveys in Geophysics, 39: 613-631. https://doi.org/10.1007/s10712-018-9464-4
[38] Foti, S., Hollender, F., Garofalo, F., Albarello, D., et al. (2018). Guidelines for the good practice of surface wave analysis: A product of the InterPACIFIC project. Bulletin of Earthquake Engineering, 16: 2367-2420. https://doi.org/10.1007/s10518-017-0206-7
[39] World Bank Group. (2010). Preliminary damage and loss assessment: Yogyakarta and Central Java natural disaster. http://documents.worldbank.org/curated/en/581581468041086975.
[40] Trisilia, M.S., Sugiyanto, C., Rifa’i, A. (2024). Impact of natural disasters on mental health and welfare: The case of the 2006 Yogyakarta earthquake. Discover Psychology, 4: 7. https://doi.org/10.1007/s44202-023-00112-3
[41] Smyth, H., Hall, R., Hamiton, J., Kinny, P. (2005). East Java: Cenozoic basins, volcanoes, and ancient basement. Indonesian Petroleum Association. In 30th Annual Convention Proceedings, pp. 251-266. http://hdl.handle.net/20.500.11937/21075.
[42] Hall, R. (2009). Hydrocarbon basins in SE Asia: Understanding why they are there. Petroleum Geoscience, 15(2): 131-146. https://doi.org/10.1144/1354-079309-830
[43] Simons, W.J.F., Socquet, A., Vigny, C., Ambrosius, B.A.C., Abu, S.H., Promthong, C., Subarya, C., Sarsito, D.A., Matheussen, S., Morgan, P., Spakman, W. (2007). A decade of GPS in Southeast Asia: Resolving Sundaland motion and boundaries. Journal of Geophysical Research: Solid Earth, 112(6): 1-20. https://doi.org/10.1029/2005JB003868
[44] Irham Nurwidyanto, M., Kirbani, S.B., Sismanto, Waluyo. (2014). Subsurface modelling of Yogyakarta Basin using inversion of gravity data. International Journal of Geology, 4(3): 289-295.
[45] Setijadji, A.L.D., Fukuoka, B.K., Ehara, C.S., Watanabe, D.K. (2007). Geology of Yogyakarta earthquakes 2006 (Central Java, Indonesia): Current understanding based on integration of research outputs in geology. geophysics and remote sensing. Geophysical Research Abstracts, 9: 06767. https://meetings.copernicus.org/www.cosis.net/abstracts/EGU2007/06767/EGU2007-J-06767.pdf.
[46] Naing, T., Pramumijoyo, S., Kawase, H. (2009). Preliminary evaluation of local site condition in Yogyakarta Basin. Journal of Applied Geology, 1(1): 9-18. https://doi.org/10.22146/jag.7223
[47] Hendrayana, H., (1993). Hydrogeologie undGrundwasssergewinnung im Yogyakarta-Becken, Indonesien. Doktors Dissertation. Technischen Hochschule Aaachen.
[48] Rahardjo, W., Sukandarrumidi, Rosidi, H.M.D. (1995). Geological Map of the Yogyakarta Sheet, Jawa, Scale 1:100.000. Geological Research and Development Centre, Bandung.
[49] Bard, P.Y. (2004). Guidelines for the implementation of the H/V spectral ratio technique on ambient vibrations: Measurements, processing and interpretation. SESAME European Research Project EVG1-CT-2000–00026. https://sesame.geopsy.org/Papers/HV_User_Guidelines.pdf.
[50] Haghshenas, E., Bard, P.Y., Theodulidis, N. (2008). Empirical evaluation of microtremor H/V spectral ratio. Bulletin of Earthquake Engineering, 6: 75-108. https://doi.org/10.1007/s10518-007-9058-x
[51] Pileggi, D., Rossi, D., Lunedei, E., Albarello, D. (2011). Seismic characterisation of rigid sites in the ITACA database by ambient vibration monitoring and geological surveys. Bulletin of Earthquake Engineering, 9(6): 1839-1854. https://doi.org/10.1007/s10518-011-9292-0
[52] Vantassel, J. (2024). jpvantassel/hvsrpy: v2.0.0. Zenodo. https://doi.org/10.5281/zenodo.12735911
[53] Cheng, T., Cox, B.R., Vantassel, J.P., Manuel, L. (2020). A statistical approach to account for azimuthal variability in single-station HVSR measurements. Geophysical Journal International, 223(2): 1040-1053. https://doi.org/10.1093/gji/ggaa342
[54] Mucciarelli, M., Contri, P., Monachesi, G. (2001). An empirical method to assess the seismic vulnerability of existing buildings using the HVSR technique. Pure and Applied Geophysics, 158: 2635-2647. https://doi.org/10.1007/PL00001189
[55] Stanko, D., Markušić, S., Strelec, S., Gazdek, M. (2017). HVSR analysis of seismic site effects and soil-structure resonance in Varaždin city (North Croatia). Soil Dynamics and Earthquake Engineering, 92: 666-677. https://doi.org/10.1016/j.soildyn.2016.10.022
[56] Nakamura,Y., Saita, J., Sato, T. (2009). Application to world heritage sites. In Increasing Seismic Safety by Combining Engineering Technologies and Seismological Data, pp. 293-324. https://doi.org/10.1007/978-1-4020-9196-4_21
[57] Putti, S.P., Satyam, N. (2020). Evaluation of site effects using HVSR microtremor measurements in Vishakhapatnam (India). Earth Systems and Environment, 4: 439-454. https://doi.org/10.1007/s41748-020-00158-6
[58] Huang, H.C., Tseng, Y.S. (2002). Characteristics of soil liquefaction using H/V of microtremors in Yuan-Lin area, Taiwan. Terrestrial Atmospheric and Oceanic Sciences, 13(3): 325-338. https://doi.org/10.3319/TAO.2002.13.3.325(CCE)
[59] Hartantyo, E., Brotopuspito, H.K.S., Sismanto, H., Waluyo, H. (2015). Pemetaan profil kecepatan gelombang Shear dan implikasinya pada kejadian Liquefaction di sedimen volkaniklastik Lereng selatan gunung merapi Yogyakarta. Dissertation. Universitas Gadjah Mada, Yogyakarta.