Wisam Abdulabbas Abidalla*![]() | Basim Sh. Abed
| Basim Sh. Abed![]()
© 2025 The authors. This article is published by IIETA and is licensed under the CC BY 4.0 license (http://creativecommons.org/licenses/by/4.0/).
OPEN ACCESS
This study aims to assess the applicability of the QUAL2KW model in simulating water quality in the Euphrates River from downstream (d/s) of Haditha Dam to upstream (u/s) of Ramadi Barrage, covering a stretch of approximately 180 kilometers. The river reach within the study area was split into 18 segments of unequal length. River hydraulic and hydrologic characteristics, weather data, and GIS information about the location and coordinates for each river segment were used as input data to run this model. Several water quality parameters were assessed in this study with their concentrations measured through field sampling and laboratory analysis. Statistical metrics such as Relative Error (RE) and Root Mean Square Error (RMSE) were employed to evaluate the model's performance, using observed and simulated concentration data during two distinct periods: calibration in April (2024) and validation in July (2024). The statistical results demonstrated the reliability of the model for this river, as indicated by the strong agreement between observed and simulated concentrations of water quality parameters. Therefore, once the QUAL2KW model is provided with the river’s hydraulic and hydrological characteristics, along with data on pollutant discharges from wastewater treatment plants and drainage channels, it can be used by water resources management authorities to predict future concentrations of water quality parameters at any location within the study area. This can be achieved without the need for direct sampling by inputting data solely from the headwater (downstream of Haditha Dam at station (0) km, including discharge and pollutant concentrations.
Euphrates River, GIS, Haditha Dam, QUAL2KW, water quality simulation
In natural environments, river surface waters are a vital freshwater resource essential for human survival. Rivers and streams must be protected from pollution and the continuous threat of contaminants that include hazardous and conventional substances [1]. Surface water is the most susceptible to contamination because of the interaction of soil, groundwater, and atmosphere [2, 3]. The transport of contaminants in surface water has long been a major focus for environmental scientists and water resources engineers, leading to extensive research on the application of various water quality modeling approaches [4, 5]. The relationship between river surface water and pollutant loads can be represented through mathematical models that estimate the concentration of individual contaminants.
The QUAL2KW model, which is widely used in water quality studies, is based on differential equations governing steady, non-uniform, one-dimensional flow. The associated software serves as a simulation and analysis tool for assessing water quality in rivers and streams [6]. The model simulates temporal variations in water quality parameters, allowing for the analysis of both daily and seasonal changes. Al-Dalimy and Al-Zubaidi [7] applied the QUAL2KW model to the Hilla River, and their results demonstrated its suitability for simulating water quality parameters in this river. The QUAL2KW model will be employed in this study to simulate water quality in the Euphrates River. The primary advantage of using a water quality model is the ability to estimate pollutant concentrations at any point along the river and at any time, eliminating the need for continuous field sampling and laboratory analysis. This study focuses on the application of computerized modeling techniques, specifically the QUAL2KW model, to simulate and predict water quality in the northern segment of the Euphrates River.
2.1 Study area
The study area in the Euphrates River extends along the river reach from d/s of Haditha Dam (34.20700 N, 42.35500 E) at 0+00 km to u/s of Ramadi Barrage (33.43660 N, 43.25630 E) at 180+00 km of the river distance (path), as shown in Figure 1.
Figure 1. Location of the study area within the Euphrates River [8]
2.2 The quality model
The water quality model QUAL2KW is an analysis simulation program and a modeling software, which was developed by the U.S. Environmental Protection Agency (USEPA). The model software was employed as a tool designed for the simulation and analysis of water quality in streams and rivers [9]. The QUAL2KW model is usually used by environmental and water resource engineers and researchers in the specializations of environment and water to evaluate the effect of different pollution sources on river systems [10]. Abbas and Hassan [11] modified the QUAL2E “enhanced version” that operates on segments of equal length within the distance to QUAL2K, which was developed and then modified to form the QUAL2KW model [12], incorporating improvements and additional features for more accurate and comprehensive water quality assessments, can be operated on segments of different in length along the path distance of the river and can be calibrated automatically [13].
2.2.1 Description QUAL2KW model
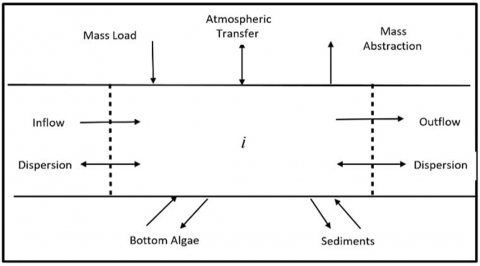
The QUAL2KW is a water quality model for streams and rivers. This model can be characterize as following: (1) Hydraulically, non-uniform - steady flow, the model is considered that the river is mixed very well vertically and laterally; (2) The kinetics of daily water quality, and the heat budget (model is simulating the parameters of water quality and the heat budget under the diurnal time scale); (3) The inputs and heat mass (simulation, both point, diffuse loads, and the abstractions by this model). In the QUAL2KW model, the stream or river reach in the study area is split into segments; these segments shortest simulation in the model as shown in Figure 2 [12].
Figure 2. Reach flow balance in stream or river [12]
The flow balance at steady state can applied for each segment as:
$Q_i=Q_{i-1}+Q_{i n, i}-Q_{a b, i}$ (1)
where, $Q_i$: Outflow from the segment (i) into the segment (i +1); $Q_{i-1}$: Inflow from the segment i -1 upstream; $Q_{i n, i}$: Total inflow into segment (i) from both point and non-point sources; $Q_{a b, i}$: The total outflow from the segment (i) due to both point and non-point abstractions. For each segment, the outflow can be calculated, and both flow depth and velocity are also calculated in one of two methods: Manning equations and the rating curves. Cross-sectional for each Segment in the river reach is assumed as a trapezoidal shape, under the assumption of “a steady, non-uniform” flow. In this model, the Manning equation is used for expressing the relationship between flow discharge and depth as the following formula [14]:
$Q=\frac{S^{\frac{1}{2}}}{n} \times \frac{A^{\frac{5}{3}}}{P^{\frac{2}{3}}}$ (2)
where, Q: river water flow (m3/sec); n: the coefficient of Manning roughness (unitless); S: river bottom slope (m/m); A: the cross-sectional area (m2); P: wetted perimeter (m). In it, the QUAL2KW model has a one-dimensional dispersion-advection equation as the following formula.
$V \frac{\partial C}{\partial T}=\frac{\partial\left(A \cdot E \frac{\partial_C}{\partial_X}\right)}{\partial_X} d x-\frac{\partial(A \cdot U \cdot C .)}{\partial x} d x+V \frac{d c}{d t}+S$ (3)
where, U: mean velocity (m/d); A: cross sectional area (m2); E: the coefficient of the longitudinal dispersion (m2/d); C: the concentration (g/m3); V: volume (m3); X: distance (m); S: the sinks and sources of constituent due to the mechanisms of reactions and the mass transfer (g/m3/d). This governing equation is solved by the QUAL2KW model under a steady state assumption for a concentration of water quality variables (Ci) in the water column for a segment (i) (Figure 3).
Figure 3. The mass balance in a segment (i) [12]
The mass balance equation form is as follows [15]:
$\begin{gathered}\frac{d_{c i}}{d t}=\frac{Q_{i-1}}{V i} C_{i-1}-\frac{Q_i}{V_i} C_i-\frac{Q_{a b, i}}{V_i} C_i+\frac{E_{i-1}}{V_i}\left(C_{i-1}-\right. \left.C_i\right)+\frac{E_i}{V_i}\left(C_{i+1}-C_i\right)+\frac{W_i}{V_i}+S_i\end{gathered}$ (4)
where, Ci: concentration of variable for a segment (i) in (g/m3); vi: a volume in (m3) for segment (i); Wi: external loading of constituent to a segment (i) in (g/d); t: time (d), Qi: outflow (m3/d) from the segment (i) into segment (i +1), Ei: a coefficient of bulk dispersion in (m2/d) between both a segments (i) and (i +1). Full description of the processes for this model is available in the Model user's manual [12].
2.2.2 Quality parameters
Water usually becomes contaminated because of human activities. The contamination due to biological, physical, and chemical factors reduces the quality of water and causes it to become toxic to humans and the environment. River discharge is the main factor in the running water environment, and the changing or modifying this discharge is accompanied by changes in other environmental parameters [16, 17]. The biological, physical, and chemical properties of water represent the most important factors that determine the uses of water for various purposes, as well as the growth and spread of aquatic organisms [18, 19]. Studies [20, 21] showed that aquatic organisms appear to have a high sensitivity to changes, whether chemical or physical, of the aquatic environment in which they live, and these factors affect the nature of the life of the organisms that live in them. In this study, the model was used to predict and simulate the concentration of quality parameters such as EC, TSS, pH, DO, and BOD5.
2.3 River discretization
The 180 km of the Euphrates River reach from 0.00 km downstream of Haditha Dam to 180.00 km upstream of Ramadi Barrage was divided into eighteen segments with unequal distance or length (Figure 4). The discharge and location with distance for point sources (Inflow-outflow) were listed in Table 1. To express the relationship between flow discharge and the water depth, the Manning equation was used [22]. The cross sections obtained from the Studies and Design Center of the Ministry of Water Resources, which were collected as data in 2023, and drawn in the Excel program.
Figure 4. The System segmentations with locations of pollution sources and branches along the Euphrates River
Table 1. Location and distance with coordinates for point sources
|
Rank |
Name |
Types of Sources |
Discharge (m3/sec) |
Location |
Distance from (0) Location (km) |
|
|
N |
E |
|||||
|
1 |
Al-Ramadi Drain Project / (MD1) |
Drain Channel |
+ 2.5 |
33.4800 |
43.0650 |
142 |
|
2 |
Al-Wrar Regulator |
Irrigation Channel |
Closed |
--- |
--- |
145 |
|
3 |
Al-Ramadi Drain Project / (MD3) |
Drain Channel |
+ 2.7 |
33.4650 |
43.2450 |
164 |
|
4 |
WTP (Ramadi) |
Wastewater T.P. |
+ 0.3 |
33.4140 |
43.2660 |
169 |
2.4 Sampling sites
Many sites of samples on the Euphrates River were chosen in the study area for the model of Calibration-Validation during the period extending from April to July 2024 (Figure 5). For a distance (path) of 180 km on the river reach listed in Table 2. These sites include the d/s of the Haditha Dam, wastewater treatment plants, Drainage channels, and various other sites, ending with the u/s of the Ramadi Barrage. The river discharge at the headwaters (zero location) and several locations along the river reach were measured at Centre sites using Discharge Measurement Device type (ADCP- M9) [23]. This device is characterized by a highly accurate system, which is specifically designed to measure the river discharge using sound waves.
Figure 5. The scheme of sampling sites
Table 2. Location and distance with coordinates for sampling sites
|
Point |
Name of Location |
Distance from (0) Location |
Coordinate |
|
|
N |
E |
|||
|
1 |
Haditha Dam (D/S) |
0+000 |
34.2076º |
42.3551º |
|
2 |
Al-Haqlania |
11+400 |
34.0869º |
42.3833º |
|
3 |
Al-Baghdadi |
50+000 |
33.8475º |
42.5825º |
|
4 |
Heet |
110+000 |
33.6286º |
42.8605º |
|
5 |
Ramadi Barrage (U/S) |
180+000 |
33.4366º |
43.2563º |
In addition, from the sampling sites, the samples were taken in water bottles, and to avoid unexpected changes in properties using the procedure of dipping unused plastic bottles at a depth of about 30 cm that water sample was obtained. The samples were analyzed at the laboratories of the Ministry of Science and Technology.
The input data required by the QUAL2KW model includes the meteorological characteristics such as "air temperature, wind speed, cloud cover, dew point temperature, and relative humidity" data for both, first round (in April) and the second round (in July) listed in Table 3.
Table 3. Input meteorological data (obtained from the weather station)
|
Month |
Air Temperature (℃) |
Wind Speed (m/sec) |
Cloud Cover (%) |
Dew Point Temperature |
Relative Humidity (%) |
|
April |
23.5 |
2.3 |
50 |
5.8 |
32 |
|
July |
37.5 |
3.8 |
40 |
15.9 |
28 |
The geographic characteristics, such as “length of each segment, location, longitude, and latitude” as listed in Table 4. The cross sections with distance along the Euphrates river reach drawn in AutoCAD programs for data collected from sites by the teams of engineers from the “National Centre for Water Resources Management” in the Ministry of Water Resources in the year (2023), from these river cross sections obtained the parameters required for applying the Manning equation such as left and right side slope, the longitudinal river bed slope, river bed width and the elevation of each segments were listed in Table 5. The Manning roughness coefficient for the river reach calculated in another study [24].
Table 4. Segmentation of the model, location, and length of each segment
|
Reach |
Length (km) |
D/S Location (km) |
Downstream |
|||||
|
Latitude |
Longitude |
|||||||
|
Dec. |
Min. |
Sec. |
Dec. |
Min. |
Sec. |
|||
|
0 |
0 |
0 |
34 |
6 |
5 |
42 |
22 |
45 |
|
1 |
9.8 |
9.8 |
34 |
0 |
42 |
42 |
25 |
12 |
|
2 |
11.32 |
21.1 |
34 |
4 |
0 |
42 |
30 |
9.6 |
|
3 |
10.20 |
31.3 |
33 |
58 |
34 |
42 |
33 |
56 |
|
4 |
8.67 |
40 |
33 |
54 |
32 |
42 |
32 |
20 |
|
5 |
10 |
50 |
33 |
50 |
51 |
42 |
34 |
57 |
|
6 |
10 |
60 |
33 |
54 |
10 |
42 |
39 |
42 |
|
7 |
12.55 |
72.5 |
33 |
50 |
55 |
42 |
46 |
9 |
|
8 |
9.31 |
81.8 |
33 |
47 |
16 |
42 |
43 |
30 |
|
9 |
10.05 |
91.9 |
33 |
43 |
45 |
42 |
43 |
10 |
|
10 |
8.32 |
100.2 |
33 |
40 |
42 |
42 |
47 |
27 |
|
11 |
9.75 |
110 |
33 |
37 |
43 |
42 |
51 |
38 |
|
12 |
10 |
120 |
33 |
31 |
31 |
42 |
56 |
44 |
|
13 |
14.59 |
134.5 |
33 |
29 |
16 |
43 |
3 |
53 |
|
14 |
11.02 |
145.6 |
33 |
31 |
31 |
43 |
6 |
55 |
|
15 |
7.88 |
153.5 |
33 |
27 |
27 |
43 |
14 |
28 |
|
16 |
10.21 |
163.7 |
33 |
24 |
24 |
43 |
15 |
23 |
|
17 |
4.98 |
168.7 |
33 |
28 |
10 |
43 |
21 |
23 |
|
18 |
11.3 |
180 |
33 |
27 |
2.7 |
43 |
26 |
3.6 |
Table 5. Manning formula data and elevations for the Euphrates River
|
Rank |
D/S (km) |
Elevation |
Manning Formula Parameters |
|||||
|
U/S (m) |
D/S (m) |
Average Bed Width |
L. Side slope |
R. Side slope |
River Bed slope |
Manning Roughness |
||
|
0 |
0 |
--- |
85.15 |
210 |
0.13 |
0.12 |
--- |
0.026 |
|
1 |
9.8 |
85.15 |
84 |
290 |
0.13 |
0.15 |
0.000117 |
0.026 |
|
2 |
21.12 |
84 |
83.04 |
305 |
0.15 |
0.12 |
0.000084 |
0.026 |
|
3 |
31.32 |
83.04 |
78.95 |
290 |
0.18 |
0.08 |
0.000400 |
0.026 |
|
4 |
40 |
78.95 |
78.35 |
310 |
0.12 |
0.091 |
0.000096 |
0.026 |
|
5 |
50 |
78.35 |
66 |
325 |
0.13 |
0.088 |
0.001235 |
0.026 |
|
6 |
60 |
66 |
64.42 |
210 |
0.12 |
0.12 |
0.000158 |
0.026 |
|
7 |
72.55 |
64.42 |
61.18 |
220 |
0.09 |
0.11 |
0.000258 |
0.026 |
|
8 |
81.86 |
61.18 |
58.78 |
210 |
0.09 |
0.13 |
0.000257 |
0.026 |
|
9 |
91.92 |
58.78 |
56.53 |
255 |
0.12 |
0.12 |
0.000223 |
0.026 |
|
10 |
100.25 |
56.53 |
53.07 |
223 |
0.13 |
0.14 |
0.000415 |
0.026 |
|
11 |
110 |
53.07 |
48.56 |
220 |
0.13 |
0.09 |
0.000462 |
0.026 |
|
12 |
120 |
48.56 |
47.66 |
210 |
0.12 |
0.1 |
0.000091 |
0.026 |
|
13 |
134.59 |
47.66 |
47.48 |
310 |
0.1 |
0.1 |
0.000012 |
0.026 |
|
14 |
145.62 |
47.48 |
47.4 |
210 |
0.85 |
0.08 |
0.000072 |
0.026 |
|
15 |
153.5 |
47.4 |
46.46 |
195 |
0.1 |
0.12 |
0.000119 |
0.026 |
|
16 |
163.71 |
46.46 |
45.53 |
189 |
0.123 |
0.123 |
0.000091 |
0.027 |
|
17 |
168.7 |
45.53 |
43.89 |
185 |
0.40 |
0.32 |
0.000328 |
0.027 |
|
18 |
180 |
43.89 |
43.7 |
123 |
0.25 |
0.30 |
0.000168 |
0.027 |
Different data groups that required in the QUAL2KW model for describing the model boundary conditions, also the required data group in the headwater site to define the U/S boundary conditions for the model domain, and the D/S conditions, which can be computed internally. The point sources and other location data group used as input data that enter simulated river segments are shown in Tables 6-9.
Table 6. The water quality parameters (observed) for different locations along the reach at Euphrates River - April (2024)
|
Name of Location |
Distance from (0) Location |
Inflow (m3/sec) |
EC (μs/cm) |
TSS (mg/L) |
pH |
DO (mg/L) |
BOD5 (mg/L) |
|
Al-Haqlania |
11+400 |
200 |
958 |
50 |
8.2 |
6.8 |
8.9 |
|
Al-Baghdadi |
50+000 |
197 |
961 |
50 |
8.3 |
6.3 |
4.4 |
|
Heet |
110+000 |
191 |
999 |
60 |
8.3 |
6.4 |
16 |
|
Ramadi Barrage (U/S) |
180+000 |
188 |
1103 |
40 |
8.2 |
6.6 |
7.2 |
Table 7. The input water quality parameters (observed) for headwater and point sources along the reach at Euphrates River - April (2024)
|
Name of Location |
Distance from (0) Location |
Inflow (m3/sec) |
EC (μs/cm) |
TSS (mg/L) |
pH |
DO (mg/L) |
BOD5 (mg/L) |
|
Haditha Dam (D/S) |
0+00 |
203 |
961 |
50 |
8.2 |
6.8 |
8 |
|
MD1 |
142+500 |
2.50 |
3890 |
45 |
8.0 |
6.3 |
7.4 |
|
MD3 |
164+500 |
2.70 |
4980 |
60 |
8.3 |
6.5 |
9.6 |
|
WTP (Ramadi) (Wastewater) |
169+00 |
0.30 |
2600 |
95 |
8.1 |
6.2 |
5.2 |
Table 8. The water quality parameters (observed) for different locations along the reach at the Euphrates River - July (2024)
|
Name of Location |
Distance from (0) Location |
Inflow (m3/sec) |
EC (μs /cm) |
TSS (mg/L) |
pH |
DO (mg/L) |
BOD5 (mg/L) |
|
Al-Haqlania |
11+400 |
261 |
1040 |
40 |
8.2 |
6.8 |
6.3 |
|
Al-Baghdadi |
50+000 |
256 |
1090 |
42 |
8.1 |
6.4 |
4.9 |
|
Heet |
110+000 |
247 |
1120 |
48 |
8.2 |
6.5 |
4.3 |
|
Ramadi Barrage (U/S) |
180+000 |
239 |
1015 |
56 |
7.8 |
6.5 |
3 |
Table 9. The input water quality parameters (observed) for headwater and point sources along the reach at the Euphrates River
|
Name of Location |
Distance from (0) Location |
Inflow (m3/sec) |
EC (μs/cm) |
TSS (mg/L) |
pH |
DO (mg/L) |
BOD5 (mg/L) |
|
Haditha Dam (D/S) |
0+00 |
265 |
1060 |
50 |
8.2 |
6.2 |
4.8 |
|
MD1 |
142+500 |
2.00 |
4110 |
60 |
8.0 |
6.5 |
8.2 |
|
MD3 |
164+500 |
2.250 |
5720 |
70 |
8.1 |
6.1 |
12.1 |
|
WTP (Ramadi) (Wastewater) |
169+00 |
0.30 |
2860 |
90 |
8.4 |
5.6 |
16.3 |
4.1 The QUAL2KW modelling
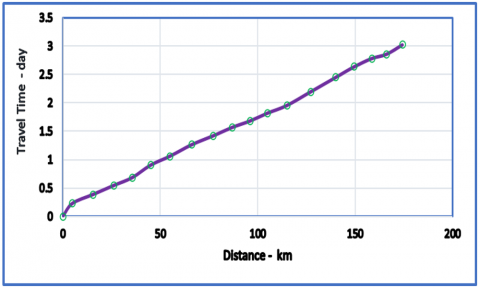
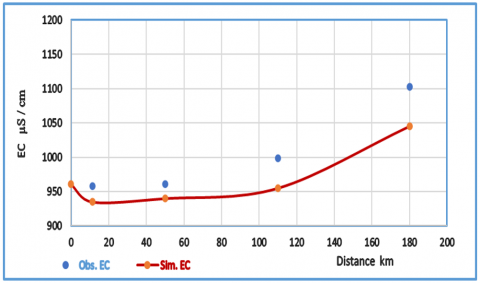
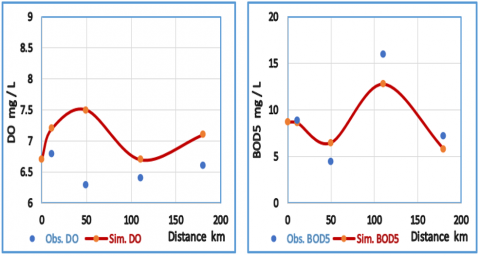
The QUAL2KW model was chosen to predict and simulate the value of the concentration of the various water parameters of the Euphrates River in the study area. The model was calibrated in the first round (April 2024) and validated in the second round (July 2024). To operate or run model software, the observed data collected from sites were used, and all required data were completed as inputs, such as hydraulic and hydrological data, climate elements, and others that pertain to the Euphrates River. In the software run, a computation step has been set to 1.8 min. This model was operating and running until the adjustment of the system’s parameters. Several parameters of water quality (EC, TSS, pH, DO, BOD5) were included in this study. The QUAL2KW modelling of water qualities in the Euphrates River for water depth, flow velocity, and travel time with distance as shown in Figures 6-8, and both observed and simulated data on April 13-14, 2024, as shown in Figures 9-11, for the first round.
Figure 6. Water depth of Euphrates River within the study area in (m) - April (2024)
Figure 7. Flow velocity of Euphrates River within the study area in (m/sec) - April (2024)
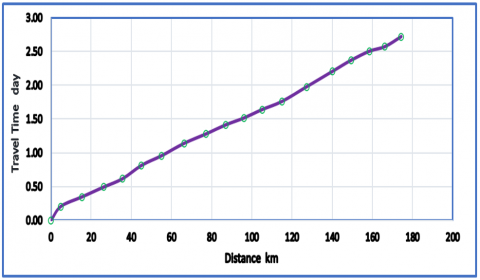
Figure 8. Wave travel time of the Euphrates River in (days) - April (2024)
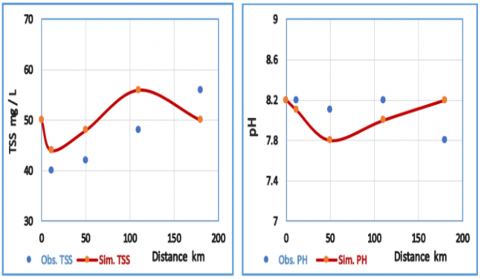
For the curves in Figures 6-17, in both simulated and observed quality values and during the calibration in April and the validation in July, the observed curves starting from the first station (Haditha Dam) do not show significant changes or differences and remain almost identical or very similar to the last station (Ramadi Barrage), which is the same trend as in simulated curves that Provided by the QUAL2KW model.
Figure 9. Relation between observed and simulated (EC) for Euphrates River Water - During the first round in April (2024)
Figure 10. Relation between observed and simulated (TSS and pH) for Euphrates River Water - During the first
Figure 11. Relation between observed and simulated (DO and BOD5) for Euphrates River Water
The QUAL2KW modelling of water qualities in the Euphrates River for (water depth, flow velocity, and travel time) with distance as shown in Figures 12-14, and both observed and simulated data on July 20-21 (2024) as shown in Figures 15-17, for the second round.
Figure 12. Water depth of the Euphrates River within the study area in (m) - July (2024)
Figure 13. Flow velocity of Euphrates River within the study area in (m/sec) - July (2024)
Figure 14. Wave travel time of Euphrates River in (days) - July (2024)
Figure 15. Relation between observed and simulated (EC) for Euphrates River Water - During the second round in July (2024)
Figure 16. Relation between observed and simulated (TSS and pH) for Euphrates River Water - second round
Figure 17. Relation between Observed and simulated (DO and BOD5) for Euphrates River Water - second round
4.2 Suitability and acceptability of applying the QUAL2KW model
In both calibration (the first round) and validation (the second round), statistical test were used for testing the suitability of applying QUAL2KW model to the Euphrates River, and in predicting or simulating concentrations of quality parameters for the river water within the study area such as (RE and RMSE) [25, 26], which applied between each of the simulated data from the model and observed data from the sites for quality parameters (EC, TSS, PH, DO, and BOD5), in the Relative Error (RE) test, the value of the results for all parameters were close to zero and the values for the two period were close together which means acceptable. In addition, for the Root Mean Square Error (RMSE) test, the value of the results lies between normal limits (zero - 2) or the nearest value, and the values for the two periods were close together, which also means acceptable as listed in Table 10.
Table 10. Results of the statistical test for two rounds (calibration & validation)
|
Parameter |
(RE) |
(RMSE) |
||
|
Calibration |
Validation |
Calibration |
Validation |
|
|
EC |
0.0212 |
0.0611 |
2.8306 |
4.5955 |
|
TSS |
0.0970 |
0.1292 |
8.7464 |
6.1644 |
|
PH |
0.0242 |
0.0312 |
0.2121 |
0.9739 |
|
DO |
0.0929 |
0.0683 |
0.6964 |
0.4796 |
|
BOD5 |
0.0646 |
0.1174 |
0.7262 |
0.5315 |
Generally, after looking at the statistical results, the results showed agreement and closeness with a big convergence between the simulated and obtained values for both periods, and the application of this model in calculating the concentrations of water parameters for this river. Finally, according to the good agreement and acceptability between obtained values of concentrations and the values of concentrations calculated from the model, reaching a state of confidence and reassurance in the case of suitability for applying the QUAL2KW model to the Euphrates River by the National Center for Water Resources Management and evaluate the parameters concentration of water quality involved in the model tools in “any time and site along the river reach” in the future period within the study area.
From the results of the statistical test, the QUAL2KW model is more suitable for predicting and simulation Euphrates River water quality and can give more accurate results, and successfully simulate water quality parameters with an average RMSE lying between normal limits (0-2) or the nearest value. In addition, after entering all required data as input in the QUAL2KW model, which included the hydraulic and hydrologic parameters with all information about point sources such as wastewater treatment plants, drainage channels, etc., that supply this river within the study area. It has become possible to use this model (in steady flow conditions) to simulate and predict the parameters concentration of water quality involved in the model in the future period without taking any samples from any site along river reach that requires analysis in the laboratory with cost, effort, and time just sampling once from headwater site at location (0.00) km.
The authors are thankful to the University of Baghdad, College of Engineering, Department of Water Resources Engineering, for their support.
[1] Ferreira, D.M., Fernandes, C.V.S., Kaviski, E., Fontane, D. (2020). Transformation rates of pollutants in rivers for water quality modelling under unsteady state: A calibration method. Journal of Hydrology, 585: 124769. https://doi.org/10.1016/j.jhydrol.2020.124769
[2] Ibrahim, J.A. (2011). Pollution of mining industry sulfur purification plant at Al Mishraq. Journal of Engineering, 17(5): 1159-1173. https://doi.org/10.31026/j.eng.2011.05.10
[3] Khlaif, B.M., Al-Hassany, J.S. (2023). Assessment of the Euphrates River’s water quality at some sites in the Iraqi governorates of Babylon and Karbala. IOP Conference Series: Earth and Environmental Science, 1262(2): 022021. https://doi.org/10.1088/1755-1315/1262/2/022021
[4] Khaleefa, O., Kamel, A.H. (2021). On the evaluation of water quality index: Case study of Euphrates River, Iraq. Knowledge-Based Engineering and Sciences, 2(2): 35-43. https://doi.org/10.51526/kbes.2021.2.2.35-43
[5] Khudair, B.H. (2013). Assessment of water quality index and water suitability of the Tigris river for drinking water within Baghdad city, Iraq. Journal of Engineering, 19(6): 764-774.
[6] Hobson, A. (2013). Using QUAL2KW as a decision support tool: Considerations for data collection, calibration, and numeric nutrient criteria. Master’s thesis, Utah State University. https://digitalcommons.usu.edu/etd/1511.
[7] Al-Dalimy, S.Z., Al-Zubaidi, H.A. (2023). Application of QUAL2K model for simulating water quality in Hilla River, Iraq. Journal of Ecological Engineering, 24(6): 272-280. https://doi.org/10.12911/22998993/162873
[8] Urutseg. (2021). Iraq location map [Map]. Wikimedia Commons. https://commons.wikimedia.org/wiki/User:Urutseg/gallery.
[9] Kori, B.B., Shashidhar, T., Mise, S. (2013). Application of automated QUAL2KW for water quality modeling in the river Karanja, India. Global Journal of Bio-Science and Biotechnology, 2(2): 193-203. http://water.lecture.ub.ac.id/files/2014/03/Journal%20aplikasi-QUAL2KW.pdf.
[10] Al-Juhaishi, M.R., Fabrice, M., Motelica-Heino, M. (2024). Frequency analysis of the Loire River water total suspended solid and electrical conductivity (Orléans, France). IOP Conference Series: Earth and Environmental Science, 1374(1): 012071. https://doi.org/10.1088/1755-1315/1374/1/012071
[11] Abbas, A.A.A., Hassan, F.M. (2018). Water quality assessment of Euphrates River in Qadisiyah province (Diwaniyah River), Iraq. Iraqi Journal of Agricultural Science, 49(2): 251-261.
[12] Chapra, S.C., Pelletier, G.J. (2003). QUAL2K: A modeling framework for simulating river and stream water quality (Beta version): Documentation and user’s manual. Tufts University, Civil and Environmental Engineering Department.
[13] Pelletier, G.J., Chapra, S.C. (2005). QUAL2KW theory and documentation (Version 5.1): A modelling framework for simulating river and stream water quality. http://www.ecy.wa.gov/programs/eap/models/2005.
[14] Mustafa, A.S., Sulaiman, S.O., Shahooth, S.H. (2017). Application of QUAL2K for water quality modeling and management in the lower reach of the Diyala River. Iraqi Journal of Civil Engineering, 11: 66-80. www.iasj.net/iasj/download/5df0696bc08cf960
[15] Pelletier, G.J., Chapra, S.C., Tao, H. (2006). QUAL2KW—A framework for modeling water quality in streams and rivers using a genetic algorithm for calibration. Environmental Modelling & Software, 21(3): 419-425. https://doi.org/10.1016/j.envsoft.2005.07
[16] Ismail, A.H., Abed, G.A. (2013). BOD and DO modeling for Tigris River at Baghdad city portion using QUAL2K model. Journal of Kerbala University, 9(1): 257-273.
[17] Hadi, Z.A., Al-Juhaishi, M.R. (2023). Water quality of Tigris River in Mosul and Al-Amarah cities by using CCME water quality index. Journal of Engineering, 29(3): 170-181. https://doi.org/10.31026/j.eng.2023
[18] Kassir, M.G., Dawood, L.M., Fuad, F. (2015). Quality assurance for Iraqi bottled water specifications. Journal of Engineering, 21(10): 114-132. https://doi.org/10.31026/j.eng.2015.10.08
[19] Al-Rubaie, F.M., Al-Musawi, N.O. (2019). The effect of Diyala River water quality on the quality of Tigris River water using GIS mapping. Journal of Engineering, 25(10): 71-87. https://doi.org/10.31026/j.eng.2019
[20] Elliott, H.A., O’Connor, G.A., Lu, P., Brinton, S. (2002). Influence of water treatment residuals on phosphorus solubility and leaching. Journal of Environmental Quality, 31(4): 1362-1369.
[21] Zainurin, S.N., Ismail, W.Z.W., Ismail, I., Jamaludin, J. (2025). Detection of chemical contaminants in water for irrigation systems: A systematic review. Journal of Advanced Research in Applied Sciences and Engineering Technology, 53(2): 181-198. https://doi.org/10.37934/araset.53.2.181198
[22] Tuozzolo, S., Langhorst, T., de Moraes Frasson, R.P., Pavelsky, T., Durand, M., Schobelock, J.J. (2019). The impact of reach averaging Manning’s equation for an in-situ dataset of water surface elevation, width, and slope. Journal of Hydrology, 578: 123866. https://doi.org/10.1016/j.jhydrol.2019
[23] Abed, B.S., Daham, M.H., Ismail, A.H. (2021). Water quality modelling and management of Diyala River and its impact on Tigris River. Journal of Engineering Science and Technology, 16(1): 122-135.
[24] Hashim, I., Azzubaidi, R.Z. (2023). The roughness coefficient in Euphrates River reach between Haditha Dam to Ramadi Barrage. Journal of Engineering, 29(3): 117-124. https://doi.org/10.31026/j.eng.2023
[25] Albakri, M., Hussien, D.S. (2017). Evaluating the quality of authoritative geospatial datasets. Journal of Engineering, 23(11). https://doi.org/10.31026/j.eng.2017
[26] Hodson, T.O. (2022). Root mean square error (RMSE) or mean absolute error (MAE): When to use them or not. Geoscientific Model Development Discussions: 1-10. https://doi.org/10.5194/gmd-15-5481