Marwah Jaafar Kashkool*![]() | Imad Habeeb Obead
| Imad Habeeb Obead![]()
© 2025 The authors. This article is published by IIETA and is licensed under the CC BY 4.0 license (http://creativecommons.org/licenses/by/4.0/).
OPEN ACCESS
The Kufa River, located in Al-Najaf Province, plays a vital role in the local community by supplying water primarily for irrigation and drinking purposes. This study aims to evaluate the water quality of the Euphrates River, specifically along a 42 km stretch through Al-Najaf, using a Water Quality Index (WQI), multivariate statistical methods, and geospatial techniques. Seventeen water quality parameters and five heavy metals were measured to calculate both the Arithmetic Water Quality Index (WQI) and the Integrated Water Quality Index (IWQI). The concentration of cations followed the order Na+ ˂ K+ ˂ Ca²+ ˂ Mg²+, while anions were ranked NO₃⁻ ˂ Cl⁻ ˂ HCO₃⁻ ˂ SO₄²⁻. The results revealed significant spatial variation in IWQI values, ranging from poor to unsuitable, with water quality deteriorating from upstream to downstream locations. IWQI scores indicated that water quality ranged from poor to unsuitable at all seven sampling sites, with average values of 215.98 and 295.35 based on Iraqi (IQ) and World Health Organization (WHO) standards, respectively, thereby confirming the extent of water quality deterioration. In addition, heavy metal contamination was evaluated using the Heavy Metal Pollution Index (HPI) and the Heavy Metal Evaluation Index (HEI). For irrigation purposes, parameters including Electrical Conductivity (EC), Sodium Adsorption Ratio (SAR), and Soluble Sodium Percentage (SSP) were assessed. While most samples were categorized as permissible, two sites were classified as good based on their lower salinity levels. Statistical analysis, including Principal Component Analysis (PCA), revealed that four major factors influence water quality: organic pollution, dissolved oxygen (DO), magnesium levels, and alkalinity. The proximity of sampling sites to wastewater treatment plants and agricultural zones contributed to elevated pollutant concentrations, whereas upstream areas were primarily affected by domestic sewage. The study emphasizes the severe water quality degradation in the Kufa River. This study provides valuable insights for pollution control and sustainable water resource management in the Kufa River. By identifying heavily polluted sites such as S3 and S5 and highlighting key contaminants like cadmium and phosphate, the study offers a clear understanding of priority areas for intervention. The use of IWQI and PCA helped show spatial pollution patterns, guiding directed improvements such as real-time monitoring, enhanced wastewater treatment, and better regulation of pollution sources. These findings aim to support informed decisions and long-term strategies for water quality protection in the region.
heavy metal pollution index (HPI), principal component analysis (PCA), the Kufa River, spatial distribution, water quality index (WQI)
The acceleration of global warming over recent decades has resulted in water shortages and a decline in water quality. Iraq is a hot desert country, which contributes to high evaporation rates and consequently degrades the Tigris and Euphrates rivers—the country’s primary water sources [1, 2]. Another major issue facing the Euphrates River is the influx of various impurities, primarily from waste discharged directly into the river. While agricultural drainage and industrial effluents contribute significantly to pollution, municipal wastewater treatment plant discharges represent a major source of contamination in the Euphrates River [3-5].
Abdulmuttaleb [6] conducted a study on the Euphrates River near Kufa to evaluate the concentrations of various water quality indicators and their effects on the river. According to the study, the concentration of certain pollutants increased due to the discharge of detergents, industrial wastewater, fertiliser-containing agricultural runoff, and household sewage from nearby communities. Alanbari et al. evaluated the drinking water quality of the Kufa River's raw water using a Geographical Information System (GIS) and WQI [7]. The study indicated that the Kufa River typically exhibits poor water quality, with upstream areas classified as poor and downstream areas as extremely poor, primarily due to domestic and agricultural pollution. Hussein et al. [8] evaluated the water quality of the Kufa River for irrigation purposes used in agricultural areas for many branches of the Euphrates River in Al-Najaf using GIS and WQI. Kareem et al. [9] evaluated the water quality of the Euphrates River near Kufa using three different indices, both including and excluding phosphate (PO₄³⁻), as it was the parameter most closely aligned with the standard limits. It is concluded that the water quality was inferior in two cases. Despite numerous studies on the Kufa River’s water quality, most lacked consideration of spatial distribution, heavy metal pollution indices, and the use of multivariate statistical methods. In addition, there is a lack of data on water quality that can be used for research purposes. Therefore, this study aims to fill this gap by evaluating the water quality index, heavy metal pollution index, and applying PCA to assess water quality in the Kufa River, Najaf, Iraq.
Pamei et al. [10] employed PCA to evaluate the geographical and temporal fluctuations in water quality in the Dimapur region of India. Wang et al. [11] assessed the water quality and pollution sources of Weishan and Luoma Lakes in Xuzhou, Jiangsu Province, China, using hydrochemical analysis, correlation analysis (CA), PCA, the WQI and Pollution Evaluation Index (PEI). Key findings reveal that parameters such as turbidity, TDS, TN, TH, and ALK exceed permissible limits, with pollution sources identified as industrial activities for Weishan Lake and agricultural runoff for Luoma Lake. Sahab et al. [12] evaluated the water quality of the Euphrates River in Ramadi City, Iraq, using heavy metal pollution indices. The Results show low pollution levels, with average concentrations of heavy metals below WHO limits, categorizing the water quality as low pollution. Sahoo and Sahu [13] assessed the degree of metal pollution in surface water surrounding the Talcher coalfields. The study used pollution indices, including the HPI and the Contamination Factor (CF), to measure the concentrations of harmful metals such as arsenic, lead, and mercury in the water. Furthermore, multivariate statistical techniques, such as PCA and Cluster Analysis (CA), are used to determine pollution sources and evaluate geographical trends. The research shows that coal mining operations substantially contribute to water pollution, endangering both human health and the ecosystem.
This research investigates contamination in the segment of the Euphrates River flowing through the city of Kufa, Iraq. Five heavy metals, namely, Pb, Zn, Cr, Fe, and Mn, were considered in water. In addition, seventeen physicochemical parameters were measured to calculate the WQI, including pH, EC, total dissolved solids (TDS), total hardness (TH), turbidity, Na⁺, K⁺, Ca²⁺, Mg²⁺, HCO₃⁻, Cl⁻, NO₃⁻, SO₄²⁻, PO₄³⁻, biochemical oxygen demand (BOD), DO, and chemical oxygen demand (COD). In March 2024, samples were taken at seven different points along the Euphrates River. The study analyzes water quality parameters using a comprehensive dataset and applies two water quality indices: the Arithmetic WQI and the IWQI. It includes correlation and PCA to identify key water quality parameters. The research focuses on the quality and suitability of surface waters for domestic, drinking, and industrial purposes based on the measured physicochemical values compared to the standards. Surface water quality and suitability for drinking, domestic, and industrial purposes were determined by comparing the obtained values of physicochemical parameters with the World Health Organisation (WHO) [14] standards and the Iraqi Standard (IQS, 2009).
This study aims to enhance pollution control through a comprehensive evaluation of water quality and identification of the primary sources of pollution in the Kufa River. It delineates specific parameters that exceed allowable limits and identifies the principal sources of pollution. It also recommends methods, including the implementation of quality water monitoring systems, the enhancement of wastewater treatment facilities, and the regulation of agricultural activities. These findings provide scientific guidance for politicians and environmental experts to formulate specific pollution control strategies and sustainable water management initiatives.
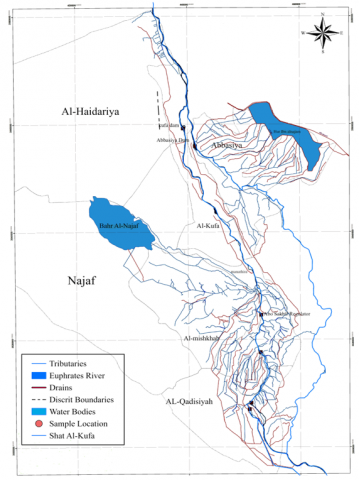
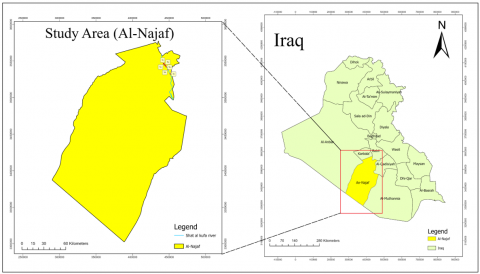
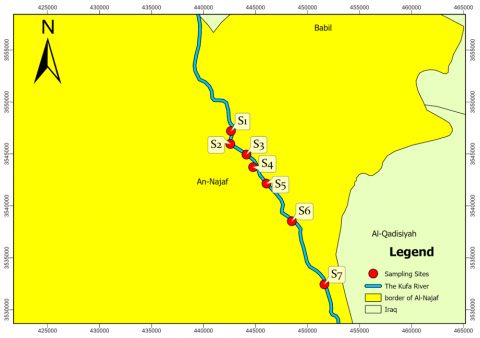
The study focuses on the Kufa River, a significant branch of the Euphrates River, located in Al-Najaf Governorate located in Iraq. This river is essential for drinking water, industrial uses, and irrigation for agricultural areas along its 42 km distance, which runs from the Kufa Barrage to the Abo Sakhir Regulator, as shown in Figure 1. One of the Middle East's longest rivers, the Euphrates, is vital for sustaining ecosystems and supporting the livelihoods of millions, particularly in Iraq. Before entering Al-Najaf, the Euphrates splits into the Kufa and Al-Abbasiya rivers. This study focused on the Kufa River (Figure 2) only because of the many pollutants that drain into the river, and it is the primary source of drinking and irrigation for large areas of agriculture.
Figure 2. The layout of the study reach
3.1 Water sampling and laboratory tests
Seven sites were selected along the reach of the study area (AL-Zarqa Water Intake, Northern Kufa Drain, Albo-Hedary Drain, Albo Shkhair, AL-Barakiya, Southern Kufa Drain, Al-Bakriya Drain), which are considered as point pollution sources and all these points empty their load directly in the Euphrates River as shown in Table 1.
Surface water samples were taken at the same discharge site, before and after each site, at a distance of 50 meters. The first site is the Al-Zarqa water intake (S1) of the Al-Najaf Province. The study's reach describes four drains, including Northern Kufa Drain (S2), Albo-Hedary Drain (S3), Southern Kufa Drain (S6), and Al-Bakriya Drain (S7). These drainages are combined with agricultural runoff and wastewater discharged into the water of the river, which causes a decrease in the aquatic ecosystem of the Kufa River. Albo Shkhair (S4) is combined of stormwater discharge and domestic wastewater, which is discharged directly into the river. The AL-Barakiya (S5) site is showing wastewater discharged into the river from the wastewater treatment plant, where not all the treated wastewater reached the plant due to the insufficient design capacity of the treatment plant. The geographic coordinates for each site have been determined by a GPS (Global Positioning System) device, as shown in Table 1. Figure 3 displays some surface water sampling sites in the study reach.
Table 1. Description of sampling points
|
Point Code |
Site |
Longitude |
Latitude |
|
S1b |
Before Water Intake AL-Zarqa. |
44°22'23.91"E |
32°5'13.61"N |
|
S1 |
Water Intake AL-Zarqa. |
44°22'28.13"E |
32°5'10.20"N |
|
S1a |
After Water Intake AL-Zarqa. |
44°22'31.70"E |
32°5'10.60"N |
|
S2b |
Before the Northern Kufa Drain |
44°23'34.79"E |
32°3'35.66"N |
|
S2 |
Northern Kufa Drain |
44°23'34.06"E |
32° 3'34.36"N |
|
S2a |
After the Northern Kufa Drain |
44°23'34.30"E |
32°3'30.50"N |
|
S3b |
Before Albo-Hedary Drain |
44°23'29.80"E |
32°2'56.20"N |
|
S3 |
Albo-Hedary Drain |
44°23'31.01"E |
32° 2'54.58"N |
|
S3a |
After Albo-Hedary Drain |
44°23'33.80"E |
32°2'52.70"N |
|
S4bb |
750 m Before Albo Shkhair |
44°24'50.40"E |
32°2'5.90"N |
|
S4b |
Before Albo Shkhair |
44°24'55.80"E |
32°1'44.30"N |
|
S4 |
Albo Shkhair |
44°24'56.25"E |
32° 1'42.29"N |
|
S4a |
After Albo Shkhair |
44°24'57.40"E |
32°1'40.30"N |
|
S5b |
Before AL-Barakiya |
44°25'40.50"E |
32°0'52.60"N |
|
S5 |
AL-Barakiya |
44°25'42.20"E |
32°0'50.30"N |
|
S5a |
After AL-Barakiya |
44°25'45.20"E |
32°0'48.30"N |
|
S6b |
Before the Southern Kufa Drain |
44°27'15.35"E |
31°58'55.90"N |
|
S6 |
Southern Kufa Drain |
44°27'16.90"E |
31°58'53.60"N |
|
S6a |
After the Southern Kufa Drain |
44°27'18.00"E |
31°58'53.50"N |
|
S7b |
Before Al-Bakriya Drain |
44°29'17.31"E |
31°55'38.99"N |
|
S7 |
Al-Bakriya Drain |
44°29'17.48"E |
31°55'36.99"N |
|
S7a |
After Al-Bakriya Drain |
44°29'18.50"E |
31°55'34.38"N |
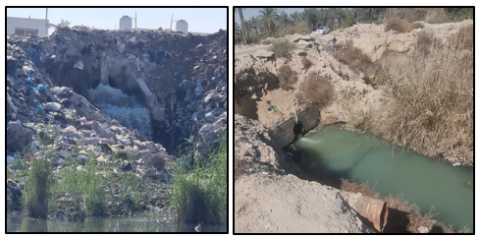
Figure 3. Albo-Hedary Drain and Albo Shkhair pipe
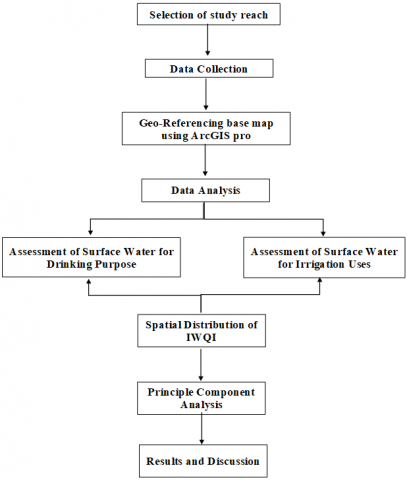
Surface water was sampled at a depth of 50m below the water surface. The surface water samples were collected from the Kufa River at the same position as the discharge of the point source of pollution (S1, S2, S3, S4, S5, S6, S7), before (Sb) and after (Sa) mixing the discharge of the drains about 75m. Twenty-two surface water samples were obtained once during the winter season in March 2024. The parameters tested in situ were surface water temperature, pH, and TDS. Surface water samples were collected in two cleaned and rinsed bottles with a capacity of 1.5 L after coding the site code. The bottles were saved in the icebox and transferred to the environmental laboratory for chemical analysis. Several physicochemical parameters were examined for each sample, including pH, electrical conductivity, TDS, TH, turbidity, and the significant cations sodium (Na+), potassium (K+), calcium (Ca2+) and magnesium (Mg2+); the major anions were bicarbonate (HCO₃⁻), chloride (Cl-), nitrate (NO₃⁻) and sulphate (SO₄²⁻); components included phosphate (PO₄³⁻); BOD, DO, and COD were determined, as well as heavy metals such as iron (Fe), zinc (Zn), lead (Pb) cadmium (Cd), and nickel (Ni). The analytical data were prepared for statistical evaluation using SPSS 27 and Excel 2017 software; the research methodology is illustrated in Figure 4. It was determined whether the water in the Kufa River was suitable with IQ and WHO standards.
Figure 4. Methodology of the present research
3.2 Spatial distribution of water quality
This study is significant in understanding the temporal and spatial fluctuations in surface water quality to see how human activity and tides affect the river's water quality. The spatial variability in surface water quality may be comprehensively understood through the use of a geographic information system [15].
A map with data on water quality and its distribution throughout the research region was created by integrating GIS. Version 3.0.2 of the ArcGIS Pro software was used to conduct the spatial analysis. Spatial distribution will be carried out using Inverse Distance Weighting (IDW).
3.3 Water quality assessment method
This research presents a comprehensive evaluation of the quality of water for both drinking and irrigation, utilizing three indices: HPI, HEI, and WQI [5], as shown in Table 2.
The arithmetic WQI serves as a composite measure expressing the effect of various parameters, while the IWQI integrates subjective and objective weights to evaluate drinking water suitability. The study also employs the HPI and HEI to assess heavy metal contamination levels. The findings categorize water quality into ranges from excellent to unsuitable for drinking, highlighting the critical need for effective water quality management.
Table 2. Surface water quality indices used in this research
|
Indices |
Formula |
Definition |
Evaluations Criteria |
References |
|
WQI |
$\begin{gathered}W Q I=\sum_{i=1}^n \frac{W_i \times Q_i}{W_i} \\ W_i=\frac{K}{S_i} \\ K=\frac{1}{\sum^1 / S_i} \\ Q_i=\left[\frac{\left(V_i-V_o\right)}{\left(S_i-V_o\right)}\right] \times 100\end{gathered}$ |
Wi: the ith parameter's relative weight; Qi: quality scale for each contributed parameter in WQI calculations; n: is the total parameters; K: proportionality constant; Vi: concentration of ith parameter; Vo: recommended ideal value of parameters; Si: standard concentrations in mg/l. |
If WQI < 25 is excellent WQI = (26- 50) is good WQI = (51- 75) is poor WQI = (76- 100): is very poor WQI > 100 is unsuitable for drinking purposes |
[16] |
|
IWQI |
$\begin{aligned} X & =\left[\begin{array}{ccc}x_{11} & \ldots & x_{1 n} \\ \vdots & \ddots & \vdots \\ x_{m 1} & \ldots & x_{m n}\end{array}\right] \\ y_{i j} & =\frac{x_{i j}-\left(x_{i j}\right)_{\min }}{\left(x_{i j}\right)_{\max }-\left(x_{i j}\right)_{\min }} \\ Y & =\left[\begin{array}{ccc}y_{11} & \ldots & y_{1 n} \\ \vdots & \ddots & \vdots \\ y_{m 1} & \ldots & y_{m n}\end{array}\right] \\ e_j & =\frac{1}{\ln m} \sum_{i=1}^m y_j \ln y_j \\ y_i & =\frac{y_{i j}+10^{-4}}{\sum_{i=1}^m\left(y_{i j}+10^{-4}\right)} \\ w_{j 1} & =\frac{1-e_j}{\sum_{i=1}^m\left(1-e_j\right)}\end{aligned}$ |
X: the original matrix; xij: is the jth concentration of the ith sample. The total number of surface water samples is denoted by m (m=1, 2, ⋯, m), and the number of physicochemical characteristics for each sample is denoted by n (n=1, 2, ⋯, n). yij is the normalized value. The information entropy "ej" and entropy weight "wj1"; sj denotes the amount of data for the jth variable. |
IWQI <50 is excellent IWQI = (50-100) is good IWQI = (100 - 200) is poor IWQI = (200 - 300) is very poor and IWQI > 300 is unsuitable for drinking water |
[17] |
|
$\begin{gathered}s_j=\delta_j \sum_{i=1}^m\left(1-r_{i j}\right) \\ w_{j 2}=\frac{s_j}{\sum_{i=1}^m s_j} \\ r_{i j}=\frac{\sum\left(x_{i j}-\overline{x_{\imath \jmath}}\right)\left(y_{i j}-\overline{y_{\imath \jmath}}\right)}{\sqrt{\sum\left(x_{i j}-\overline{x_{\imath \jmath}}\right)^2} \sum\left(y_{i j}-\overline{y_{\imath \jmath}}\right)^2}\end{gathered}$ |
δj denotes its standard deviation; m denotes the number of parameters; rij denotes the coefficient of correlation and wj2 are the weights of the jth parameters according to the Inter-criteria Correlation (CRITIC) method. |
|||
|
HPI |
$\begin{gathered}H P I=\frac{\sum_{i=1}^n W_i \times Q_i}{\sum_{i=1}^n W_i} \\ Q_i=\sum_{i=1}^n \frac{\left\{M_i(-) I_i\right\}}{\left(S_i-I_i\right)} \times 100\end{gathered}$ |
Wi and Qi: the unit weight and the sub-index of the heavy metal, respectively, and n is the total parameters used in this study. Mi: the heavy metal monitoring value of the ith parameter, Ii: the parameter’s ideal concentration, and Si: the standard concentration of the parameters. |
HPI < 19 is low pollution HPI = (19-38) is medium HPI > 38 is high |
[18, 19] |
|
HEI |
$H E I=\sum_{i=1}^n \frac{H_c}{H_{m a c}}$ |
Hc: the parameter's concentration. Hmac: the maximum concentration of the parameters and n represents the total parameters. |
HEI < 400 is low HEI = (400-800) is medium HEI > 800 is high contamination |
[20] |
|
EC |
---- |
Electrical conductivity. |
EC < 250 is Excellent EC = (250- 750) is Good EC = (750- 2250) is Permissible EC = (2250- 5000) is Doubtful EC > 5000 is Unsuitable |
[21] |
|
SAR |
$S A R=\frac{N a^{+}}{\sqrt{\frac{M g^{++}+C a^{++}}{2}}}$ |
Na, Ca, and Mg are concentrations of the parameters in meq. /l. |
SAR < 10 is Excellent SAR = (10-18) is Good SAR = (18-26) is Doubtful SAR > 26 is Unsuitable |
[21] |
|
SSP% |
$=\frac{\begin{array}{c}S S P \% \\ K^{+}+N a^{+}\end{array}}{\left(C a^{+2}+N a^{+}+M g^{+2}+K^{+}\right)}$ |
Na, K, Ca, and Mg are concentrations of the water parameters in meq. /l. |
SSP < 20 is Excellent SSP is (20-40) is Good SSP is (40- 60) is Permissible SSP = (60- 80) is Doubtful SSP > 80 is Unsuitable |
[21] |
3.4 PCA
Large datasets from environmental monitoring programs can be classified, modelled, and interpreted using multivariate statistical methods. This reduces the dimensionality of the data and extracts information that will be useful for managing surface waters and assessing the quality of the water [22].
In this study, using a dataset of about 484 variables, PCA is performed (22 parameters calculated at 22 sampling points throughout a winter period). A technique for reducing the dimensionality of variables is component analysis, which assumes that several unobservable factors hide the original variables [23]. PCA is performed on the IBM SPSS (Statistical Package for the Social Sciences) version 27. The steps of PCA include: (1) standardisation of the dataset to be certain that they all display the same weight in the analysis, (2) establishing the covariance matrix, (3) finding the eigenvalues and the eigenvectors, and (4) calculating the loadings of the principal components. Only components with an eigenvalue larger than one were preserved. Also, the calculation of Kaiser-Meyer-Olkin and Bartlett’s sphericity test is done to show the applicability of the dataset, where the KMO is greater than 0.5 and Bartlett’s sphericity test is less than 0.05. The correlation matrix of the initial data is examined first, and then dimensionality reduction is used to reduce the amount of initial data to a small number of composite factors. Usually, this makes the internal links visible and essential details that were previously concealed between the initial variables, particularly the linkage between the causes of pollution. Due to the large number of variables in the dataset, it is hard to comprehend all the relations between the variables. So, a reduction data technique called PCA was used to reduce the dimensionality of the dataset. PCA creates components or factors that allow the interpretation of a relatively large series of data.
4.1 General characteristics of surface water
The statistical study of chemical parameters for surface water facilitates an understanding of the variation of chemical components. Table 3 presents the mean, maximum, minimum, standard deviation (SD), and coefficient of variation (CV) for every parameter. Total dissolved solids (TDS) are significant in the assessment of water suitability; they range from 470 to 910 mg/L, and no samples are greater than 1000 mg/L for drinking consumption; this indicates that the low TDS did not affect the tasting of the water samples. As per the chemical property statistical study, the percentage of cations was as follows: Na+ ˂ K+ ˂ Ca2+˂ Mg2+. Sodium (Na+) and potassium (K+) concentrations ranged from 111 to 185.1 mg/L and 4.1-38.9 mg/L, respectively, with mean values of 127.16 mg/L and 6.95 mg/L. No samples exceeded the WHO guideline value of Na+ exceeding 200 mg/L. In contrast, only about 4.55% of the samples were high in terms of K+. Ca2+ and Mg2+ values varied from 4.01 to 38.9 mg/L and 31.93-114.18 mg/ L, with an average of 68.18 mg/L and 90.91 mg/L, respectively. The concentrations of the anion were arranged as NO₃⁻˂Cl-˂HCO₃⁻˂SO₄²⁻. The concentration of HCO₃⁻ ranged from 224 to 304 mg/L with a mean value of 257.45 mg/L. The results indicated that because of the high concentrations of HCO₃⁻ (>200 mg/L), 50% of the water samples were unfit for direct consumption. Cl- and NO₃⁻ observed concentrations varied from 135 to 229.93 mg/L and 1.25 to 3.35 mg/L, respectively, with mean values of 166.8 mg/L and 2.18 mg/L. There are no samples that exceed the WHO guideline value of Cl- and NO₃⁻. Results of SO₄²⁻ concentration range from 254 to 1252.5 mg/L, and the mean value of 1020.1 mg/L, exceeding 100% of samples and exceeding the WHO guideline of 250 mg/L. From Table 3, it was evident that zinc and iron show a constant lower concentration, with the mean value of 0.001 mg/L in the surface water in the reach. On the other hand, cadmium displays a high concentration (0.015 to 0.164 mg/L) with a mean value of 0.164 mg/L. Based on the results of the samples that were studied, heavy metals Zn, Pb, Ni, and Fe did not exceed the desired limits reported by Iraqi standards and the World Health Organisation, except for cadmium Cd. Based on the mean concentration of heavy metals in surface water samples, it is found that Zn, Pb, Ni, and Fe are equal in value and less than Cd in all water samples.
Table 3. Statistical description of the parameters of the specimen of river water
|
Statistic Parameter |
Mean |
Max. |
Min. |
Median |
SD* |
CV** |
IQS |
WHO |
Exceeded Rate (%) |
|
PH |
7.31 |
7.90 |
6.50 |
7.40 |
0.41 |
5.66 |
8 |
8 |
36.36 |
|
TDS |
544.09 |
910 |
470 |
525 |
94.30 |
17.33 |
1000 |
1000 |
0.00 |
|
EC |
1045.9 |
1750 |
630 |
1040 |
221.95 |
21.22 |
2000 |
1000 |
59.09 |
|
Tur |
75.83 |
104.00 |
19 |
82.09 |
22.28 |
29.38 |
5 |
5 |
100 |
|
TH |
470.91 |
690 |
400 |
465 |
60.62 |
12.87 |
500 |
500 |
22.73 |
|
Ca+2 |
112.77 |
308.62 |
40.1 |
84.17 |
77.90 |
69.08 |
50 |
75 |
68.18 |
|
Mg+2 |
87.02 |
114.18 |
31.93 |
90.60 |
21.67 |
24.90 |
50 |
30 |
90.91 |
|
Na+ |
127.16 |
185.10 |
111 |
122.30 |
16.53 |
13.00 |
200 |
200 |
0 |
|
K+ |
6.95 |
38.90 |
4.1 |
5.35 |
7.23 |
104.07 |
12 |
12 |
4.55 |
|
HCO₃⁻ |
257.45 |
304 |
224 |
252 |
24.67 |
9.58 |
250 |
200 |
50 |
|
Cl- |
166.8 |
229.93 |
135 |
164.95 |
23.31 |
13.98 |
250 |
250 |
0 |
|
NO₃⁻ |
2.18 |
3.35 |
1.25 |
2.17 |
0.65 |
29.67 |
50 |
50 |
0 |
|
PO₄³⁻ |
1.93 |
9.87 |
0.001 |
0.49 |
2.80 |
144.82 |
0.40 |
0.10 |
90.91 |
|
SO₄²⁻ |
1020.1 |
1252.5 |
254 |
1038.8 |
193.18 |
18.94 |
250 |
250 |
100 |
|
COD |
72.22 |
192 |
3.20 |
37.60 |
64.81 |
89.74 |
5 |
5 |
95.45 |
|
DO |
4.85 |
7.00 |
3.60 |
4.70 |
0.89 |
18.30 |
5 |
5 |
36.36 |
|
BOD |
3.33 |
6.00 |
0.40 |
3.40 |
1.25 |
37.63 |
5 |
4 |
22.73 |
|
Zn |
0.001 |
0.001 |
0.001 |
0.001 |
6.65E-19 |
6.65E-14 |
3 |
3 |
0 |
|
Pb |
0.001 |
0.005 |
0.001 |
0.001 |
0.00086 |
70.77 |
0.010 |
0.010 |
0 |
|
Ni |
0.001 |
0.002 |
0.001 |
0.001 |
0.00019 |
18.55 |
0.020 |
0.020 |
0 |
|
Fe |
0.001 |
0.001 |
0.001 |
0.001 |
6.65E-19 |
6.65E-14 |
0.300 |
0.300 |
0 |
|
Cd |
0.164 |
0.603 |
0.015 |
0.103 |
0.152 |
93.21 |
0.003 |
0.003 |
100 |
Table 4. Statistical summary of surface water indices in the study reach
|
Statistics |
IQ’s |
WHO’s |
||||
|
WQI |
HPI |
HEI |
WQI |
HPI |
HEI |
|
|
Mean |
303.39 |
18.560 |
32.93 |
234.16 |
39.82 |
54.72 |
|
Max |
1140.09 |
68.23 |
120.74 |
780.53 |
148.52 |
201.10 |
|
Min |
64.30 |
1.698 |
3.09 |
67.30 |
3.64 |
5.02 |
|
Median |
205.26 |
11.68 |
20.74 |
186.97 |
25.38 |
34.43 |
|
Standard Deviation |
289.38 |
17.25 |
30.50 |
189.02 |
37.94 |
50.85 |
|
Sample Variance |
83739.57 |
297.72 |
968.93 |
35729.98 |
1439.48 |
2693.51 |
The Kufa River flows through urban areas and agricultural land, thus water pollution levels in the river showed that water quality was the worst due to the poor wastewater treatment and discharge of agricultural effluent directly into the river. The highest level of Turbidity, K, Ca, Mg, HCO3, SO4, and PO4 indicate the effects of both natural and anthropogenic sources. On the other hand, a high level of BOD and a lower value of DO indicate that pollution from industrial and agricultural runoff becomes more apparent. The winter season exhibits elevated pollution levels, marked by an increased concentration of most parameters. Wastewater treatment plant S3 and the agricultural drains S7 substantially influence water quality, highlighting the necessity for enhanced treatment efficacy.
4.2 Statistical analysis for drinking water
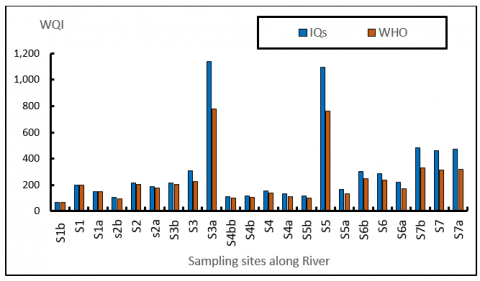
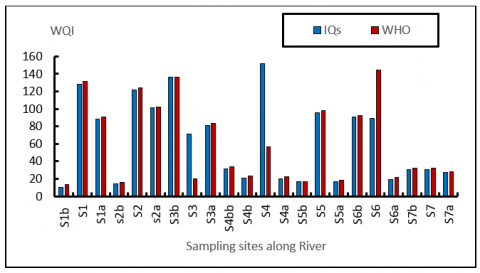
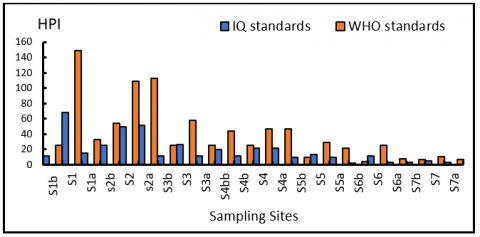
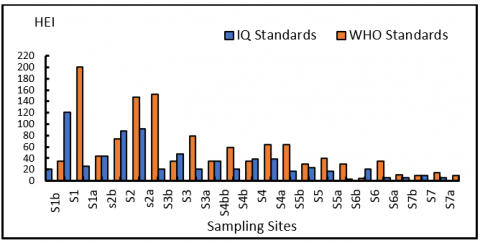
First, the WQI is calculated using the water quality parameters that are most often tested; the weighted arithmetic water quality index method classifies the water quality according to the level of purity. All parameters had their ideal values adjusted to zero, except pH equal to seven and DO equal to fourteen [16]. Figure 5 and Figure 6 show the variations of WQI with and without turbidity and phosphate, respectively, while Figure 7 and Figure 8 demonstrate the differences of HPI and HEI for each water sample in the study reach for the winter season, respectively.
Figure 5. Variation of WQI for surface water in the study reach
Figure 6. Variation of WQI for surface water in the study reach without turbidity and phosphate
Figure 7. Variation of HPI for surface water in study reach
Figure 8. Variation of HEI for surface water in the study reach
From the results of Figure 5 and Figure 6, it was obvious that the WQI values when the concentration of phosphate and turbidity were included were higher than what was permitted by water standards for drinking according to IQ and WHO standards. In contrast, the WQI values, without being included, were within the desirable values for IQ and WHO standards. On the other hand, the results show that the WQI for every sample had a higher concentration than the IQ standards and the WHO standards.
The HPI calculates the degree of pollution brought by the presence of heavy metals, in addition to the overall effect of all heavy metals on the general quality of drinking water [22]. As drinking water shouldn't include certain metals or ions, zero is the optimal number. Figure 7 and Figure 8 present the same trends in variation as Figure 6. However, the HPI and HEI values for each sample are significantly lower under IQ standards than for the WHO guidelines.
Table 4 also provides the descriptive statistics for these indices. The average total HPI based on IQ and WHO is about 18.56 and 39.82, respectively. Regarding the overall score, only 54.17% of the total samples indicate good quality drinking water, while the remaining 45.83% show poor or very bad quality water unsuitable for consumption. The mean overall scores of HEI are 32.93 and 54.72, respectively, indicating that the pollution level in general is low across the samples. Based on the HEI values, all samples (100%) fall into the category of safe for human consumption, as indicated in Table 4.
4.3 Statistical analysis for irrigation classification
According to the results of Table 3, the statistical description of the parameters of the specimen of river water is used. The highest mean concentration was recorded for Na, with a range of Variance of 127.16 mg/L. The lowest mean concentration in the study area was recorded for K, with a variance of 6.95 mg/L. The average concentration of the chemical parameters in order is as follows: Na > Ca > Mg > K. As revealed in Table 3 and Table 5, the total salinity content differs from the maximum of 2250 µS/cm for site S5 to the minimum of 750 µS/cm for site S4bb. Most of the samples are under the 'permissible' category for irrigation (750 to 2250 µS/cm), though two sites (S1a and S4bb) fall under the 'Good' category (250 to 750 µS/cm) for irrigation. The average general EC value of 1045.91 µS/cm is also graded as 'permissible.'
The SAR results provided the classification of "excellent" for all surface water, ranging from a minimum of 1.76 in S3 to a high of 2.195 in S3a. The total mean value was 2.21, which is much less than the value of 10 for the limited classification. According to the SSP% results, the entire mean value was found to be 31.21, which is categorised as "good" for irrigation needs.
Table 5. Statistical summary of surface water indices in the study reach
|
Statistic |
EC (µs/cm) |
SAR |
SSP% |
|
Mean |
1045.91 |
2.21 |
31.21 |
|
Max |
1750.00 |
2.54 |
36.87 |
|
Min |
630.00 |
1.76 |
24.24 |
|
Median |
1040.00 |
2.195 |
31.79 |
|
Standard deviation |
221.95 |
0.22 |
3.45 |
4.4 Integrated water quality index
Table 6 presents the parameter weights of surface water samples for the IWQI method. K+ has the highest objective weight (0.20059), thus it gives the most effective information. Then comes PO4-3 with 0.13861. While SO4-2, turbidity, and BOD are the lowest in contributing information. It is obvious that there is a significant disparity between objective and subjective weight. For example, pH was considered most significant in CRITIC but has a low objective weight. The sum of the two weights, CRITIC and entropy, was combined using the joint weight method for more precise evaluations.
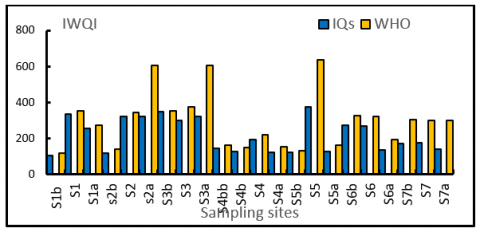
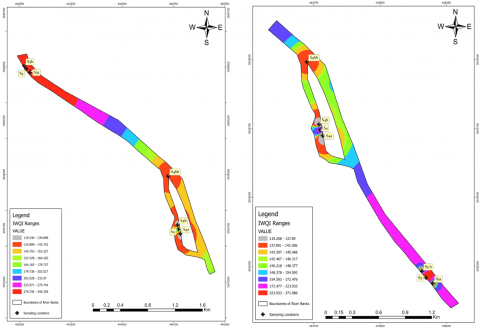
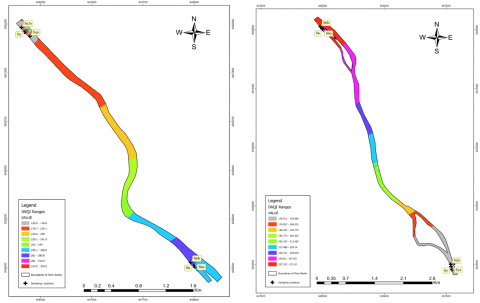
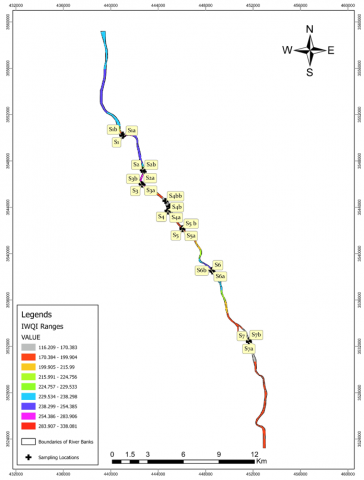
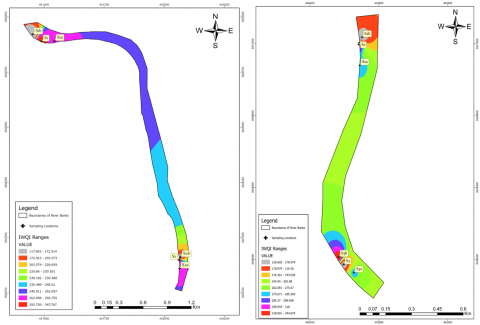
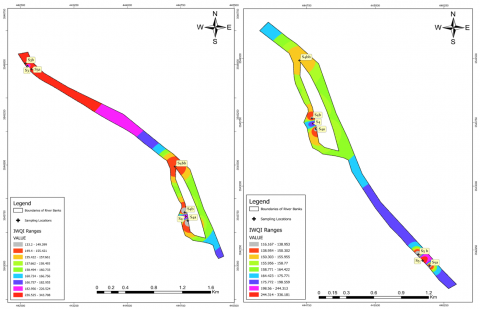
As shown in Table 7 and Figure 9, almost all seven of the sampling locations along the Kufa River had water samples of low, very poor, or unsuitable quality, according to the IWQI values. Based on the WHO and IQ standards, the average IWQI value for the water quality is 295.35 and 215.98, respectively, indicating the most degraded state. Albo-Hedary Drain site (S3) and AL-Barakiya site (S5) are found to be the most contaminated of the seven sample locations, which are sewage water discharged directly into the river.
Table 6. Various methods of determining index weights
|
Parameters |
Entropy Weight |
CRITIC Weight |
Integrated Weight |
|
PH |
0.02598 |
0.11479 |
0.10893 |
|
TDS |
0.08924 |
0.01826 |
0.02294 |
|
EC |
0.02414 |
0.04322 |
0.04196 |
|
Tur |
0.01984 |
0.09529 |
0.09031 |
|
TH |
0.05047 |
0.02765 |
0.02915 |
|
Ca2+ |
0.08077 |
0.04757 |
0.04976 |
|
Mg2+ |
0.01938 |
0.1039 |
0.09833 |
|
Na+ |
0.07183 |
0.02436 |
0.0275 |
|
K+ |
0.20059 |
0.00938 |
0.02199 |
|
HCO3 |
0.04607 |
0.0746 |
0.07272 |
|
Cl- |
0.04079 |
0.03829 |
0.03845 |
|
NO₃⁻ |
0.04861 |
0.06201 |
0.06112 |
|
PO₄³⁻ |
0.13861 |
0.02897 |
0.0362 |
|
SO₄²⁻ |
0.00873 |
0.09895 |
0.093 |
|
COD |
0.07558 |
0.06053 |
0.06153 |
|
DO |
0.04181 |
0.07232 |
0.07031 |
|
BOD |
0.01757 |
0.07991 |
0.07579 |
Table 7. Value of IWQI and the types of water
|
Sampling Site |
IWQI, according to IQs |
Type of Surface Water |
IWQI, according to WHO |
Type of Surface Water |
|
S1b |
102.33 |
Poor |
117.80 |
Poor |
|
S1 |
331.89 |
Not Suitable for Drinking |
352.12 |
Not Suitable for Drinking |
|
S1a |
253.05 |
Very poor |
271.31 |
Very poor |
|
S2b |
114.14 |
Poor |
137.47 |
Poor |
|
S2 |
318.16 |
Not Suitable for Drinking |
342.29 |
Not Suitable for Drinking |
|
S2a |
321.41 |
Not Suitable for Drinking |
603.62 |
Not Suitable for Drinking |
|
S3b |
345.69 |
Not Suitable for Drinking |
352.11 |
Not Suitable for Drinking |
|
S3 |
296.73 |
Very poor |
374.77 |
Not Suitable for Drinking |
|
S3a |
321.41 |
Not Suitable for Drinking |
603.62 |
Not Suitable for Drinking |
|
S4bb |
140.81 |
Poor |
160.46 |
Poor |
|
S4b |
123.41 |
Poor |
147.54 |
Poor |
|
S4 |
189.40 |
Poor |
219.92 |
Very poor |
|
S4a |
119.05 |
Poor |
150.34 |
Poor |
|
S5b |
119.55 |
Poor |
130.39 |
Poor |
|
S5 |
374.32 |
Not Suitable for Drinking |
635.54 |
Not Suitable for Drinking |
|
S5a |
125.53 |
Poor |
162.00 |
Poor |
|
S6b |
271.94 |
Very poor |
325.37 |
Not Suitable for Drinking |
|
S6 |
268.71 |
Very poor |
319.32 |
Not Suitable for Drinking |
|
S6a |
133.58 |
Very poor |
190.07 |
Not Suitable for Drinking |
|
S7b |
170.51 |
Poor |
303.02 |
Not Suitable for Drinking |
|
S7 |
172.06 |
Poor |
299.06 |
Very poor |
|
S7a |
137.95 |
Poor |
299.47 |
Very poor |
Figure 9. IWQI with sample location for the study reach
It is obvious from Table 8 that the classification of water samples by the IWQI was that half of the numbers of samples as poor, 22.73% as very poor, 27.27% as not suitable for drinking according to Iraqi standards, and 31.8% as poor, 18.18% very poor, and 50% as not suitable for drinking according to WHO standards, respectively, with none being close to excellent or good. Similarly, heavy metals were within permissible limits.
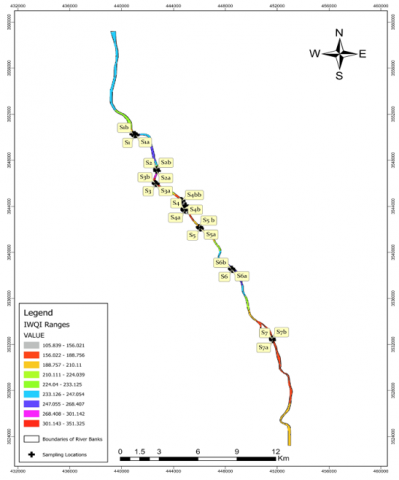
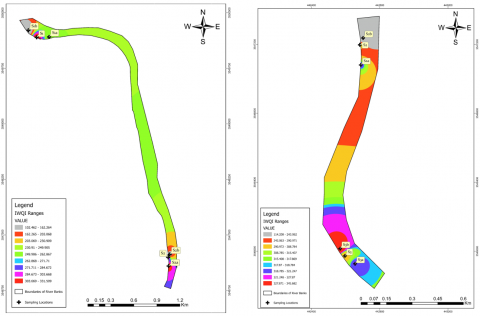
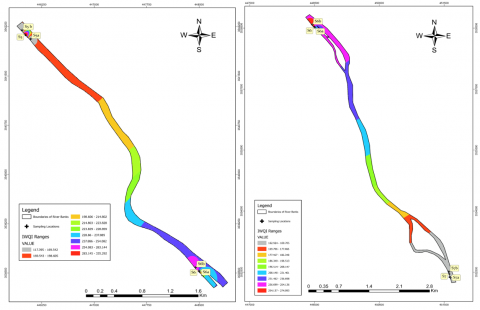
Figure 10 and Figure 11 represent spatial variations in the quality of surface water in the Kufa River according to IQ standards and WHO standards, respectively.
Table 8. IWQI ranges, water type, number, and percentage of samples in the study reach
|
IWQI Ranges |
Types of Surface Water |
According to IQ Standards |
According to WHO Standards |
||
|
Number of Samples |
% of Samples |
Number of Samples |
% of Samples |
||
|
˂50 |
Excellent |
0 |
0 |
0 |
0 |
|
50-100 |
Good |
0 |
0 |
0 |
0 |
|
100-200 |
Poor |
11 |
50 |
7 |
31.82 |
|
200-300 |
Very Poor |
5 |
22.73 |
4 |
18.18 |
|
> 300 |
Not suitable for drinking water |
6 |
27.27 |
11 |
50 |
Figure 10. Spatial distribution of the quality of the Kufa River surface water according to IQ standards
Figure 11. Spatial distribution of the quality of surface water of the Kufa River according to WHO standards
4.5 Results of principal component analysis
Principal component analysis with maximum variance rotation extracted the four common factors. A common factor reveals the original variables of the Kufa River.
Table 9 and Table 10 provide factor loading matrices and main control parameters. Results of Table 9 and Table 10 reported that the first component (F1) presented 36.599% of the Variance and was associated with organic pollution (TDS, K+, Na+, T.H, and EC). The second one (F2) resulted in 19.38% and was associated with organic pollution of BOD and DO. The third factor (F3) accounted for 14.088% and was related to magnesium pollution. The fourth factor (F4) presented 7.003% and was related to pH, expressing alkaline water and low DO.
Table 9. Rotated factor loading matrix
|
Parameters |
Components |
|||
|
1 |
2 |
3 |
4 |
|
|
TDS |
0.966 |
0.061 |
-.002 |
-.059 |
|
K |
0.939 |
-0.117 |
-.110 |
-.103 |
|
Na |
0.937 |
-.039 |
-.076 |
.044 |
|
TH |
0.876 |
.090 |
-.044 |
-.278 |
|
EC |
0.875 |
-.044 |
.003 |
.182 |
|
Cl |
0.743 |
.345 |
-.117 |
-.086 |
|
PO4 |
0.538 |
-.372 |
.259 |
.036 |
|
BOD |
0.087 |
.932 |
.045 |
-.056 |
|
DO |
-0.363 |
.815 |
.291 |
.070 |
|
SO4 |
0.392 |
.736 |
-.202 |
.185 |
|
Tur |
0.317 |
.584 |
-.573 |
-.043 |
|
Ca |
0.254 |
-.300 |
-.871 |
.158 |
|
Mg |
0.374 |
.324 |
.731 |
-.329 |
|
HCO3 |
0.260 |
-.387 |
.638 |
.087 |
|
COD |
0.123 |
.121 |
-.473 |
-.106 |
|
PH |
-.165 |
.088 |
-.159 |
.752 |
|
NO3 |
.563 |
.116 |
.345 |
.581 |
Table 10. Extracted common factors
|
Component |
Eigenvalues |
% of Variance |
Cumulative Percentage of Variances |
Main Control Parameter |
|
F1 |
6.222 |
36.599 |
36.599 |
TDS, K+, Na+, T.H and EC |
|
F2 |
3.295 |
19.380 |
55.979 |
BOD and DO |
|
F3 |
2.395 |
14.088 |
70.067 |
Ca, HCO₃⁻ and Mg2+ |
|
F4 |
1.190 |
7.003 |
77.070 |
PH and Cl |
Table 11. Matrix of rotated factor scores for sample points
|
Sampling Site |
F1 |
F2 |
F3 |
F4 |
|
S1b |
-0.7638 |
1.67061 |
0.64423 |
-0.44077 |
|
S1 |
0.11008 |
1.8258 |
0.29962 |
0.5437 |
|
S1a |
-0.5196 |
0.98646 |
-0.25648 |
-2.32918 |
|
S2b |
-0.405 |
0.02544 |
0.15173 |
-0.1258 |
|
S2 |
0.00779 |
0.58272 |
-0.74853 |
-1.90962 |
|
S2a |
-0.531 |
-0.35272 |
-1.79064 |
0.50584 |
|
S3b |
-0.8414 |
-0.55631 |
-2.11266 |
1.01138 |
|
S3 |
1.24385 |
0.45318 |
0.55109 |
1.68014 |
|
S3a |
-0.2625 |
0.02582 |
0.20445 |
0.46071 |
|
S4bb |
-0.4619 |
-0.12222 |
-0.06065 |
-0.34125 |
|
S4b |
-0.3393 |
0.35088 |
-0.03192 |
0.52576 |
|
S4 |
0.09818 |
0.77998 |
0.16494 |
-0.68141 |
|
S4a |
-0.34 |
0.89873 |
0.27682 |
0.07592 |
|
S5b |
-0.4153 |
-0.84159 |
-1.72908 |
0.00007 |
|
S5 |
3.93885 |
-0.38227 |
-0.50079 |
-0.80357 |
|
S5a |
0.0624 |
-0.18016 |
-0.07812 |
1.11059 |
|
S6b |
0.01197 |
0.13832 |
-0.19309 |
0.97199 |
|
S6 |
0.37776 |
0.03272 |
-0.15813 |
0.60967 |
|
S6a |
0.40853 |
-0.42238 |
0.45717 |
-1.16754 |
|
S7b |
-0.381 |
-0.87696 |
1.88136 |
-0.14447 |
|
S7 |
-0.1344 |
-1.19075 |
1.71251 |
1.10873 |
|
S7a |
-0.8643 |
-2.84529 |
1.31614 |
-0.66089 |
The sampling points S3 and S5, which contributed significantly to Factor 1 variance (Table 11), exhibited elevated levels of TDS, K+, Na+, TH, and EC. These points are situated near the Kufa River, possibly returning the influence of wastewater treatment plants along the Euphrates River. Factor 2 was mainly influenced by S1b and S1, described by high concentrations of BOD and DO. Located on the upstream side of the Kufa River, these sites suggest the existence of crude domestic sewage due to urbanization. Sampling sites S7b, S7, and S7a, near Al-Bakriya Drain, recorded high on Factor 3. Elevated magnesium (Mg2+) levels at these locations may be attributed to agricultural runoff containing pesticides and fertilizers. Factor 4 was related to S3 and S5a, mostly showing high pH and Cl values. Similar to COD, these raised pH levels are probably a consequence of insufficient sewage treatment.
From the results of this study, the following conclusion points can be obtained:
1. The winter season exhibits elevated pollution levels, marked by an increased concentration of most parameters. Wastewater treatment plant S3 and the agricultural drains S7 substantially influence water quality, highlighting the necessity for enhanced treatment efficacy.
2. High Sodium concentration: The highest mean concentration of sodium (Na) raises the potential for salinization risk. A high concentration of sodium indicates poor quality with low potential for crop yield and is linked to water-quality problems. It is exceeding threshold limits for irrigation suitability because high sodium contents adversely affect plant growth and development.
3. Most of the samples are generally in the 'permissible' category; however, at two sites, S1a and S4bb, they are listed as 'good,' representing generally lower salinity. All the same, this could also mean that there are possible sources of pollution or contamination that may affect water quality.
4. The risk potential of K+ pollution is the maximum among the considered parameters, followed by PO4-3, whereas SO4-2, turbidity, and BOD have the lowest risk potentials. This deduction is based on the objective weights of these parameters, which were determined using the IWQI method.
5. Almost all seven of the sampling locations along the Kufa River had water samples of low, very poor, or unsuitable quality, according to the IWQI values. Based on the WHO and IQ standards, the average WQI value for the water quality is 295.35 and 215.98, respectively, indicating the most degraded state. Albo-Hedary Drain site (S3) and AL-Barakiya site (S5) are found to be the most contaminated of the seven sample locations. There are four different factors clarifying water quality in the Kufa River based on Factor analysis: organic pollution, dissolved oxygen, magnesium levels, and alkalinity.
6. Sampling points and spatial distribution near wastewater treatment plants and agricultural areas revealed high levels of pollutants, whereas those in upstream areas showed evidence of domestic sewage.
7. This study also recommends implementable methods, including the establishment of real-time water quality monitoring systems, the enhancement of wastewater treatment facilities, and the regulation of agricultural activities. Furthermore, multi-season monitoring, combined with biological indicators and the establishment of water quality prediction models, which help in controlling the pollution source in the river, should be considered as a future research direction.
8. This research contributes to pollution control efforts and water resource management in the Kufa River reach. It shows the most affected sites (S3 and S5) and the pollutants posing the extreme risks, particularly cadmium and phosphate. The spatial analysis using IWQI and PCA provides a clear framework for understanding where and why pollution occurs. These results serve as a practical guide for improving wastewater treatment performance, applying real-time water quality monitoring, and focusing regulatory efforts where they are most needed. The study supports proactive, site-specific strategies that can enhance water sustainability and protection public and environmental health.
[1] Al-Maliki, L.A., Al-Mamoori, S.K., Al-Ansari, N., El-Tawel, K., Comair, F.G. (2022). Climate change impact on water resources of Iraq (a review of literature). In IOP Conference Series: Earth and Environmental Science, 1120(1): 012025. https://doi.org/10.1088/1755-1315/1120/1/012025
[2] Uhl, A., Hahn, H. J., Jäger, A., Luftensteiner, T., Siemensmeyer, T., Döll, P., Noack, M., Schwenk, K., Berkhoff, S., Weiler, M., Karwautz, C., Griebler, C. (2022). Making waves: Pulling the plug—Climate change effects will turn gaining into losing streams with detrimental effects on groundwater quality. Water Research, 220: 118649. https://doi.org/10.1016/J.WATRES.2022.118649
[3] Awadh, S.M., Ahmed, R.M. (2013). Hydrochemistry and pollution probability of selected sites along the Euphrates River, Western Iraq. Arabian Journal of geosciences, 6: 2501-2518. https://doi.org/10.1007/s12517-012-0538-1
[4] Ewaid, S.H., Abed, S.A. (2017). Water quality index for Al-Gharraf river, southern Iraq. Egyptian Journal of Aquatic Research, 43(2): 117-122. https://doi.org/10.1016/J.EJAR.2017.03.001
[5] Al-Hussaini, S.N.H., Al-Obaidy, A.H.M.J., Al-Mashhady, A.A.M. (2018). Environmental assessment of heavy metal pollution of Diyala River within Baghdad City. Applied Water Science, 8(3): 87. https://doi.org/10.1007/S13201-018-0707-9/FIGURES/3
[6] Abdulmuttaleb, H. (2012). Evaluation of surface water quality in Al-Kufa River station. Al-Qadisiya Journal for Engineering Sciences, 5(4): 451-465. https://www.researchgate.net/publication/322962880_EVALUATION_OF_SURFACE_WATER_QUALITY_IN_AL_KUFA_RIVER_STATION.
[7] Alanbari, M.A., Alqizweeni, S.S., Abdalwahed, R.A. (2017). Assessing of water quality of Al-Kufa river for drinking water using WQI and GIS. International Journal of Current Engineering and Technology, 7(4): 1566-1571. https://inpressco.com/category/ijcet/.
[8] Hussein, A.K., Kadhim, N.A., Jaber, A.S., Abojassim, A.A. (2020). Water quality index for surface water assessment by using GIS techniques, Alnajaf, Kufa, Iraq. IOP Conference Series: Materials Science and Engineering, 928(7): 072023. https://doi.org/10.1088/1757-899X/928/7/072023
[9] Kareem, S.L., Jaber, W.S., Al-Maliki, L.A., Al-husseiny, R.A., Al-Mamoori, S.K., Alansari, N. (2021). Water quality assessment and phosphorus effect using water quality indices: Euphrates River-Iraq as a case study. Groundwater for Sustainable Development, 14: 100630. https://doi.org/10.1016/j.gsd.2021.100630
[10] Pamei, M., Hemso, B.E., Puzari, A. (2022). Evaluation of the Physico-Chemical and the sustainability of ground and surface water quality using statistical correlation method and Water Quality Index in Dimapur District, Nagaland. Environmental Nanotechnology, Monitoring & Management, 18: 100699. https://doi.org/10.1016/J.ENMM.2022.100699
[11] Wang, J., Zhou, W., Zhao, M., Guo, X. (2023). Water quality assessment and pollution evaluation of surface water sources: The case of Weishan and Luoma Lakes, Xuzhou, Jiangsu Province, China. Environmental Technology & Innovation, 32: 103397. https://doi.org/10.1016/j.eti.2023.103397
[12] Sahab, M.F., Alani, A.R., Marzoog, A., Fahad, M.M., Fayyadh, A.H. (2025). Utilization of heavy metal pollution indices to appraise surface water quality according to WHO standards. An-Najah University Journal for Research-A (Natural Sciences), 39(2). https://doi.org/10.35552/anujr.a.39.2.2351
[13] Sahoo, B.P., Sahu, H.B. (2022). Assessment of metal pollution in surface water using pollution indices and multivariate statistics: A case study of Talcher coalfield area, India. Applied Water Science, 12(9): 223. https://doi.org/10.1007/s13201-022-01743-y
[14] World Health Organization. (2002). Guidelines for drinking-water quality. World Health Organization. https://doi.org/10.5005/jp/books/11431_8
[15] Seyedmohammadi, J., Esmaeelnejad, L., Shabanpour, M. (2016). Spatial variation modelling of groundwater electrical conductivity using geostatistics and GIS. Modeling Earth Systems and Environment, 2: 1-10. https://doi.org/10.1007/s40808-016-0226-3
[16] Brown, R.M., McClelland, N.I., Deininger, R.A., O’Connor, M.F. (1972). A water quality index—Crashing the psychological barrier. In Indicators of Environmental Quality: Proceedings of a symposium held during the AAAS meeting in Philadelphia, Pennsylvania, pp. 173-182.
[17] Zhang, Q., Qian, H., Xu, P., Hou, K., Yang, F. (2021). Groundwater quality assessment using a new integrated-weight water quality index (IWQI) and driver analysis in the Jiaokou Irrigation District, China. Ecotoxicology and Environmental Safety, 212: 111992. https://doi.org/10.1016/j.ecoenv.2021.111992
[18] Prasad, B., Bose, J. (2001). Evaluation of the heavy metal pollution index for surface and spring water near a limestone mining area of the lower Himalayas. Environmental Geology, 41(1): 183-188. https://doi.org/10.1007/s002540100380
[19] Mohan, S.V., Nithila, P., Reddy, S.J. (1996). Estimation of heavy metals in drinking water and development of heavy metal pollution index. Journal of Environmental Science & Health Part A, 31(2): 283-289. https://doi.org/10.1080/10934529609376357
[20] Edet, A.E., Offiong, O.E. (2002). Evaluation of water quality pollution indices for heavy metal contamination monitoring. A study case from Akpabuyo-Odukpani area, Lower Cross River Basin (Southeastern Nigeria). GeoJournal, 57: 295-304. https://doi.org/10.1023/B:GEJO.0000007250.92458.de
[21] Wilcox, L. (1955). Classification and use of irrigation waters (No. 969). US Department of Agriculture.
[22] Simeonov, V., Stratis, J.A., Samara, C., Zachariadis, G., Voutsa, D., Anthemidis, A., Sofoniou, M., Kouimtzis, T. (2003). Assessment of the surface water quality in Northern Greece. Water research, 37(17): 4119-4124. https://doi.org/10.1016/S0043-1354(03)00398-1
[23] Lin, T., Yu, H., Wang, Q., Hu, L., Yin, J. (2021). Surface water quality assessment based on the Integrated Water Quality Index in the Maozhou River basin, Guangdong, China. Environmental Earth Sciences, 80(10): 368. https://doi.org/10.1007/s12665-021-09670-y