Agung Wahyu Nugroho![]() | Widiyatno*
| Widiyatno*![]() | Sutomo
| Sutomo![]() | Hatma Suryatmojo
| Hatma Suryatmojo![]() | Eko Pujiono
| Eko Pujiono![]() | Rusiani | Ekowati Murwaningsih
| Rusiani | Ekowati Murwaningsih
© 2025 The authors. This article is published by IIETA and is licensed under the CC BY 4.0 license (http://creativecommons.org/licenses/by/4.0/).
OPEN ACCESS
This study aimed to identify the species composition and diversity of tree habitus in Mount Merbabu. A purposive, systematic sample using a survey technique based on elevation gradient, i.e., A (1,500-2,000 m asl), B (2,000-2,500 m asl), and C (>2,500 m asl), was employed in this study. Fifty-nine sample plots, each measuring 20 m × 20 m, were established along five hiking tracks. The results showed that the tree species composition at elevation gradients A, B, and C comprised 15 species in 14 families, 20 species in 18 families, and 6 species in 5 families, respectively. The families Actinidiaceae, Euphorbiaceae, Fabaceae, and Rubiaceae each contained two tree species. Other families, including Araliaceae, Cannabaceae, Cupressaceae, Cycadaceae, Ericaceae, Fagaceae, Juglandaceae, Lauraceae, Meliaceae, Moraceae, Pinaceae, Pittosporaceae, Podocarpaceae, Proteaceae, Sapindaceae, and Theaceae, were represented by one species each. The dominant families in zones A, B, and C were Actinidiaceae (13%), Euphorbiaceae and Fabaceae (10%), and Fabaceae (13%). Species diversity (Species richness, Margalef, Shannon's diversity index, Pielou’s evenness) generally decreases with increasing elevation. The tree species in elevational A had the highest Shannon diversity index (H’) of 0.84, followed by elevations B and C with 0.63 and 0.25, respectively. Elevation, air temperature, and air humidity are environmental factors with the highest correlation to species composition. The reduction in species diversity with elevation may be attributed to harsher climatic conditions, lower soil fertility, and increased environmental stress at higher altitudes. This study contributes to closing knowledge gaps, clarifies observed forest dynamics, and provides valuable information for restoration strategies.
species composition, elevational gradient, montane zone, species diversity
Mountain areas are essential ecosystems that harbor plant diversity and contribute to ecosystem services, particularly as sources of groundwater for human populations. Through the hydrological cycle, they collect rainwater, store it, and release it gradually to the lowlands [1, 2]. Thus, the populations downstream greatly depend on the mountain water resources [3]. The availability of groundwater is determined by forest and vegetation composition through infiltration and percolation processes in the recharge area [4, 5]. Vegetation cover, soil, land use type, and rainfall intensity are factors that influence groundwater infiltration rates [6, 7]. The existence of groundwater is very sensitive to changes in land use. Land use change has dramatically affected water conservation in recent decades [8]. For instance, the conversion of forests to non-forests (fields, agriculture) has reduced the hydrological function of forests, especially in upstream areas, namely decreased infiltration, decreased groundwater supply, increased surface runoff, and erosion [9-11]. Furthermore, forest change in recharge areas will affect water infiltration capacity, which in turn will impact groundwater availability [12]. Land use changes in recharge areas greatly affect the amount of groundwater recharge, which in turn affects the sustainability of the groundwater recharge function in the area [6].
One of the mountain ecosystems in Java-Indonesia that can contribute to ecosystem services is Mount Merbabu. Approximately 70% of Mount Merbabu is covered by forest, contributing significantly to its role as a "water tower"—a crucial source of groundwater [13]. Groundwater from Mount Merbabu flows and becomes a mainstay of life for the surrounding population and the lower areas (Semarang, Salatiga, Boyolali, and Magelang Regencies) for various needs of their lives. Approximately 7,868 households depend directly on groundwater from 36 springs of Mount Merbabu [14]. Mount Merbabu also supplies groundwater to several surrounding basins, including Magelang-Temanggung, Rawapening, Salatiga, and Boyolali-Karanganyar. To maintain, protect, and preserve, the Indonesian government designated Mount Merbabu forest as the Mount Merbabu National Park area in 2014 [13].
Thus, the high land cover and species diversity in Mount Merbabu are probably influenced by various elevations along environmental gradients in tropical forests [15]. The species diversity, composition, and structure of the mount forest were affected by several environmental conditions [16]. Biotic and abiotic variables affect the distribution and diversity patterns of species along altitudinal gradients [17]. For instance, elevation significantly influences vegetation composition and diversity in Andean and Himalayan mountains [18-20]. Various studies showed that the majority of the vegetation variables (species richness, family richness, diversity, density, and crown cover) declined with increasing elevations [21, 22]. Elevation is a significant component that directly affects environmental variability, including substrate, climate, water availability, and nutrients [23]. Species diversity and composition along altitudinal gradients can be used as important indicators for guiding conservation decisions [24].
However, information about tree species composition along an elevational gradient in Mount Merbabu is still lacking. In the previous research in Mount Merbabu, Rahayuningsih et al. [25] studied species richness of Pteridophyta, Izati and Purwoko [26] investigated the diversity and distribution of macrofungi in pine forest and mixed forest, and Hafizhasando et al. [27] identified fungi in the Selo hiking trail. Consequently, studies about the vegetation composition along an elevational gradient in Mount Merbabu are necessary to close knowledge gaps, clarify observed forest dynamics, and create a quick and effective restoration strategy. Data on vegetation may be needed to monitor management practices, contribute to environmental impact statements, assist in solving ecological problems, monitor land use practices, help predict future changes in the distribution of plant species, and be linked to both human impacts on habitats through land use practices and climate change [28]. This study aims to investigate how tree species composition and diversity vary along an elevational gradient in Mount Merbabu and to identify key environmental factors influencing these patterns.
2.1 Study site
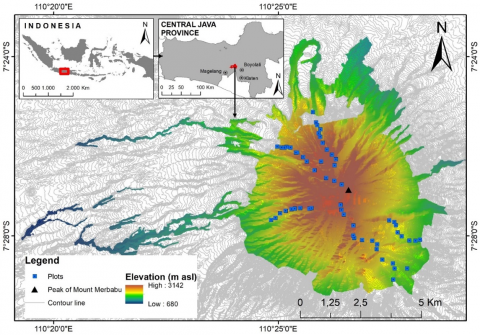
Our study was carried out in Merbabu Mountain forest, Central Java, Indonesia (Figure 1). Merbabu Mountain covers three districts: Magelang Regency, Semarang Regency, and Boyolali Regency. The area geographically located is at 110°26'22" E and 7°27'13" S. The soil type is Andosol with dominated slopes >40%. The Schmidt and Ferguson climate classification is categorized in a type B climate with a Q value = 31.42%, 2,000-3,000 mm of rainfall, and a 17-30℃ temperature range. The ecosystem of Merbabu Mountain is divided into 4 zones that are the tropical zone (0-1,000 m), sub-montane zone (1,000-1,500 m asl), montane zone (1,500-2,400 m asl), and sub-alpine zone (>2,400 m asl). However, our research was conducted in montane zones (1,500-2,500 m asl) until sub-alpine zones (>2,500 m asl).
Figure 1. Map of the study site of Mount Merbabu and the position of sampling plot locations in five climbing routes
2.2 Plot selection
Data on vegetation composition and species diversity were collected using quadrat plots of 3 elevations that were elevational gradient A (1,500-2,000 m asl), elevational gradient B (2,000-2,500 m asl), and elevational gradient C (>2,500 m asl). Data were collected in 59 plots consisting of 21 plots in elevational gradient A, 22 plots in elevational gradient B, and 16 plots in elevational gradient C. 59 plots were placed along five climbing routes (different slope directions) as transects, namely Ngagrong, Selo, Wekas, Thekelan, and Sobleman. Plot placement begins at the forest area boundary and ends at Mount Merbabu's peak (upper montane zone). The distance between plots on each transect is approximately 100 m and is placed on the right and left side of the hiking tracks. Sample plot sizes are 20 × 20 m2, 10 × 10 m2, 5 × 5 m2, and 2 × 2 m2 for large tree, pole/small tree, sapling, and seedling level vegetation.
2.3 Vegetation survey
All individual trees habitus inside the plots were categorized into the following stages of tree growth that were seedling (height <1.5 m), sapling (height > 1.5 m, diameter at breast height (DBH) < 10.0 cm), poles (DBH 10.0-19.9 cm), and trees (DBH > 20.0 cm). For the poles and trees stage, we measured DBH and identified the species names of all of the individuals in each to calculate the diversity index. Meanwhile, seedlings and saplings were counted, and species were identified in plot sizes 2 m × 2 m and 5 m × 5 m, respectively. Tree species identification was carried out directly in the field by local people (local name), checked against to vegetation guidance book for Mount Merbabu National Park, and confirmed by experts. On the other hand, we also measured microclimate variables in each plot, including elevation, air temperature, air humidity, soil temperature, and litter thickness.
2.4 Data analysis
2.4.1 Importance value index
The species that predominated in the plots were described and compared using the Importance Value Index (IVI) of Curtis and McIntosh [29] and Mueller-Dombois and Ellenberg [30]. The significance value on a scale ranging from 0 to 100 indicates how dominant a species is in that specific community. The most "important" species in a plot were those with the highest IVI. The total significance of each species within the community structure is ascertained using this index. The following equations are used:
IVI= relative density + relative dominance + relative frequency
$\begin{aligned} & { relative~density } =\frac{number~of~individual~of~a~species~A}{ total~number~of~individuals~of~all~species} \times 100 \%\end{aligned}$ (1)
$\begin{aligned} & { relative~dominance} =\frac{basal~area~of~a~species}{ total~basal~area~of~all~species} \times 100 \%\end{aligned}$ (2)
$\begin{aligned} & {relative~frequency} =\frac{frequency~of~a~species~A}{sum~of~freuency ~value~of~all~species} \times 100 \%\end{aligned}$ (3)
2.4.2 Species diversity index
To determine the level of species diversity, a calculation is carried out based on species richness, Margalef (d), Shannon diversity index (H’), and Pielou’s evenness (J’) [31]. Species richness Margalef's index (d) formulas are as follows:
$d=\frac{(S-1)}{\ln N}$ (4)
where, S is the number of species, and N is the total number of individuals in the sample.
The Shannon index (H’) is calculated from the equation:
$H^{\prime}=-\sum p i \ln p i$ (5)
where, pi is the proportion of individuals found in the ith species.
We also calculated the evenness using J’ as:
$J^{\prime}=H^{\prime} / \ln S$ (6)
Multivariate ecological software, namely PRIMER V.6, was used to evaluate the data of species diversity using the DIVERSE feature available in Plymouth Routines in Multivariate Ecological Research (PRIMER) [32]. Moreover, the variations in vegetation composition, and the data were analyzed using non-metric multidimensional scaling analysis (NMDS) (based on the Bray–Curtis measure) and analysis of similarity (ANOSIM) available in PRIMER V.6. One-way ANOSIM was used to determine the significance of the NMDS ordination findings [33]. The proportional contribution of each species to the variation in elevation was then investigated using SIMPER (Similarity Percentage) analysis. A canonical correspondence analysis (CCA) was also used to determine how microclimate variables may influence species composition and abundance and their relationships with other species. CANOCO V.4.5 software was used to perform CCA analysis [34, 35].
3.1 Species composition and dominant species
Individual species of tree habitus were dispersed in different elevations of mountain areas (elevational gradients A, B, and C). We discovered as many as 712 numbers of individuals comprising 24 species in 20 families in our plots for all individuals, including trees, poles, saplings, and seedlings. A total of 139 seedlings representing 10 species in 8 families were found in the surveys of the sampling plot, 211 saplings representing 16 species in 12 families, 141 small trees representing 20 species in 17 families, and 217 large trees representing 13 species in 12 families (Table 1).
Actinidiaceae, Euphorbiaceae, Fabaceae, and Rubiaceae are listed as families with more than one species of trees (2 species each), followed by Araliaceae, Cannabaceae, Cuspressaceae, Cycadaceae, Ericaceae, Fagaceae, Juglandaceae, Lauraceae, Meliaceae, Moraceae, Pinaceae, Pittosporaceae, Podocarpaceae, Proteaceae, Sapindaceae, and Theaceae with one species each. The dominant families in zones A, B, and C are Actinidiaceae (13%), Euphorbiaceae and Fabaceae (10%), and Fabaceae (13%) (Table 1).
The elevational zone in mountain zone B has the largest number of tree species and families, which are 20 and 18, respectively. The number of species and families in mountain zone A was 15 and 14, and the number of species and families in mountain zone C was 6 and 5, respectively (Table 1). Our results suggested that elevation affected species composition. The number of individuals and species in tree habitus would decrease with increasing elevation. Numerous studies, such as Naud et al. [36], Monge‐González et al. [37], and Bogale Worku et al. [38], have observed that species composition declined with increasing elevation. Elevation is a crucial environmental variable that influences plant habitats [39]. Elevation variation influences other environmental factors like temperature, rainfall, air pressure, soil, and water systems, which regulate plant growth and distribution patterns of vegetation [36]. Elevation had a significant influence on the nutritional composition. The C, N, and P contents of litter decreased significantly with increased elevation [39].
Table 1. Total of species, distribution, and number of individuals according to tree life stage on various elevations
|
No. |
Species |
Family |
Origin |
Elevation |
|||||||||||
|
A (1,500-2,000) |
B (2,000-2,500) |
C (>2,500) |
|||||||||||||
|
Se |
Sa |
P |
T |
Se |
Sa |
P |
T |
Se |
Sa |
P |
T |
||||
|
1 |
Podocarpus imbricatus |
Podocarpaceae |
Native1,2 |
- |
- |
3 |
18 |
- |
2 |
- |
7 |
- |
- |
- |
- |
|
2 |
Cycas rumpii |
Cycadaceae |
Native1 |
- |
- |
- |
1 |
- |
- |
1 |
2 |
- |
- |
- |
- |
|
3 |
Ficus fistulosa |
Moraceae |
Native1,2 |
- |
7 |
2 |
- |
1 |
4 |
- |
- |
- |
- |
- |
- |
|
4 |
Glochidion rubrum |
Euphorbiaceae |
Native1,2 |
- |
1 |
4 |
2 |
1 |
4 |
1 |
- |
- |
- |
- |
- |
|
5 |
Saurauia bracteosa |
Actinidiaceae |
Native1,2 |
- |
2 |
2 |
- |
- |
2 |
1 |
- |
- |
- |
- |
- |
|
6 |
Schima wallichii |
Theaceae |
Native1,2 |
12 |
12 |
19 |
27 |
- |
- |
- |
- |
- |
- |
- |
- |
|
7 |
Acacia decurrens |
Fabaceae |
Non native1,3, IAS4 |
33 |
24 |
44 |
35 |
12 |
17 |
14 |
22 |
- |
9 |
- |
2 |
|
8 |
Pinus merkusii |
Pinaceae |
Non native1 |
- |
- |
4 |
39 |
- |
- |
- |
1 |
- |
- |
- |
- |
|
9 |
Casuarina junghuhniana |
Actinidiaceae |
Native1,2 |
- |
- |
2 |
9 |
- |
- |
- |
- |
- |
- |
- |
- |
|
10 |
Cinchona pubescens |
Rubiaceae |
Non native1,3, IAS4 |
- |
1 |
1 |
- |
- |
- |
- |
- |
- |
- |
- |
- |
|
11 |
Lithocarpus sundaicus |
Fagaceae |
Native1,2 |
- |
2 |
1 |
1 |
- |
2 |
3 |
1 |
- |
- |
- |
- |
|
12 |
Engelhardia serrata |
Juglandaceae |
Native1,2 |
15 |
7 |
5 |
10 |
1 |
4 |
13 |
20 |
- |
- |
- |
- |
|
13 |
Dodonaea viscosa |
Sapindaceae |
Native1,2 |
1 |
1 |
1 |
- |
18 |
23 |
4 |
- |
20 |
6 |
- |
- |
|
14 |
Homalanthus giganteus |
Euphorbiaceae |
Native1,2 |
- |
- |
- |
- |
1 |
1 |
- |
- |
- |
- |
- |
- |
|
15 |
Paraserianthes lophantha |
Fabaceae |
Native2 |
- |
- |
- |
- |
- |
50 |
- |
- |
4 |
2 |
- |
- |
|
16 |
Pittosporum moluccanum |
Pittosporaceae |
Native2 |
- |
- |
- |
- |
- |
- |
3 |
2 |
- |
- |
- |
- |
|
17 |
Macropanax dispermus |
Araliaceae |
Native1 |
2 |
- |
1 |
6 |
6 |
- |
1 |
1 |
- |
- |
- |
- |
|
18 |
Nauclea lanceolata |
Rubiaceae |
Native1 |
- |
- |
- |
- |
- |
3 |
2 |
- |
- |
- |
- |
- |
|
19 |
Aglaia sp. |
Meliaceae |
Native1 |
- |
- |
- |
- |
- |
5 |
- |
- |
- |
8 |
- |
- |
|
20 |
Vaccinium varingiaefolium |
Ericaceae |
Native1,2 |
- |
- |
- |
- |
- |
1 |
- |
- |
12 |
9 |
4 |
- |
|
21 |
Cupressus sp. |
Cupressaceae |
Non native1,2 |
- |
- |
1 |
1 |
- |
- |
1 |
1 |
- |
- |
- |
- |
|
22 |
Litsea cubeba |
Lauraceae |
Native1,2 |
- |
- |
- |
- |
- |
- |
3 |
- |
- |
- |
- |
- |
|
23 |
Trema orientalis |
Cannabaceae |
Native1,2 |
- |
- |
- |
- |
- |
- |
- |
- |
- |
2 |
- |
- |
|
24 |
Helicia serrata |
Proteaceae |
Native1,2 |
- |
- |
- |
- |
- |
- |
4 |
9 |
- |
- |
- |
- |
|
Number of species/family |
|
15/14 |
20/18 |
6/5 |
|||||||||||
|
Number of individuals |
|
63 |
57 |
90 |
149 |
40 |
118 |
51 |
66 |
36 |
36 |
4 |
2 |
||
|
Number of individuals based on the elevational gradient |
|
359 |
|
|
|
275 |
|
|
|
78 |
|
|
|
||
All tree life stages (seedlings, saplings, poles, trees) can still be found at elevational gradients A and B, but this begins to change at elevational gradient C. There is almost no tree or pole stage; only saplings and seedlings predominate. Only Acacia decurrens and Vaccinium varingiaefolium are observed on poles and trees. Other species that grow in elevation C are Dodonaea viscosa, Paraserianthes lophantha, Aglaia sp., and Trema orientalis in the form of seedlings and saplings (Table 1). Only tree species capable of adapting will survive. Vegetations can adapt to the environmental changes associated with high elevations by augmenting stomatal density, mesophyll tissue thickness, and leaf thickness while reducing leaf area [40].
In comparison to another mountain forest, the number of species found at an elevation of 2,000-2,500 m asl on Mount Merbabu is equivalent to the number of tree species in the Harego Mountain Forest (Ethiopia), totaling 19 species [38]. However, the number of species identified in this study was fewer than that reported in Tilu Mountain forest (West Java), which documented 32 tree species at an elevation of 1500-2000 m asl [41], Mount Ciremai (West Java) with 57 species at an elevation 1,600-2,050 m asl [42], and Mount Wilis (East Java) with 72 tree species at an elevation of 1,100-1,500 m asl [43]. The difference in species composition between West and East Java is mostly attributable to variations in climate and anthropogenic disturbances [43]. The decline in the number of tree species at lower elevation gradients (A) may relate to anthropogenic disturbances such as burning, grazing, and illegal logging. At lower elevations, community demand on forest regions is intensified, resulting in an increased likelihood of disruption. Grazing activity on Mount Merbabu forest is rather high and tends to decrease with natural sustainability. Grazing activities have caused the forest canopy to shrink and native species to be disturbed [44, 45].
The species are ranked according to their ecological significance using the Important Value Index (IVI). This indicator identifies the dominant species within a community at each growth stage [46]. The IVI for each stage, including trees, poles, saplings, seedlings, and shrubs, is shown in Tables 2-5.
A. decurrens (Fabaceae) was the most abundant IVI seedling species in elevational gradient A, accounting for 92% of all individuals in the corresponding plots. Whereas, Dodonaea viscosa (Sapindaceae) was the most abundant species in elevational gradient B, with IVI of 68%. The distribution of D. viscosa (Sapindaceae) is at all levels of the elevational gradient (A, B, C). At elevational level C, V. varingiaefolium (Ericaceae) exhibited a higher Importance Value Index (IVI) of 89% compared to D. viscosa (67%), despite the latter having a greater abundance. The higher IVI values of V. varingiaefolium were associated with its broader distribution across multiple sample plots compared to D. viscosa (Table 2).
Table 2. IVI for seedlings in 3 elevation horizons
|
Elevation |
No. |
Species |
Relative Density |
Relative Frequency |
IVI |
|
A (1,500-2,000) |
1 |
Acacia decurrens |
52.38 |
40 |
92.38 |
|
2 |
Engelhardia serrata |
23.81 |
30 |
53.81 |
|
|
3 |
Schima wallichii |
19.05 |
10 |
29.05 |
|
|
4 |
Macropanax dispermus |
3.17 |
10 |
13.17 |
|
|
5 |
Dodonaea viscosa |
1.59 |
10 |
11.59 |
|
|
B (2,000-2,500) |
1 |
Dodonaea viscosa |
45.00 |
23.08 |
68.08 |
|
2 |
Acacia decurrens |
30.00 |
30.77 |
60.77 |
|
|
3 |
Macropanax dispermus |
15.00 |
15.38 |
30.38 |
|
|
4 |
Glochidion rubrum |
2.50 |
7.69 |
10.19 |
|
|
5 |
Engelhardia serrata |
2.50 |
7.69 |
10.19 |
|
|
6 |
Homalanthus giganteus |
2.50 |
7.69 |
10.19 |
|
|
7 |
Ficus fistulosa |
2.50 |
7.69 |
10.19 |
|
|
C (>2,500) |
1 |
Vaccinium varingiafolium |
33.33 |
56.56 |
88.89 |
|
2 |
Dodonaea viscosa |
55.56 |
11.11 |
66.67 |
|
|
3 |
Paraserianthes lophanta |
11.11 |
33.33 |
44.44 |
The most common species in elevation A for saplings was A. decurrens (Fabaceae), accounting for 42.1% of the total number of individuals, respectively. In the medium mountain zone (B), Paraserianthes lophantha (Fabaceae) accounted for 42.4% of saplings, whereas V. varingiaefolium (Ericaceae) and A. decurrens (Fabaceae) accounted for 25% of the saplings in the upper mountain zone (C). A. decurrens (Fabaceae) and D. viscosa (Sapindaceae) are found at all levels of the elevational gradient (Table 3).
Table 3. IVI for saplings in 3 elevation horizons
|
Elevation |
No. |
Species |
Relative Density |
Relative Frequency |
Relative Dominance |
IVI |
|
A (1,500-2,000) |
1 |
Acacia decurrens |
42.11 |
26.09 |
51.67 |
119.86 |
|
2 |
Schima wallichii |
21.05 |
21.74 |
19.17 |
61.96 |
|
|
3 |
Ficus fistulosa |
12.28 |
13.04 |
9.10 |
34.42 |
|
|
4 |
Engelhardia serrata |
12.28 |
13.04 |
9.02 |
34.42 |
|
|
5 |
Saurauia bracteosa |
3.51 |
8.70 |
4.07 |
16.27 |
|
|
6 |
Lithocarpus sp. |
3.51 |
4.35 |
2.66 |
10.52 |
|
|
7 |
Glochidion rubrum |
1.75 |
4.35 |
2.26 |
8.36 |
|
|
8 |
Dodonaea viscosa |
1.75 |
4.35 |
1.80 |
7.91 |
|
|
9 |
Chincona spp. |
1.75 |
4.35 |
0.25 |
6.35 |
|
|
B (2,000-2,500) |
1 |
Paraserianthes lophanta |
42.37 |
7.14 |
42.49 |
92.01 |
|
2 |
Dodonaea viscosa |
19.49 |
21.43 |
18.21 |
59.13 |
|
|
3 |
Acacia decurrens |
14.41 |
25 |
17.74 |
57.15 |
|
|
4 |
Engelhardia serrata |
3.39 |
10.71 |
4.06 |
18.16 |
|
|
5 |
Aglaia sp. |
4.24 |
3.57 |
4.69 |
12.49 |
|
|
6 |
Glochidion rubrum |
3.39 |
7.14 |
1.92 |
12.49 |
|
|
7 |
Ficus fistulosa |
3.39 |
3.57 |
2.81 |
9.77 |
|
|
8 |
Nauclea lanceolate |
2.54 |
3.57 |
2.79 |
8.91 |
|
|
9 |
Saurauia bracteosa |
1.69 |
3.57 |
2.70 |
7.96 |
|
|
10 |
Podocarpus sp. |
1.69 |
3.57 |
1.68 |
6.95 |
|
|
11 |
Lithocarpus sp. |
1.69 |
3.57 |
0.18 |
5.45 |
|
|
12 |
Vaccinium varingiafolium |
0.85 |
3.57 |
0.52 |
4.94 |
|
|
13 |
Homalanthus giganteus |
0.85 |
3.57 |
0.20 |
4.62 |
|
|
C (>2,500) |
1 |
Vaccinium varingiafolium |
25 |
35.71 |
27.85 |
88.57 |
|
2 |
Acacia decurrens |
25 |
14.29 |
34.31 |
73.60 |
|
|
3 |
Dodonaea viscosa |
16.67 |
28.57 |
11.43 |
56.67 |
|
|
4 |
Aglaia sp. |
22.22 |
7.14 |
7.64 |
37 |
|
|
5 |
Trema orientalis |
5.56 |
7.14 |
14.98 |
27.68 |
|
|
6 |
Paraserianthes lophanta |
5.56 |
7.14 |
3.79 |
16.49 |
Table 4. IVI for poles in 3 elevation horizons
|
Elevation |
No. |
Species |
Relative Density |
Relative Frequency |
Relative Dominance |
IVI |
|
A (1,500-2,000) |
1 |
Acacia decurrens |
48.89 |
33.33 |
50.43 |
132.65 |
|
2 |
Schima wallichii |
21.11 |
15.38 |
20.07 |
56.56 |
|
|
3 |
Engelhardia serrata |
5.56 |
10.26 |
4.34 |
20.15 |
|
|
4 |
Glochidion rubrum |
4.44 |
7.69 |
5.03 |
17.17 |
|
|
5 |
Pinus merkusii |
4.44 |
5.13 |
5.15 |
14.72 |
|
|
6 |
Ficus fistulosa |
2.22 |
5.13 |
2.18 |
9.53 |
|
|
7 |
Saurauia bracteosa |
2.22 |
5.13 |
1.97 |
9.32 |
|
|
8 |
Podocarpus sp. |
3.33 |
2.56 |
2.04 |
7.93 |
|
|
9 |
Casuarina junghuhniana |
2.22 |
2.56 |
2.39 |
7.18 |
|
|
10 |
Lithocarpus sp. |
1.11 |
2.56 |
1.99 |
5.67 |
|
|
11 |
Cupressus sempervirens |
1.11 |
2.56 |
1.63 |
5.31 |
|
|
12 |
Macropanax dispermus |
1.11 |
2.56 |
1.16 |
4.84 |
|
|
13 |
Dodonaea viscosa |
1.11 |
2.56 |
0.89 |
4.57 |
|
|
14 |
Chincona spp. |
1.11 |
2.56 |
0.73 |
4.41 |
|
|
B (2,000-2,500) |
1 |
Acacia decurrens |
27.45 |
23.08 |
26.93 |
77.46 |
|
2 |
Engelhardia serrata |
25.49 |
19.23 |
28.49 |
73.21 |
|
|
3 |
Dodonaea viscosa |
7.84 |
11.54 |
4.44 |
23.82 |
|
|
4 |
Pittosporum moluccanum |
5.88 |
7.69 |
7.47 |
21.05 |
|
|
5 |
Helicia serrata |
7.84 |
3.85 |
9.16 |
20.85 |
|
|
6 |
Lithocarpus sp. |
5.88 |
7.69 |
4.66 |
18.24 |
|
|
7 |
Litsea sp. |
5.88 |
3.85 |
5.94 |
15.67 |
|
|
8 |
Nauclea lanceolate |
3.92 |
3.85 |
2.93 |
10.70 |
|
|
9 |
Cupressus sempervirens |
1.96 |
3.85 |
2.97 |
8.78 |
|
|
10 |
Saurauia bracteosa |
1.96 |
3.85 |
2.68 |
8.49 |
|
|
11 |
Macropanax dispermus |
1.96 |
3.85 |
2.15 |
7.95 |
|
|
12 |
Cycas rumpii |
1.96 |
3.85 |
1.21 |
7.02 |
|
|
13 |
Glochidion rubrum |
1.96 |
3.85 |
0.95 |
6.76 |
|
|
C (>2,500) |
1 |
Vaccinium varingiafolium |
100 |
100 |
100 |
300 |
Table 5. IVI for trees in 3 elevation horizons
|
Elevation |
No. |
Species |
Relative Density |
Relative Frequency |
Relative Dominance |
IVI |
|
A (1,500-2,000) |
1 |
Pinus merkusii |
26.17 |
23.04 |
29.34 |
78.56 |
|
2 |
Acacia decurrens |
23.49 |
25.60 |
10.84 |
59.93 |
|
|
3 |
Schima wallichii |
18.12 |
15.36 |
17.68 |
51.16 |
|
|
4 |
Podocarpus sp. |
12.08 |
10.24 |
13.65 |
35.97 |
|
|
5 |
Engelhardia serrata |
6.71 |
7.68 |
8.86 |
23.25 |
|
|
6 |
Casuarina junghuhniana |
6.04 |
5.12 |
10.82 |
21.98 |
|
|
7 |
Macropanax dispermus |
4.03 |
2.56 |
6.14 |
12.73 |
|
|
8 |
Glochidion rubrum |
1.34 |
2.56 |
1.78 |
5.68 |
|
|
9 |
Lithocarpus sp. |
0.67 |
2.56 |
0.59 |
3.82 |
|
|
10 |
Cycas rumpii |
0.67 |
2.56 |
0.33 |
3.56 |
|
|
11 |
Cupressus sempervirens |
0.67 |
2.56 |
0.26 |
3.49 |
|
|
B (2,000-2,500) |
1 |
Engelhardia serrata |
30.30 |
25.00 |
57.27 |
112.57 |
|
2 |
Acacia decurrens |
33.33 |
25.00 |
13.61 |
71.94 |
|
|
3 |
Helicia serrata |
13.64 |
5.00 |
11.65 |
30.29 |
|
|
4 |
Podocarpus sp. |
10.61 |
10.00 |
8.91 |
29.52 |
|
|
5 |
Pittosporum moluccanum |
3.03 |
10.00 |
0.67 |
13.70 |
|
|
6 |
Lithocarpus sp. |
1.52 |
5.00 |
5.59 |
12.11 |
|
|
7 |
Cycas rumpii |
3.03 |
5.00 |
0.54 |
8.57 |
|
|
8 |
Macropanax dispermus |
1.52 |
5.00 |
0.83 |
7.35 |
|
|
9 |
Pinus merkusii |
1.52 |
5.00 |
0.53 |
7.05 |
|
|
10 |
Cupressus sempervirens |
1.52 |
5.00 |
0.39 |
6.91 |
|
|
C (>2,500) |
1 |
Acacia decurrens |
100 |
100 |
100 |
300 |
Elevations A and B for poles were the most dominated by A. decurrens (Fabaceae) with an IVI of 133% and 77%. Another species that was also found in A and B are Glochidion rubrum (Euphorbiaceae), Engelhardia serrata (Juglandaceae), Saurauia bracteosa (Actinidiaceae), Macropanax dispermus (Araliaceae), Lithocarpus sp. (Fagaceae), Cupressus sp. (Cupressaceae), D. viscosa (Sapindaceae), and Ficus fistulosa (Moraceae). All species of tree habitus were not found in elevation gradient C except V. varingiaefolium (Ericaceae) with an IVI of 300% (Table 4). The dominant species in elevation gradients A, B, and C for trees was A. decurrens (60%, 72%, 100%). E. serrata, the most dominant species in elevation gradient B with 113%, followed by A. decurrens (72%), Helicia serrata (30%), Podocarpus sp. (30%), and Pittosporum moluccanum (14%) (Table 5).
A. decurrens and Pinus merkusii dominate elevation A (1,500–2,000 m asl). Schima wallichii, Casuarina junghuhniana, F. fistulosa, D. viscosa, Cupressus sp., Podocarpus sp. are also present at this elevation. Pinus merkusii, A. decurrens, Schima wallichii, Casuarina junghuhniana, and Podocarpus sp. are frequently found at this elevation because they are cultivated trees planted by Perhutani (State Forest Enterprise) in the 1980s (1975-1985). The vegetation of the high mountain forest, such as Engelhardia serrata, H. serrata, Podocarpus, A. decurrens, and Lithocarpus sp., dominates elevation B (2,000–2,500 m asl). Elevation >2,500 m is dominated by V. varingiaefolium and A. decurrens (Tables 2, 3, 4, and 5).
Table 1 indicates the presence of several non-native species, namely A. decurrens, P. merkusii, C. pubescens, and Cupressus sp.; nonetheless, certain plants may potentially become invasive alien species (IAS) such as A. decurrens and C. pubescens [47]. A. decurrens is a species that is found at almost all elevations and tree life stages due to its status as a pioneer species with considerable adaptability. The presence of A. decurrens was positively correlated with temperature, light intensity, and slope. A. decurrens exhibits a preference for elevated temperatures, since it is favorably connected with germination capacity [48]. In Mount Merapi (Central Java), A. decurrens was found in clusters at the Cangkringan site, which was impacted by the eruption, and scattered randomly at the Selo site, which was unaffected by the eruption [48]. Meanwhile, A. decurrens in Mount Merbabu was identified as a clump distribution, occurring on slopes of 25-40%, but absent on slopes exceeding 40% [49].
A. decurrens is an IAS that has been distinct to Australia since the Dutch colonial period and has proliferated rapidly in Mount Merbabu. The distribution of IAS was closely correlated with the disturbance intensity of the respective ecosystem. The highest concentrations of IAS were found in burned areas adjacent to forest borders with direct human impact, whereas the undisturbed forest exhibited the lowest level of invasion. When forest areas open up, invasive alien species quickly take over, reducing the population of native species [50].
A similar condition has already occurred on Mount Merapi, a volcano located just beside Mount Merbabu [51]. Frequent fires facilitate the proliferation of invasive species, endangering natural plant populations [52]. IAS disrupts biogeographic domains, affects the richness and abundance of native species, increases the risk of native species extinction, influences the genetic composition of native populations, alters native animal behavior, modifies phylogenetic diversity across communities, and changes trophic networks [53].
The native species of mountain forests that have been identified include S. bracteosa, M. dispermus, Trema orientalis, Glochidion sp., Homalanthus giganteus, Lithocarpus sp., Engelhardia serrata, Litsea sp., Ficus fistulosa, Pittosporum moluccanum, Helicia serrata, D. viscosa (Table 1) [47, 54, 55]. This native species can be used as an option for selecting species for forest restoration [56]. Ficus spp. are essential for forest restoration efforts as they serve as keystone species in tropical forest ecosystems [57-60]. Ficus is recognized as a keystone plant due to its significance in ecology and vegetative communities, and as a food source for frugivorous animals in forests [61]. Some Ficus species exhibit beneficial traits for restoration and the preservation of water resources (e.g., springs) [62].
3.2 Differences in species composition
Species composition varied along the elevation gradient. The results of the NMDS and ANOSIM analyses reveal differences in species composition. The ordination analysis of sample plots indicated that the sampling locations along the elevational gradient are distinct. The NMDS results are reliable because of the minimal 2D stress level (0.01). The plots were essentially grouped into three clusters (Figure 2).
Figure 2. Plot ordination for 3 elevation zones on Mount Merbabu
The global ANOSIM revealed significant disparities in species composition across elevation gradient sites (Global R=0.29) for all species. ANOSIM's testing indicated that there are notable differences in species composition between elevation gradients A and C, with the highest R of 0.537 (Table 6). However, the species composition of elevation gradients A and B, and elevation gradients B and C is a mixed species composition. Certain species at elevation A can thrive at elevation B, while some species at elevation B can inhabit at elevation C.
Table 6. Result of analysis of similarities (ANOSIM)
|
Elevation |
R Statistic |
|
A (1,500-2,000), B (2,000-2,500) |
0.137 |
|
B (2,000-2,500), C (>2,500) |
0.234 |
|
A (1,500-2,000), C (>2,500) |
0.537 |
Species contribute to the average Bray-Curtis similarity in each elevation group, determined by SIMPER analysis. The percentage (%) contribution indicates how much each species typically contributes to the overall similarity within the group. The consistency with which each species contributes to the group across plots is shown by the constancy ratio (similarity/standard deviation). Table 7 showed that the most species contributed to the similarity of plots within each group. A. decurrens had the highest average abundance and the largest percentage contribution for elevational gradient A (1,500-2,000 m asl) and B (2,000-2,500 m asl) at 52% and 42%, respectively. Whereas, V. varingiaefolium had the maximum abundance (0.78) and highest percentage contribution (70%) in elevational gradient C (>2,500 m asl). V. varingiaefolium is a native plant to mountainous regions. In Mount Lawu, Central Java, V. varingiaefolium is predominantly located at altitudes of 3,000 m asl. A positive correlation between the population of V. varingiaefolium individuals and abiotic conditions, specifically temperature, humidity, and altitude [63].
Table 7. SIMPER analysis for 3 elevation gradients, showing species that contribute the most in terms of similarity of plots within the group
|
Species |
Average Abundance |
Average Similarity (Si) |
Ratio Si/SD |
Contribution (%) Si |
|
A (1,500-2,000) |
|
|
|
|
|
Acacia Decurrens |
1.89 |
15.37 |
0.76 |
52.12 |
|
Schima Wallichii |
1.09 |
4.65 |
0.47 |
15.77 |
|
Pinus Merkusii |
0.91 |
4.55 |
0.47 |
15.43 |
|
Engelhardia Serrata |
0.79 |
3.15 |
0.41 |
10.68 |
|
B (2,000-2,500) |
|
|
|
|
|
Acacia Decurrens |
1.11 |
6.64 |
0.45 |
42.20 |
|
Dodonaea Viscosa |
0.78 |
3.99 |
0.32 |
25.36 |
|
Engelhardia Serrata |
0.79 |
3.92 |
0.42 |
24.91 |
|
C (>2,500) |
|
|
|
|
|
Vaccinium Varingiafolium |
0.78 |
13.31 |
0.51 |
69.99 |
|
Dodonaea Viscosa |
0.58 |
3.22 |
0.29 |
16.96 |
|
Paraserianthes Lophanta |
0.30 |
2.21 |
0.23 |
11.62 |
The species that significantly contributed to the dissimilarity between elevations are detailed in Tables 8, 9, and 10. A. decurrens is the species that contributes most to the differences in species composition between elevations. A. decurrens can thrive as a pioneer species in regions where native species cannot adapt to environmental conditions [64]. In some parts of Indonesia, A. decurrens has been identified as an invasive alien species (IAS) [65]. A. decurrens has been found in various regions of Indonesia, including Mount Merapi [51, 66, 67], Mount Merbabu [49], Kawah Ijen Nature Tourism Park [68], and Mount Panderman Nature Tourism [69]. On Mount Merapi, A. decurrens dominates the open and critical areas due to the eruption of Mount Merapi, especially in the regions affected by pyroclastic flow from the Mount Merapi eruption [67]. Consequently, it will inhibit and obstruct the presence of native species during the initial phase of vegetation succession in the open region due to the rapid canopy development of A. decurrens [64].
Table 8. Pairwise comparison between elevational gradient A (1,500-2,000 m asl) and B (2,000-2,500 m asl)
|
Species |
Elevation 1,500-2,000 |
Elevation 2,000-2,500 |
|
|
|
|
|
Av.Abund |
Av.Abund |
Av.Diss |
Diss./SD |
Contrib% |
Cum.% |
|
|
Acacia Decurrens |
1.89 |
1.11 |
17.37 |
1.06 |
20.93 |
20.93 |
|
Schima Wallichii |
1.09 |
0.00 |
9.75 |
0.71 |
11.75 |
32.68 |
|
Engelhardia Serrata |
0.79 |
0.79 |
9.35 |
0.95 |
11.27 |
43.95 |
|
Pinus Merkusii |
0.91 |
0.05 |
8.44 |
0.78 |
10.17 |
54.12 |
|
Dodonaea Viscosa |
0.08 |
0.78 |
7.02 |
0.69 |
8.46 |
62.59 |
|
Podocarpus Sp. |
0.39 |
0.23 |
4.08 |
0.60 |
4.91 |
67.50 |
|
Macropanax Dispermus |
0.19 |
0.20 |
2.93 |
0.43 |
3.53 |
71.03 |
|
Paraserianthes Lophanta |
0.00 |
0.36 |
2.66 |
0.24 |
3.20 |
74.23 |
|
Glochidion Rubrum |
0.21 |
0.18 |
2.65 |
0.52 |
3.19 |
77.43 |
|
Lithocarpus Sp. |
0.16 |
0.18 |
2.63 |
0.51 |
3.17 |
80.60 |
|
Ficus Fistulosa |
0.27 |
0.14 |
2.59 |
0.53 |
3.13 |
83.73 |
|
Casuarina Junghuhniana |
0.25 |
0.00 |
2.37 |
0.36 |
2.86 |
86.59 |
|
Helicia Serrata |
0.00 |
0.20 |
1.95 |
0.27 |
2.34 |
88.93 |
|
Saurauia Bracteosa |
0.16 |
0.11 |
1.87 |
0.48 |
2.26 |
91.19 |
Table 9. Pairwise comparison between elevational gradient A (1,500-2,000 m asl) and C (>2,500 m asl)
|
Species |
Elevation 1,500-2,000 |
Elevation >2,500 |
|
|
|
|
|
Av.Abund |
Av.Abund |
Av.Diss |
Diss/SD |
Contrib% |
Cum.% |
|
|
Acacia Decurrens |
1.89 |
0.26 |
23.95 |
1.10 |
24.86 |
24.86 |
|
Schima Wallichii |
1.09 |
0.00 |
12.34 |
0.73 |
12.80 |
37.66 |
|
Pinus Merkusii |
0.91 |
0.00 |
10.64 |
0.79 |
11.04 |
48.70 |
|
Vaccinium Varingiafolium |
0.00 |
0.78 |
9.25 |
0.82 |
9.60 |
58.30 |
|
Engelhardia Serrata |
0.79 |
0.00 |
8.35 |
0.75 |
8.67 |
66.97 |
|
Dodonaea Viscosa |
0.08 |
0.58 |
6.41 |
0.60 |
6.65 |
73.62 |
|
Paraserianthes Lophanta |
0.00 |
0.30 |
3.49 |
0.55 |
3.62 |
77.24 |
|
Podocarpus Sp. |
0.39 |
0.00 |
3.37 |
0.46 |
3.50 |
80.74 |
|
Casuarina Junghuhniana |
0.25 |
0.00 |
3.04 |
0.37 |
3.15 |
83.89 |
|
Ficus Fistulosa |
0.27 |
0.00 |
2.50 |
0.45 |
2.59 |
86.48 |
|
Glochidion Rubrum |
0.21 |
0.00 |
2.25 |
0.40 |
2.34 |
88.81 |
|
Macropanax Dispermus |
0.19 |
0.00 |
2.04 |
0.27 |
2.11 |
90.93 |
Table 10. Pairwise comparison between elevational gradient B (2,000-2,500 m asl) and C (>2,500 m asl)
|
Species |
Elevation 2,000-2,500 |
Elevation >2,500 |
|
|
|
|
|
Av.Abund |
Av.Abund |
Av.Diss |
Diss/SD |
Contrib% |
Cum.% |
|
|
Acacia Decurrens |
1.11 |
0.26 |
16.91 |
0.80 |
18.28 |
18.28 |
|
Dodonaea Viscosa |
0.78 |
0.58 |
16.20 |
0.76 |
17.51 |
35.79 |
|
Vaccinium Varingiafolium |
0.05 |
0.78 |
13.71 |
0.71 |
14.83 |
50.62 |
|
Engelhardia Serrata |
0.79 |
0.00 |
10.77 |
0.64 |
11.64 |
62.25 |
|
Paraserianthes Lophanta |
0.36 |
0.30 |
8.42 |
0.47 |
9.10 |
71.35 |
|
Aglaia Sp. |
0.10 |
0.18 |
3.62 |
0.30 |
3.91 |
75.26 |
|
Helicia Serrata |
0.20 |
0.00 |
3.36 |
0.28 |
3.63 |
78.90 |
|
Podocarpus Sp. |
0.23 |
0.00 |
2.69 |
0.38 |
2.91 |
81.81 |
|
Lithocarpus Sp. |
0.18 |
0.00 |
2.47 |
0.34 |
2.67 |
84.48 |
|
Macropanax Dispermus |
0.20 |
0.00 |
2.28 |
0.36 |
2.47 |
86.95 |
|
Homalanthus Giganteus |
0.06 |
0.00 |
1.55 |
0.21 |
1.68 |
88.63 |
|
Cycas Rumpii |
0.11 |
0.00 |
1.53 |
0.31 |
1.65 |
90.28 |
3.3 Species diversity
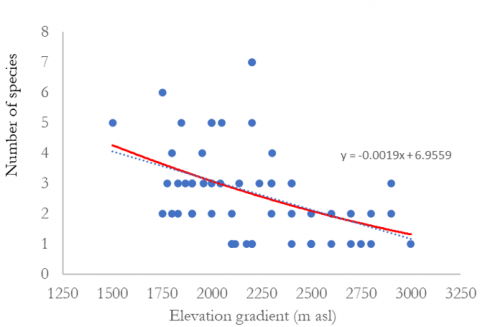
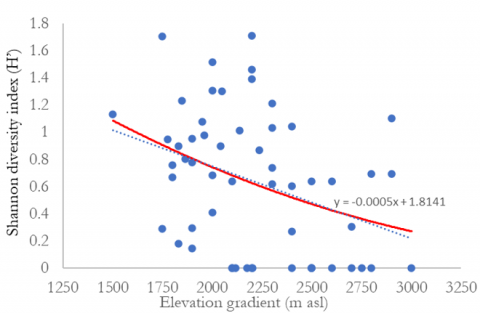
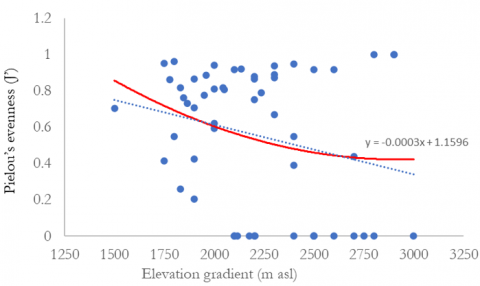
The relationship between species diversity and elevation can be seen in Figure 3. The findings indicated that species diversity decreases with increasing elevation. Regression analysis confirmed a significant negative correlation between elevation and species diversity. Analysis of species richness, Margalef, Shannon diversity index, and Pielou’s evenness indicate that species diversity at elevations between 1,500-2,000 meters above sea level is greater. Species diversity at elevation >2,500 m asl is the lowest. The tree species in elevational A (1,500-2,000 m asl) had the highest Shannon diversity index (H’) of 0.84, followed by elevations B (2,000-2,500 m asl) and C (>2,500 m asl) with 0.63 and 0.25, respectively (Table 11). The Shannon diversity index in Mount Merbabu, Central Java, was lower than that in Mount Wilis, East Java (2.76) [43], and Mount Tilu, West Java (2.45) [41], which were conducted at an altitude of 1500 m asl. The variations in diversity indices among forests are believed to be associated with habitat characteristics, climatic conditions, and disturbance levels [38, 41].
Figure 3. Relationships between the number of species, species richness, Shannon diversity index, Pielou’s evenness, and elevation
Table 11. Diversity indices of tree habitus species in the three elevational gradients of Mount Merbabu
|
|
Elevational Gradient |
||
|
A (1,500-2,000 m asl) |
B (2,000-2,500 m asl) |
C (>2,500 m asl) |
|
|
Species Richness Margalef (d) |
0.88 |
0.69 |
0.41 |
|
Shannon Diversity Index (H’) |
0.84 |
0.63 |
0.25 |
|
Pielou’s Evenness (J’) |
0.69 |
0.51 |
0.33 |
This study confirmed several studies on the relationship between elevation and species diversity. Elevation is a crucial determinant affecting species diversity in mountainous locations. Species diversity declined as altitude increased, suggesting that environmental conditions play a crucial role in influencing tree vegetation at elevated elevations [19, 20, 70, 71]. Elevation influences species composition, diversity, distribution, density, and both horizontal and vertical growth [38]. Elevation causes a decrease in species richness, although an increase in abundance is positively connected with height [70]. The slope's steepness, low soil moisture content, and shallow soil depth also contributed to the reduction of species diversity and stand structure in elevational gradients [38].
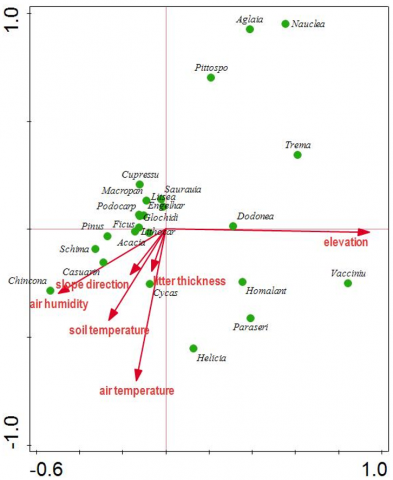
The CCA analysis identified six predictors (elevation, air temperature, air humidity, soil temperature, slope direction, and litter thickness) that affected species composition patterns (Figure 4). The ordination plot's scatter of points demonstrates the environmental heterogeneity of the three different elevations (A, B, C). However, elevation, air temperature, and air humidity were all shown to be crucial factors because they are represented by the longest arrows on the plot. The CCA analysis proved that elevation, air temperature, and air humidity are three environmental factors with the highest correlation to species composition. Gheyret et al. [72] investigated that the vertical distribution of vegetation types along an elevational gradient in mountainous regions is primarily influenced by variations in air temperature and humidity. Air temperature and humidity diminished along the elevational gradients, with a temperature decline rate of 0.59-0.71℃ per 100 meters.
Figure 4. A CCA sample-environment biplot of the 59 plots collected from five hiking tracks
Ohdo and Koichi [73] explained that species composition is most likely regulated by both elevation and soil nitrogen availability. Elevated climatic stress at high altitudes diminishes tree species diversity and canopy height, thereby augmenting light intensity on the forest floor, which leads to a proliferation of herbaceous and fern species. The community-weighted means of the three leaf qualities (leaf area, specific leaf area, and nitrogen mass) diminished with increasing elevation. Intense interspecific competition reduced the variance in the frequency distribution of plant height at low elevations with established canopy structures.
Tree habitus composition at elevation gradients A (1,500-2,000 m asl), B (2,000-2,500 m asl), and C (>2,500 m asl) was 15 species in 14 families, 20 species in 18 families, and 6 species in 5 families. A total of 139 seedlings representing 10 species in 8 families, 211 saplings representing 16 species in 12 families, 141 small trees representing 20 species in 17 families, and 217 large trees representing 13 species in 12 families. Species composition is significantly different between gradient elevations. Species composition at the lowest (A) and highest (C) elevations showed distinct differences, while the mid-elevation (B) exhibited characteristics of both adjacent zones. Species composition at elevation B is a mixture of vegetation A-B and vegetation B-C. Species diversity (Species richness, Margalef, Shannon's diversity index, Pielou’s evenness) decreases with increasing elevation. Elevation, air temperature, and air humidity are environmental factors with the highest correlation to species composition. The implications of the research are necessary to support strategies for forest restoration, particularly to identify and select native species useful for enrichment and rehabilitation planting based on their habitat.
This work is supported by the Final Project Recognition Grant Universitas Gadjah Mada, No.: 5075/UN1.P.II/Dit-Lit/PT.01.01/2023, National Research and Innovation Agency (BRIN), Mount Merbabu National Park, and Watershed Management Technology Center. We would like to thank Junita Parjanti and Nurpana Sulaksono, the head of Mount Merbabu National Park, for permission to enter the national park and conduct the field data collection. The authors also extend their gratitude to Susi Abdiyani, Pamungkas Buana Putra, Siswo, Bambang Dwi Atmoko, Lathif Bramantyo, Jarot Wahyudi, Sumali, and Dwiyanto, as well as to everyone else who contributed to this research but whose names cannot be mentioned one by one.
[1] Rhoades, A.M., Jones, A.D., Ullrich, P.A. (2018). Assessing mountains as natural reservoirs with a multimetric framework. Earth's Future, 6(9): 1221-1241. https://doi.org/10.1002/2017EF000789
[2] Wilson, J.L., Guan, H. (2004). Mountain‐block hydrology and mountain‐front recharge. Groundwater Recharge in a Desert Environment: The Southwestern United States, 9: 113-137. https://doi.org/10.1029/009WSA08
[3] Somers, L.D., McKenzie, J.M. (2020). A review of groundwater in high mountain environments. Wiley Interdisciplinary Reviews: Water, 7(6): e1475. https://doi.org/10.1002/wat2.1475
[4] Mutianto, H. (2016). Studi konservasi air untuk pemanfaatan airtanah yang berkelanjutan pada recharge area lereng gunungapi Merapi kabupaten Sleman Yogyakarta. Jurnal Geografi Gea, 8(2): https://doi.org/10.17509/gea.v8i2.1700
[5] Ding, B., Zhang, Y., Yu, X., Jia, G., Wang, Y., Wang, Y., Li, Z. (2022). Effects of forest cover type and ratio changes on runoff and its components. International Soil and Water Conservation Research, 10(3): 445-456. https://doi.org/10.1016/j.iswcr.2022.01.006
[6] Siddik, M.S., Tulip, S.S., Rahman, A., Islam, M.N., Haghighi, A.T., Mustafa, S.M.T. (2022). The impact of land use and land cover change on groundwater recharge in northwestern Bangladesh. Journal of Environmental Management, 315: 115130. https://doi.org/10.1016/j.jenvman.2022.115130
[7] Castillo, J.L.U., Ramos Leal, J.A., Martínez Cruz, D.A., Cervantes Martínez, A., Marín Celestino, A.E. (2021). Identification of the dominant factors in groundwater recharge process, using multivariate statistical approaches in a semi-arid region. Sustainability, 13(20): 11543. https://doi.org/10.3390/su132011543
[8] Zhang, W., An, S., Xu, Z., Cui, J., Xu, Q. (2011). The impact of vegetation and soil on runoff regulation in headwater streams on the east Qinghai–Tibet Plateau, China. Catena, 87(2): 182-189. https://doi.org/10.1016/j.catena.2011.05.020
[9] Maria R, Lestiana H. (2014). Effect of landuse on groundwater conservation function in Cikapundung Sub Watershed. Geology and Mining Research, 24(2): 77-89.
[10] Wasis, B., Harlan, D., Putra, M.H.W. (2020). Impact of forest land cover on runoff, erosion and sedimentation in the Karai Watershed, Simalungun Regency, North Sumatra Province, Indonesia. Archives of Agriculture and Environmental Science, 5(1): 40-49. https://doi.org/10.26832/24566632.2020.050106
[11] Narendra, B.H., Siregar, C.A., Dharmawan, I.W.S., Sukmana, A., Pratiwi, Pramono, I.B., Yuwati, T.W. (2021). A review on sustainability of watershed management in Indonesia. Sustainability, 13(19): 11125. https://www.mdpi.com/2071-1050/13/19/11125#
[12] Zhang, M., Wei, X. (2021). Deforestation, forestation, and water supply. Science, 371(6533): 990-991. https://doi.org/10.1126/science.abe7821
[13] Ashari, A., Widodo, E. (2019). Hydrogeomorphology and potential of springs on the southwest slope of Mount Merbabu. Majalah Geografi Indonesia, 33(1): 48-56. https://doi.org/10.22146/mgi.35570
[14] Dewi, K., Hardian, A.S., Cahyono, S.A. (2024). Assessing the economic value of water environmental services in Mount Merbabu National Park. Jurnal Sylva Lestari, 12(2): 338-352. https://doi.org/10.23960/jsl.v12i2.802
[15] Rozendaal, D.M., Bongers, F., Aide, T.M., Alvarez-Dávila, E., Ascarrunz, N., Balvanera, P., Poorter, L. (2019). Biodiversity recovery of Neotropical secondary forests. Science Advances, 5(3): eaau3114. https://doi.org/10.1126/sciadv.aau3114
[16] Campos, P.V., Villa, P.M., Schaefer, C.E.G.R., Alves-Nunes, J., Porembski, S., Neri, A.V. (2020). Beta diversity, community composition and structure of high altitude grasslands along an altitudinal gradient in southeastern Brazil. Revista de Biología Tropical, 68(3): 977-986.
[17] McCain, C.M., Grytnes, J.A. (2010). Elevational gradients in species richness. Encyclopedia of Life Sciences, 15: 1-10.
[18] Malizia, A., Blundo, C., Carilla, J., Osinaga Acosta, O., Cuesta, F., Duque, A., Young, K.R. (2020). Elevation and latitude drives structure and tree species composition in Andean forests: Results from a large-scale plot network. PloS one, 15(4): e0231553. https://doi.org/10.1371/journal.pone.0231553
[19] Das, D.S., Singh, D., Maity, D. (2024). Woody species diversity pattern along an elevation gradient of Sainj Wildlife Sanctuary, Western Himalaya, India. Vegetos, 37(4): 1-11.
[20] Bhat, J.A., Kumar, M., Negi, A.K., Todaria, N.P., Malik, Z.A., Pala, N.A., Shukla, G. (2020). Species diversity of woody vegetation along altitudinal gradient of the Western Himalayas. Global Ecology and Conservation, 24: e01302. https://doi.org/10.1016/j.gecco.2020.e01302
[21] Khamyong, S., Lykke, A.M., Seramethakun, D., Barfod, A.S. (2003). Species composition and vegetation structure of an upper montane forest at the summit of Mt. Doi Inthanon, Thailand. Nordic Journal of Botany, 23(1): 83-97. https://doi.org/10.1111/j.1756-1051.2003.tb00371.x
[22] Moreira, B., Villa, P.M., Alvez-Valles, C.M., Carvalho, F.A. (2021). Species composition and diversity of woody communities along an elevational gradient in tropical Dwarf Cloud Forest. Journal of Mountain Science, 18(6): 1489-1503. https://doi.org/10.1007/s11629-020-6055-x
[23] Campos, P.V., Villa, P.M., Nunes, J.A., Schaefer, C.E., Porembski, S., Neri, A.V. (2018). Plant diversity and community structure of Brazilian Páramos. Journal of Mountain Science, 15(6): 1186-1198. https://doi.org/10.1007/s11629-017-4674-7
[24] Rezende, V.L., de Miranda, P.L., Meyer, L., Moreira, C.V., Linhares, M.F., de Oliveira-Filho, A.T., Eisenlohr, P.V. (2015). Tree species composition and richness along altitudinal gradients as a tool for conservation decisions: the case of Atlantic semideciduous forest. Biodiversity and Conservation, 24: 2149-2163. https://doi.org/10.1007/s10531-015-0939-z
[25] Rahayuningsih, M., Rahayu, E.S., Pratiwi, A.N. (2021). Species richness of Pteridophyta in Mount Merbabu National Park. Journal of Physics: Conference Series, 1918(5): 052020. https://doi.org/10.1088/1742-6596/1918/5/052020
[26] Izati, N., Purwoko, T. (2020). Diversity and distribution of macrofungi in pine forest and mixed forest in Mount Merbabu National Park. IOP Conference Series: Materials Science and Engineering, 935(1): 012030. https://doi.org/10.1088/1757-899X/935/1/012030
[27] Hafizhasando, R., Rahayuningsih, M., Parmin, S.S. (2021). Fungi in Selo hiking trail of mount Merbabu national park Central Java. Journal of Physics: Conference Series, 1918(5): 052033. https://doi.org/10.1088/1742-6596/1918/5/052033
[28] Kent, M. (2011). Vegetation Description and Data Analysis: A Practical Approach. John Wiley & Sons.
[29] Curtis, J.T., McIntosh, R.P. (1950). The interrelations of certain analytic and synthetic phytosociological characters. Ecology, 31(3): 434-455. https://doi.org/10.2307/1931497
[30] Mueller-Dombois, D., Ellenberg, H. (1974). Aims and Methods of Vegetation Ecology. New York: Wiley.
[31] Magurran, A.E. (2021). Measuring biological diversity. Current Biology, 31(19): R1174-R1177.
[32] Clarke, K.R., Gorley, R.N. (2005). PRIMER: Getting started with v6. PRIMER-E Ltd: Plymouth, UK, 931, 932.
[33] Clarke, K.R., Somerfield, P.J., Gorley, R.N. (2008). Testing of null hypotheses in exploratory community analyses: Similarity profiles and biota-environment linkage. Journal of Experimental Marine Biology and Ecology, 366(1-2): 56-69. https://doi.org/10.1016/j.jembe.2008.07.009
[34] Sutomo, S., Darma, I.D.P., Iryadi, R. (2020). The dissimilarity in plant species composition of savanna ecosystem along the elevation gradient on Flores Island, East Nusa Tenggara, Indonesia. Biodiversitas Journal of Biological Diversity, 21(2). https://doi.org/10.13057/biodiv/d210209
[35] Lepš, J., Šmilauer, P. (2003). Multivariate Analysis of Ecological Data Using CANOCO. Cambridge University Press.
[36] Naud, L., Måsviken, J., Freire, S., Angerbjörn, A., Dalén, L., Dalerum, F. (2019). Altitude effects on spatial components of vascular plant diversity in a subarctic mountain tundra. Ecology and Evolution, 9(8): 4783-4795. https://doi.org/10.1002/ece3.5081
[37] Monge‐González, M.L., Craven, D., Krömer, T., Castillo‐Campos, G., Hernández‐Sánchez, A., Guzmán‐Jacob, V., Kreft, H. (2020). Response of tree diversity and community composition to forest use intensity along a tropical elevational gradient. Applied Vegetation Science, 23(1): 69-79. https://doi.org/10.1111/avsc.12465
[38] Bogale Worku, B., Genete Muluneh, M., Molla, T. (2023). Influence of elevation and anthropogenic disturbance on woody species composition, diversity, and stand structure in Harego Mountain Forest, northeastern Ethiopia. International Journal of Forestry Research, 2023(1): 8842408. https://doi.org/10.1155/2023/8842408
[39] Bin, H., Li, Q., Zhang, P., Li, W., Xue, X., Zou, S., Zhang, Q. (2022). Effects of elevation on ecological stoichiometry of plant leaves, litter, and soils in Pseudotsuga sinensis forest in the Karst Mountain region, Southwest China. Journal of Soil Science and Plant Nutrition, 22(3): 3582-3597. https://doi.org/10.1007/s42729-022-00911-y
[40] Liu, W., Zheng, L., Qi, D. (2020). Variation in leaf traits at different altitudes reflects the adaptive strategy of plants to environmental changes. Ecology and Evolution, 10(15): 8166-8175. https://doi.org/10.1002/ece3.6519
[41] Cahyanto, T., RAMDAN, D.M. (2020). Structure and composition of trees in mount Tilu nature reserve, West Java, Indonesia. Biodiversitas Journal of Biological Diversity, 21(6). https://doi.org/10.13057/biodiv/d210640
[42] Purwaningsih, Yusuf, R. (2008). The mountain rain forest vegetation analysis in Ciremai Mountain National Park, Majalengka, West Jawa. Jurnal Biologi Indonesia, 4(5): 385-399. https://jurnalbiologi.perbiol.or.id/home/article/0fe18824-1a1a-4a0a-b275-b55bed90483c.
[43] Purwaningsih, P., Polosakan, R., Yusuf, R., Kartawinata, K. (2017). Phytosociological study of the montane forest on the south slope of Mt. Wilis, East Java, Indonesia. REINWARDTIA, 16(1): 31-45.
[44] Aissiyah, A.K., Faida, L.R.W., Hermawan, M.T.T. (2019). Utilization of grass and fuel wood for community subsistence needs in Gunung Merbabu National Park. Jurnal Manusia dan Lingkungan, 26(1): 20-27. https://doi.org/10.22146/jml.23635
[45] Gunawati, D., Sulaksono, N., Ibrahim, M.H. (2025). A collaborative management model as an effort for the conservation of native plants of Java’s mountains in Mount Merbabu National Park. BIO Web of Conferences, 154: 01007. https://doi.org/10.1051/bioconf/202515401007
[46] Susilowati, A., Elfiati, D., Rachmat, H.H., Yulita, K.S., Hadi, A.N., Kusuma, Y.S., Batu, S.A.L. (2020). Vegetation structure and floristic composition of tree species in the habitat of Scaphium macropodum in Gunung Leuser National Park, Sumatra, Indonesia. Biodiversitas Journal of Biological Diversity, 21(7). https://doi.org/10.13057/biodiv/d210720
[47] Tjitrosoedirdjo, S.S., Mawardi, I., Tjitrosoedirdjo, S. (2016). 75 important invasive plant species in Indonesia. SEAMEO BIOTROP, Southeast Asian Regional Centre for Tropical Biology.
[48] Afrianto, W.F., Hikmat, A., Widyatmoko, D. (2017). Growth and habitat preference of Acacia decurrens Willd.(Fabaceae) after the 2010 eruption of Mount Merapi, Indonesia. Asian Journal of Applied Sciences, 5(1).
[49] Untoro, Y., Hikmat, A., Prasetyo, L.B. (2017). The spatial suitable habitat model of Acacia decurrens in Mount Merbabu National Park. Media Konservasi, 22(1): 49-63. https://doi.org/10.29244/medkon.22.1.49-63
[50] Mukaromah, L., Imron, M.A. (2020). Invasive plant species in the disturbed forest of Batukahu Nature Reserve, Bali, Indonesia. Biotropia, 27(1): 22-32. https://doi.org/10.11598/btb.2020.27.1.933
[51] Sutomo, S. (2019). Acacia decurrens in parts of the Mount Merapi National Park Yogyakarta. Jurnal Al-Azhar Indonesia Seri Sains dan Teknologi, 5(1): 38-42. https://doi.org/10.36722/sst.v5i1.321
[52] García-Duro, J., Cruz, O., Casal, M., Reyes, O. (2019). Fire as driver of the expansion of Paraserianthes lophantha (Willd.) IC Nielsen in SW Europe. Biological Invasions, 21: 1427-1438. https://doi.org/10.1007/s10530-018-01910-w
[53] Pyšek, P., Hulme, P.E., Simberloff, D., Bacher, S., Blackburn, T.M., Carlton, J.T., Richardson, D.M. (2020). Scientists' warning on invasive alien species. Biological Reviews, 95(6): 1511-1534. https://doi.org/10.1111/brv.12627
[54] van Steenis, C.G.G.J. (1972). The Mountain Flora of Java. E. J. Brill, Leiden, Netherlands. https://bsi.gov.in/uploads/userfiles/file/Rare%20Books/The%20Mountain%20Folra%20Of%20Java.pdf.
[55] Kew backbone distributions. Plants of the World Online. https://powo.science.kew.org/results?
[56] Touhami, I., KHORCHANI, A., Nasr, Z., Elaieb, M.T., Rzigui, T., Khaldi, A. (2019). Restauration écologique des forêts par l'utilisation d'espèces autochtones au nord-ouest de la Tunisie: une nouvelle expérience d'approche participative. Ecologia Mediterranea, 45(1): 75. https://doi.org/10.3406/ecmed.2019.2077
[57] Kuaraksa, C., Elliott, S., Hossaert-Mckey, M. (2012). The phenology of dioecious Ficus spp. tree species and its importance for forest restoration projects. Forest Ecology and Management, 265: 82-93. https://doi.org/10.1016/j.foreco.2011.10.022
[58] Kuaraksa, C., Elliott, S. (2013). The use of Asian Ficus species for restoring tropical forest ecosystems. Restoration ecology, 21(1): 86-95. https://doi.org/10.1111/j.1526-100X.2011.00853.x
[59] Peniwidiyanti, P., Qayim, I., Chikmawati, T. (2022). A study on diversity and distribution of figs (Ficus, Moraceae) in Bogor city, West Java, Indonesia. Journal of Tropical Biodiversity and Biotechnology, 7(2): 68516. https://doi.org/10.22146/jtbb.68516
[60] Sawadogo, Y., Belem, M., Sabo, P., Kabré, B., Tiétiambou, F.R.S., Ouédraogo, A. (2024). A critical review on the Ficus genus in Africa: current knowledge and perspectives for its sustainable management. Biodiversity and Conservation, 33(10): 2739-2756. https://doi.org/10.1007/s10531-024-02881-2
[61] Dewi, S.I., Syamsuardi, S., Nurainas, N. (2023). Diversity, distribution and potential uses of Ficus spp. in Sumatra, Indonesia. Biodiversitas Journal of Biological Diversity, 24(6). https://doi.org/10.13057/biodiv/d240639
[62] Soejono, S., Budiharta, S., Arisoesilaningsih, E. (2013). Proposing local trees diversity for rehabilitation of degraded lowland areas surrounding springs. Biodiversitas Journal of Biological Diversity, 14(1). https://doi.org/10.13057/biodiv/d140106
[63] Roziaty, E., Al Farisi, A.N. (2022). Cantigi (Vaccinium varingifolium (Blume) Miq.) Di Jalur Pendakian Gunung Lawu Kabupaten Karanganyar Jawa Tengah. Bioeksperimen: Jurnal Penelitian Biologi, 8(1): 20-29. https://doi.org/10.23917/bioeksperimen.v8i1.18086
[64] Sunardi, S., Sulistijorini, S., Setyawati, T. (2017). Invasion of Acacia decurrens Willd. after eruption of mount Merapi, Indonesia. Biotropia, 24(1): 35-46. https://doi.org/10.11598/btb.2017.24.1.524
[65] Afrianto, W.F. (2021). The potential distribution prediction of the invasive alien species Acacia decurrens Wild., in Indonesia. International Journal of Applied Biology, 5(2): 74-84. https://doi.org/10.20956/ijab.v5i2.17949
[66] Afrianto, W.F., Hikmat, A., Widyatmoko, D. (2020). Plant species diversity and degree of homogeneity after the 2010 eruption of Mount Merapi, Indonesia. Biosaintifika: Journal of Biology & Biology Education, 12(2): 274-281. https://doi.org/10.15294/biosaintifika.v12i2.23525
[67] Suryawan, D., Sutyarto, E., Umaya, R., Kurnia, A., Hadiyan, Y. (2015). Distribution of invasive alien species of Acacia decurrens in Mount Merapi National Park. In Prosiding Seminar Nasional Masyarakat Biodiversitas Indonesia, 1(4): 738-742. https://doi.org/10.13057/psnmbi/m010409
[68] Hapsari, L., Basith, A., Novitasiah, H.R. (2014). Inventory of invasive plant species along the corridor of Kawah Ijen nature Tourism Park, Banyuwangi, East Java. Journal of Indonesian Tourism and Development Studies, 2(1): 1.
[69] Septiadi, L., Wahyudi, D., Sylvia Rachman, R., Syafrudin, S., Thobibatus Shofia Alfaruqi, N. (2018). The invasive plants species along the hiking track of mount panderman nature tourism, Batu, East Java. Journal of Indonesian Tourism and Development Studies, 6(1): 55-62. https://jitode.ub.ac.id/index.php/jitode/article/view/244.
[70] Imani, G., Zapfack, L., Kalume, J., Riera, B., Cirimwami, L., Boyemba, F. (2016). Woody vegetation groups and diversity along the altitudinal gradient in mountain forest: Case study of Kahuzi-Biega National Park and its surroundings, RD Congo. Journal of Biodiversity and Environmental Sciences, 8(6): 134-150.
[71] Bogale Worku, B., Birhane Hizkias, E., Muhie Dawud, S. (2022). Diversity, structural, and regeneration analysis of woody species in the Afromontane dry forest of Harego, Northeastern Ethiopia. International Journal of Forestry Research, 2022(1): 7475999. https://doi.org/10.1155/2022/7475999
[72] Gheyret, G., Mohammat, A., Tang, Z.Y. (2020). Elevational patterns of temperature and humidity in the middle Tianshan Mountain area in Central Asia. Journal of Mountain Science, 17(2): 397-409. https://doi.org/10.1007/s11629-019-5481-0
[73] Ohdo, T., Takahashi, K. (2020). Plant species richness and community assembly along gradients of elevation and soil nitrogen availability. AoB Plants, 12(3): plaa014. https://doi.org/10.1093/aobpla/plaa014