Suhad Sh. Jaroo*![]() | Mohanad J. M-Ridha
| Mohanad J. M-Ridha![]()
© 2025 The authors. This article is published by IIETA and is licensed under the CC BY 4.0 license (http://creativecommons.org/licenses/by/4.0/).
OPEN ACCESS
This research investigates a novel microbial desalination cell (MDC) platform, referred to as the double anode-desalination photosynthesis microbial desalination cell (DADPMDC), which consists of five chambers instead of the conventional three: two anode chambers, two desalination chambers, and one cathode chamber. The study aimed to examine the impact of nutrient concentrations and salinity levels on the system's performance across three experimental tests. All experiments were conducted in batch mode, with a retention time of 9 days for the first two tests and 4 days for the third. The experimental results included power density (with an external resistance of 1000 Ω), desalination rates, chemical oxygen demand (COD) removal, nitrate and phosphate removal percentages, and algae cultivation performance. The results of experiments 1, 2, and 3, experiments, respectively, were: power densities were 78.0125, 61.25, and 35.1125 mW/m3, the desalination rates were 22, 8.75, and 1.82 ppm/hr, the COD removal percentages were 47, 92.2, and 77.67%, the nitrate removal percentages were 20.4, 22.3, and 18.9%, the phosphate removal percentages were 73.4, 86.3, and 57.63%, and the concentrations and dry weight of algae were 2.67, 3.78, 5.31 and 3.33, 4, 5.33 g/l, respectively. The new platform offers additional space for treating larger volumes of wastewater, which enhances the system’s power generation capacity. Simultaneously, it allows for increased desalination of saline water and utilizes light through algae cultivation to treat another type of wastewater.
microbial desalination cell, power generation, blue-green algae, organic/inorganic matter treatment, saline water desalination, nitrate and phosphate removal
Due to global urban water scarcity, desalination, and water reclamation have become essential and beneficial in numerous nations, including Iraq. Desalination and wastewater treatment processes are both energy-intensive and costly. Activated sludge, for instance, is one of the most widely used wastewater treatment techniques, characterized by high energy consumption as well as substantial capital and maintenance costs [1]. Moreover, conventional desalination methods are highly energy-intensive. Desalination systems are generally categorized into two main types: membrane-based processes (e.g., reverse osmosis), which are commercially established, and phase-change thermal processes, which are widely used [2]. Reverse osmosis is among the most efficient seawater desalination methods, requiring only 1.8–2.2 kWh/m³ of energy. In order to expand freshwater supplies, new and advanced water purification technologies must be developed at a reasonable cost for wastewater treatment and desalination [3, 4].
Nearly every contemporary economic sector that shapes communal life depends heavily on energy. According to the International Energy Agency (IEA), electricity demand is projected to triple within the coming years [5].
Microbial electrochemical technologies (METs) are emerging technologies that interact with electroactive microorganisms and electrodes [6]. In microbial fuel cells (MFCs), soluble organic matter can be directly converted into electricity [7]. The generated power (ranging from 0.001 to 19 W/m²) can be reused within the system to enhance organic matter degradation, support other energy-demanding electrochemical activities, or operate as a self-sustaining, decentralized unit [8].
In this microbial electrochemical context, the microbial desalination cell (MDC), which treats wastewater and desalinates seawater, might be viewed as combining an MFC and an electrodialysis (ED) cell. This technology propels the ion migration and desalination process by harnessing the energy generated by the oxidation of the wastewater's organic contents [9]. As a result, MDCs can desalinate saline water without external thermal or electrical input, thereby conserving energy for other applications. Therefore, MDCs have the potential to reduce greenhouse gas emissions and energy consumption compared to traditional methods. MDC's multiple and concurrent uses could make it a viable and practical alternative for wastewater treatment and desalination [10].
The standard MDC configuration comprises the anode, desalination, and cathode chambers. The anaerobic environment in the anode chamber facilitates the biodegradation of various types of wastewater through the oxidation of organic compounds. However, the use of clean electron acceptors as catholytes is now a difficulty in bioelectrochemical systems. Catholytes can exist in various forms. In the past, chemicals such as permanganate and ferricyanide were employed as catholytes. However, when employed as electron acceptors in large-scale applications, they are not sustainable and must be replaced due to their high cost and adverse environmental effects [10].
Oxygen, a widely available electron acceptor with high reduction potential, is commonly used as a terminal electron acceptor (TEA). Air cathodes utilize oxygen as the TEA; however, slow redox kinetics under ambient conditions limit their efficiency. In order to improve oxygen reduction efficiency, expensive catalysts such as platinum are often used alongside energy-intensive aeration systems to maintain optimal dissolved oxygen levels.
Several previous MDC designs incorporated air-exposed cathode chambers to improve oxygen availability and enhance power generation [11]. Thus, biocathodes are the active oxygen-producing techniques that may offer a long-term remedy for this problem. Biocathodes use microorganisms as biocatalysts rather than using noble or nonnoble catalysts to receive electrons. As a result, this cathode can be considered a more sustainable and cost-effective approach to bioelectrochemical systems [12]. This study focuses specifically on biocathode-based MDC systems. Additionally, biocathodes can serve as treatment reactors for specific contaminants in wastewater.
The challenge in this study is using additional chambers as additional anode and desalination chambers to improve the system's performance in wastewater treatment, power generation, and saline water desalination and using a sustainable kind of cathode (algal cathode).
Numerous researchers have examined the properties and operating parameters of biocathode MDC. For instance, research on biocathode Microbial Desalination Cells (PMDCs) for energy, biomass products, and water purification was conducted by Kokabian and Gude [13, 14]. The investigation validated the effectiveness of algal biocathodes for in situ oxygen generation. Algae offer an environmentally friendly way to remove COD from the cathode chamber and can act as an in-situ oxygen generator. Saba et al. [15] compared two distinct catholytes: (1) potassium ferricyanide and (2) the marine algae Nannochloropsis salina in order to investigate the power generation and desalination performance of microbial desalination cells (MDCs). Arana and Gude [16] looked at the function of an inorganic carbon source in the microalgae biocathode. The addition of sodium bicarbonate (NaHCO3) accelerated the pace of desalination, microalgae growth, and electricity generation [16]. In order to investigate the effects of process design and operation for biomass production, nutrient removal, power generation, water deionization, and wastewater treatment, Kokabian et al. [17] used three distinct process configurations of photosynthetic microbial desalination cells (PMDCs): static (fed-batch, SPMDC), continuous flow (CFPMDC), and a photo-bioreactor MDC (PBMDC). Jaroo et al. [1] examined three MDC operation modes (air cathode, chemical cathode, and biocathode MDC) to illustrate the system's functionality.
By creating a system with five cells (two anodes, two desalination cells, and one middle cell as the cathode), this study sought to examine the effects of nutrient concentration and saline water on system performance in a novel configuration of photosynthesis MDC. It documented the features and operating conditions provided by saltwater desalination, wastewater treatment, electrical power generation, phosphate and nitrate removal in the cathode chamber, and algae cultivation.
2.1 DADPMDC establish
The DADPMDC configuration consists of two anode cells, two desalinating cells, and a cathode cell in the middle of cylindrical plexiglass. The cylinder diameter was 12 cm with a wall thickness of 0.5 cm, and each cell's length was as follows: 10.5 cm for each anode, 6.5 cm for each desalinating cell, and 21 cm for the cathode cell, as described in Figure 1(A). The active volumes for the cells were as follows: 2000 ml of cathode, 1000 ml of each anode, and 650 ml of each desalinating cell. Anion exchange membranes (AEM, AMI 7001) and cation exchange membranes (CEM, CMI 7000), two varieties of ion-exchange membranes provided by Membrane International Ltd., were employed. The AEM disconnected the anode and desalination chambers, and the CEM detached the cathode and desalination chambers. As advised by the supplier, the membranes were preconditioned for 24 hours before use by being flooded in a 5% salt (NaCl) solution and then swilled with deionized water to permit membrane hydration and expansion. Eight electrodes, four anodes, and four cathodes make up the system, and the anode and cathode were constructed from graphite rods, each measuring 1.5 cm in diameter and 8 cm in length. One centimeter separated each electrode from the nearby membrane. The external resistance was connected to the electrodes using copper filaments with sealed contact.
Figure 1. (A) Graphic representation of the DADPMDC and (B) The DADPMDC
All of the chambers had 1 cm inlet and outlet side ports and 1 cm sampling top ports, with the exception of the cathode chamber, which has a 3 cm sampling top port that can be used with a dissolved oxygen (DO) meter. The anode chambers were sealed off from the surrounding air to achieve the necessary anaerobic conditions. This is the DADPMDC of (Figure 1(B)).
2.2 Supplies and techniques
This study investigated the DADPMDC in three experiments: experiments 1, 2, and 3, for 9, 9, and 4 days, respectively, and in batch flow operation mode. Different concentrations of nutrients in anolyte and catholyte and different concentrations of salt water were utilized in every experiment. The subsequent section outlines the specifics of all items utilized in this investigation.
2.2.1 Microbial cultivation
The activated sludge was taken from the wastewater treatment basin of the first gas power plant in southern Baghdad city-Iraq [18] and was used as the microbial culture to seed the anode chamber; it was adapted in the anode chamber was maintained under anaerobic conditions for 10 days before the commencement of tests to facilitate the formation of a biofilm layer on the electrode. The microbial culture consists of two main types of bacteria, Bacillus and E. coli. There were five types of Bacillus (Bacillus pumilus, brevis, subtilis, licheniformis, coagulans).
2.2.2 Anolyte solution
Synthetic wastewater was utilized in the anode chamber with sodium acetate concentrations of 1500, 750, and 150 mg/l for experiments 1, 2, and 3, respectively, along with a buffer solution to maintain the pH of the anode chamber; the components are detailed in Table 1 [10]. A buffer solution includes ten milliliters of trace mineral solution [19]; the components are detailed in Table 1. These solutions were prepared by dissolving substances in one liter of deionized water.
Table 1. The components of the buffer solution and the trace mineral solution are located in the anode chambers [10]
|
Buffer Solution |
Trace Mineral Solution |
||
|
Material |
Con. mg/L |
Material |
Con. mg/L |
|
K2HPO4.3H2O |
20 |
CaCl2.6H2O |
150 |
|
KH2PO4 |
20 |
H3BO3 |
150 |
|
NH4Cl |
200 |
CuSO4.5H2O |
30 |
|
CaCl2.2H2O |
40 |
ZnSO4.7H2O |
120 |
|
MgCl2.H2O |
40 |
FeCl3.6H2O |
1500 |
|
KCl |
40 |
KI |
3 |
2.2.3 Saline water solution
The saline water solution was prepared by dissolving 25, 13, and 3 g/L of NaCl in DI water for experiments 1, 2, 3, respectively, to investigate the system salt removal performance with different salt concentrations.
2.2.4 Algal culture
The blue-green (chroococcus) algae were utilized as microalgae culture in this study, with 200 mL as the concentration of microalgae culture in the catholyte solution. It was isolated from the Al-dora refinery in Baghdad city.
2.2.5 Catholyte solution
BG11 solution was the growth medium of algae, and its components with trace mineral solution are listed in Table 2 [1]. The growth medium was formulated by dissolving substances in 1 liter of deionized water, incorporating 1 milliliter of trace mineral solution. An inorganic carbon source was essential for advancing the photosynthetic activity of algae and thus enhancing oxygen production; thus, 0.5 g/L of NaHCO3 was incorporated into the catholyte in this operational mode [16]. A white light electrical lamp (23W) illuminated algae in the biocathode section to provide light intensity ranging between 2700 and 3000 lux. This illumination is essential for the completion of the algal photosynthetic process and the synthesis of oxygen.
Table 2. The components of the algal growth media, including the trace mineral solution [1]
|
Buffer Solution |
Trace Mineral Solution |
||
|
Material |
Con. mg/L |
Material |
Con. mg/L |
|
NaNO3 |
1500 |
H3BO3 |
2860 |
|
K2HPO4.3H2O |
40 |
MnCl2.4H2O |
1810 |
|
Citric acid |
6 |
ZnSO4.7H2O |
222 |
|
CaCl2.2H2O |
36 |
NaMoO4.2H2O |
390 |
|
MgSO4 |
75 |
CuSO4.5H2O |
79 |
|
Na2CO3 |
200 |
Co(NO3)2.6H2O |
49.4 |
|
Ferric ammonium citrate |
6 |
|
|
|
EDTA |
1 |
|
|
2.3 Analyses and calculations
A digital multimeter (Aswar, DT860D) was employed to measure the voltage with a 1000 Ω external resistance during closed circuit testing connecting the anode and cathode. Ohm's law defines the electric current as I = E/R, where E represents voltage and R denotes external resistance. The power density was analyzed in relation to the volume of the anodes, P = E*I/V [20, 21]. The coulombic efficiency (CE), representing the fraction of electrons retrieved as an electric current from the substrate, was calculated using Eq. (1) [22]:
CE=M⋅∫t0Idtn⋅F⋅Va⋅(COD0−CODt)×100 (1)
where, M represents the molecular weight of oxygen, I denotes the electric current, F signifies Faraday's constant, n= 4 indicates the number of electrons exchanged per mole of oxygen, and Va refers to the volume of the anolyte. COD0 seems to affect the anolyte's chemical oxygen demand, while CODt represents the COD value after time (t).
The MDC was operated to achieve a steady state. The polarization curves were established using varying external resistance from 10 kΩ to 100 Ω in increments, allowing around 15 minutes between each step to achieve a steady state while employing the electrode surface area to calculate power density and current density. The COD was assessed using a standardized approach [23]. The multimeter (Lovi Bond Senso Direct 150) was used to measure the samples' total dissolved solids (TDS), Electrical conductivity, DO in the cathode chamber, and pH. The salinity removal rate for each cm2 of the membranes was computed as follows:
Salinity removal rate (ppm/h.cm2)=(C0−Ctt⋅a) (2)
where, C0 and Ct represent saltwater's starting and final total dissolved solids (TDS) in the desalination chamber throughout a batch cycle of duration t, while a denotes the membrane's surface area.
The efficacy of algae in treating nitrate and phosphate was assessed by spectrophotometric analysis, wherein the spectrophotometer measured algal growth to evaluate sample absorption, utilizing the data to estimate algal concentration via Eq. (3) [24, 25]:
Microalgae con. = absorbance at wavelength 620 nm0.8702 (3)
3.1 Generation of electrical power
Figure 2 depicts the three tests' voltage and power density results across various scenarios. The three chambers were supplied with the solutions at the commencement of each experiment, as indicated in section 2.2. The two figures indicate the maximum voltage difference between the electrodes in the anode and cathode chambers, with a constant external electrical resistance of 1000 Ω (the lift y-axis represents the results of the 1,2 experiments, and the right y-axis represents the results of experiment 3), was 395 mV, 350 mV, and 265 mV for experiments 1, 2, and 3, respectively, over 9 days for experiments 1 and 2 and 4 days for experiment 3. The greatest power density was 78.0125, 61.25, and 35.1125 mW/m³ for the identical experimental arrangement. The voltage and power density numbers first increased over time until their peak value was attained. Subsequently, the values diminished with time as a result of substrate depletion in the anode chamber.
Figure 2. (A) The voltage values vs. time, (B) The power density values vs time for the three experiments
The contrast of voltage and power density values is noticeable, resulting from the difference in the nutrient amounts in the anode chambers and the saltwater concentration in the desalination chambers. The nutrient amount affects the bacteria's activity and power-generation ability; on the other hand, the anolyte conductivity increases when the saline water concentration increases, which has a positive effect on the power-generation ability of the system.
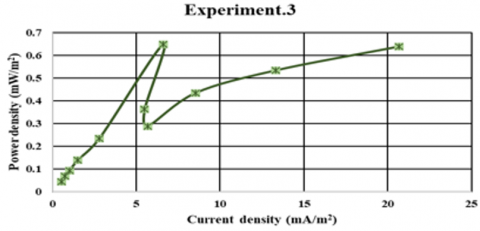
Upon achieving steady-state functioning for each experiment, the polarization curve was constructed as described in section 2.3, as depicted in Figure 3. Conversely, the voltage levels in relation to multi-resistance for the three tests are illustrated in Figure 4. The maximum power density values recorded were 1.67, 0.91, and 0.64 mW/m² for tests 1, 2, and 3, respectively.
Figure 3. The voltage measurements are related to multi-resistance over the three trials
Figure 4. The polarization curves for the three experiments
3.2 Salinity removal efficiency
The salt removal percentage for the three experiments of DADPMDC is illustrated in Figure 5. While the system has two desalination chambers, it is noticeable that the desalinating ability for the two chambers is close for the first and second experiments. Conversely, this ability differed between the two chambers in the third experiment due to the difference in the fouling and scaling thickness on the membranes.
Figure 5. The TDS removal percentage of the DADPMDC for the three experiments
Table 3 shows more details about the desalination performance of the system. The desalination removal ability of the system is improving with the increase of saline water concentration due to improving ion exchangeability between the desalination and anode/ cathode chambers. Hence, the highest removal percentage value was 19.3%, and the salinity removal rate was 22 ppm/hr, with the highest initial saltwater concentration of 25 g/l. The salinity removal in this study was lower than in other studies because the surface area of membranes was the smallest. The surface area of the membranes plays a vital role in the desalination process due to its impact on the ion exchangeability of the membranes.
The pH variations for the solutions in all chambers are displayed in Figure 6. The variations in the pH levels of the anolyte and saline water across all trials were minimal due to the influence of the buffer solution in the anode chamber. In contrast, the catholyte in all experiments became highly alkaline with time due to the desalinating process, and the catholyte was without buffer solution in all cases.
Figure 6. The changes in pH values for the three experiment
Table 3. The desalination process details
|
|
Desalination Effeciancy (The Average of Two Cells) |
Anolyte Conductivity (ms/cm) |
Catholyte Conductivity (ms/cm) |
||||
|
Salinity removal % |
Salinity removal rate (ppm/hr) |
Salinity removal rate (ppm/hr.cm2 of membrane) |
Initial |
Final |
Initial |
Final |
|
|
Exp.1 |
19.3 |
22 |
0.2605 |
2.368 |
3.43 |
2.56 |
3.87 |
|
Exp.2 |
14.825 |
8.75 |
0.104 |
1.45 |
1.94 |
1.756 |
2.47 |
|
Exp.3 |
6.07 |
1.82 |
0.0215 |
1.15 |
1.322 |
1.12 |
1.462 |
3.3 COD removal efficiency
Figure 7 illustrates the COD elimination % of the DADPMDC across the three experiments for both anodes; they were average values of 47%, 92.2%, and 77.67% for the first, second, and third experiments, respectively. The nutrient concentration in the wastewater and the retention time affect the bacteria's treatment ability. That effect is evident when comparing the results of the first and second experiments. The highest percentage was for the second one, which had the same duration as the first one. However, the concentration of the nutrients was half the value of the first experiment, and the capacity of microorganisms to decompose organic materials was established. This study demonstrates superior efficiency in COD elimination compared to earlier studies. The COD elimination reported in the research by Kokabian and Gude [13] was 65.6%; however, the figure was 82.17% in their subsequent study in 2015 [14]. Nonetheless, it is inferior to the study ratio of Suhad 2021 [1], which was 96.94%, and is contingent upon the type of bacteria and their degrading capacity.
Figure 7. The COD elimination efficiency of the DADPMDC across the three experiments.
Figure 8 depicts the coulombic efficiency results from the three experiments for the two anodes. The mean CE values were 6.431%, 5.46%, and 5.21% for the first, second, and third experiments. The one had the highest CE value due to the highest value of nutrients in the anode chambers.
Figure 8. Coulombic efficiency (CE) percentages of the DADPMDC in the three experiments
3.4 Nitrate and phosphate removal efficiency
The algae's ability to remove nitrate and phosphate is highlighted in this study, which discusses the possibility of using the system to treat nitrate-phosphate wastewater (for example, from textile, dairy, and fertilizer industries) in the cathode chamber via algae. Their percentage removal is shown in Figure 9; it is clear that the algae's ability to treat phosphate is greater than its nitrate-treating ability because the initial concentration of the two materials was different. The phosphate concentration was very low compared to the nitrate concentration; the highest phosphate concentration was 7.89 ppm, while the highest nitrate concentration was 59.8 ppm. Thus, the phosphate treatment was more efficient; algae is a good way to treat nitrate and phosphate.
Figure 9. Nitrate and phosphate removal percentages of the DADPMDC in the three experiments
From the Figure below, the highest removal value of phosphate was 86.3%, and nitrate was 22.3% in the 2nd experiment due to the algae cultivation improvement compared to the 1st experiment. The third one had the lowest removal values due to the lowest duration time.
Figure 10. The dry weight of algae of the DADPMDC in the three experiments
Figure 11. The concentration values of blue-green algae with DO concentration values of the DADPMDC in the three experiments
The cultivation of algae in the three experiments is illustrated in Figures 10 and 11. It is clear that the concentration of algae improved during the three experiments' operation time, and in the same way, the dry weight of algae (which resulted from the catholyte discharged as waste) improved, too.
It is noticeable that the highest values were in the 3rd experiment, with 5.31 as the algae concentration and 5.33 g/l as the algae dry weight. The waste algae can benefit biofuel, providing a sustainable way to use the wastewater from the cathode chamber. Figure 11 also shows the dissolved oxygen values of the three experiments. By comparing the values of the first and second experiments, the 2nd experiment had the best DO due to increased algae cultivation.
3.5 SEM analysis results of membranes
SEM analysis is necessary to clarify the effect of treatment and desalination processing on the two types of membranes (AEM and CEM). Figure 12 shows the surfaces of the two membranes before use without contaminants.
Figure 12. The original surfaces of membranes before use
Figure 13. The surfaces of membranes from the side of the desalinating chambers
That changed in Figures 13 and 14, where it is noticeable that the accumulations of salt crystals on the surfaces of the membranes from the side of the desalinating chambers. At the same time, the biofilm of bacteria and algae formed on the surfaces of the membranes from the side of the anode and cathode chambers, respectively. The accumulations on the membranes affect the system's performance in desalinating saline water by decreasing the membrane's ion exchangeability and power generation process by increasing the internal resistance of the system.
Figure 14. (A) The surface of the anion exchange membrane adjacent to the anode chambers contains bacterial colonies; (B) The surface of the cation exchange membrane adjacent to the cathode chambers exhibits algal accumulation
This study examined the new MDC configuration by making two chambers as anode and two chambers as desalination instead of one for both. The new configuration helps to improve power generation by increasing the anode number and the desalinating water quantity by increasing the number of desalination chambers for the system. This study focused on the effect of nutrient and saltwater concentration on the system performance in three experiments by examining power generation, COD removal, and TDS removal in addition to examining the blue-green algae's ability to remove nitrate and phosphate from wastewater in the cathode chamber and monitoring the algae cultivation and the concentration of waste algae to use it as biofuel. The maximum result values were: power density of 78.0125 mW/m³, desalination rate of 22 ppm/hr, and COD elimination percentage of 92.2%. The nitrate removal percentage was 22.3%, the phosphate removal percentage was 86.3%, and the concentration and dry weight of algae were 5.31 and 5.33 g/L, respectively. It is worth noting that this MDC form is better than the traditional form but needs to increase the membrane area to increase the desalination performance.
We gratefully acknowledge the Department of Environmental Engineering, University of Baghdad, College of Engineering, for their assistance in laboratory work.
[1] Jaroo, S.Sh., Jumaah, Gh.F., Abbas, T.R. (2021). The catholyte effects on the microbial desalination cell performance of desalination and power generation. Journal of Engineering, 7(27): 53-65. https://doi.org/10.31026/j.eng.2021.07.05
[2] Abd-almohi, H.H., Alismaeel, Z.T., M-Ridha, M.J. (2022). Broad-ranging review: Configurations, membrane types, governing equations, and influencing factors on microbial desalination cell technology. Journal of Chemical Technology & Biotechnology, 97(12): 3241-3270. https://doi.org/10.1002/jctb.7176
[3] Gude, V.G. (2017). Desalination and water reuse to address global water scarcity. Reviews in Environmental Science and Bio/Technology, 16: 591-609. https://doi.org/10.1007/s11157-017-9449-7
[4] Gude, V.G. (2018). Desalination of deep groundwater aquifers for freshwater-Challenges and strategies. Groundwater for Sustainable Development, 6: 87-92. https://doi.org/10.1016/j.gsd.2017.11.002
[5] Ali, Q.A., Alhares, H.S., Abd-almohi, H.H., M-Ridha, M.J., Mohammed, S.J., Jabbare, Z.H. (2023). Enhancing microbial desalination cell Performance for water desalination and wastewater treatment: Experimental study and modeling of electrical energy production in open and closed-circuit modes. Journal of Chemical Technology & Biotechnology, 99(1): 294-306. https://doi.org/10.1002/jctb.7538
[6] Schröder, U., Harnisch, F., Angenent, L.T. (2015). Microbial electrochemistry and technology: Terminology and classification. Energy Environmental Science, 8: 513-519. https://doi.org/10.1039/C4EE03359K
[7] Borjas, Z., Ortiz, J.M., Aldaz., A., Feliu, J., Esteve-Núñez, A. (2015). Strategies for reducing the start-up operation of microbial electrochemical treatments of urban wastewater Energies, 8(12): 14064-14077. https://doi.org/10.3390/en81212416
[8] Logan, B.E., Wallack, M.J., Kim, K.-Y. He, W., Feng, Y., Saikaly, P.E. (2015). Assessment of microbial fuel cell configurations and power densities. Environmental Science Technology Letters, 2(8): 206-214. https://doi.org/10.1021/acs.estlett.5b00180
[9] Salman, H.H., Ismail, Z.Z. (2020). Desalination of actual wetland saline water associated with biotreatment of real sewage and bioenergy production in microbial desalination cell. Separation and Purification Technology, 250: 117110. https://doi.org/10.1016/j.seppur.2020.117110
[10] Cao, X., Huang, X., Liang, P., Xiao, K., Zhou, Y., Zhang, X., Logan, B.E. (2009). A new method for water desalination using microbial desalination cells. Environmental Science Technology, 43(18): 7148-7152. https://doi.org/10.1021/es901950j
[11] Werner, C.M., Logan B.E., Saikaly, P.E., Amy, G.L. (2013). Wastewater treatment, energy recovery, and desalination using a forward osmosis membrane in an air-cathode microbial osmotic fuel cell. Journal of Membrane Science, 428: 116-122. https://doi.org/10.1016/j.memsci.2012.10.031
[12] Huang, L., Regan, J.M., Quan, X. (2011). Electron transfer mechanisms, new applications, and performance of biocathode microbial fuel cells. Bioresource Technology, 102: 316-323. https://doi.org/10.1016/j.biortech.2010.06.096
[13] Kokabian, B., Gude, V.G. (2013). Photosynthetic microbial desalination cells (PMDCs) for clean energy, water, and biomass production. Environmental Science Processes & Impact, 15: 2178-2185. https://doi.org/10.1039/C3EM00415E
[14] Kokabian, B., Gude, V.G. (2015). Sustainable photosynthetic biocathode in microbial desalination cells. Chemical Engineering Journal, 262: 958-965. https://doi.org/10.1016/j.cej.2014.10.048
[15] Saba, B., Christy, A.D., Yu, Z.T., Co, A.C., Park, T. (2016). Simultaneous power generation and desalination of microbial desalination cells using nannochloropsis salina (Marine Algae) versus potassium ferricyanide as catholytes. Environmental Engineering Science, 34(3): 185-196. https://doi.org/10.1089/ees.2016.0291
[16] Arana, T.J., Gude, V.G. (2018). A microbial desalination process with microalgae biocathode using sodium bicarbonate as an inorganic carbon source. International Biodeterioration & Biodegradation, 130: 91-97. https://doi.org/10.1016/j.ibiod.2018.04.003
[17] Kokabian, B., Ghimire, U., Gude, V.G. (2018). Water deionization with renewable energy production in microalgae - microbial desalination process. Renewable Energy, 122: 354-361. https://doi.org/10.1016/j.renene.2018.01.061
[18] Abd-almohi, H.H., Alismaeel, Z.T., M-Ridha, M.J. (2022). Study of microbial desalination cell performance; power generation and desalination efficiency using pure oxygen in a cathode chamber. Al-Khwarizmi Engineering Journal, 18(3): 37-47. https://doi.org/10.22153/kej.2022.07.002
[19] Srivastava, P., Yadav, A.K., Mishra, B.K. (2015). The effects of microbial fuel cell integration into a constructed wetland on the performance of constructed wetland. Bioresource Technology, 195: 223-230. https://doi.org/10.1016/j.biortech.2015.05.072
[20] Ismail, Z.Z., Jaeel, A.J. (2013). Simultaneous electricity production and wastewater treatment in a microbial fuel cell inoculeted with anaerobic sludge. Journal of Engineering, 19(8): 1031-1038. https://doi.org/10.31026/j.eng.2013.08.08
[21] Ismail, Z.Z., Radeef, A.Y. (2020). The effect of total suspended solids on the electricity generation in microbial fuel cell treating actual potato chips processing wastewater. Journal of Engineering, 26(1): 55-62. https://doi.org/10.31026/j.eng.2020.01.06
[22] Logan, B.E., Hamelers, B., Rozendal, R., Schrorder, U., Keller, J., Freguia, S., Aelterman, P., Verstraete., W., Rabaey, K. (2006). Microbial fuel cells: Methodology and technology. Environmental Science Technology, 40(17): 5181-5192. https://doi.org/10.1021/es0605016
[23] Zhang, X.Y., He, W.H., Ren, L.J., Stager, J., Evans, P.J., Logan, B.E. (2015). COD removal characteristics in the air-cathode microbial fuel cell. Bioresource Technology, 176: 23-31. https://doi.org/10.1016/j.biortech.2014.11.001
[24] Sadeq, A.M., Ismail, Z.Z. (2023). Sustainable application of tubular photosynthesis microbial desalination cell for simultaneous desalination of seawater for potable water supply associated with sewage treatment and energy recovery. Science of the Total Environment, 875: 162630. https://doi.org/10.1016/j.scitotenv.2023.162630
[25] Sadeq, A.M., Ismail, Z.Z. (2024). Microalgae growth in a biocathode-photosynthesis microbial desalination cell: Molecular characterization, modeling study, and performance evaluation. Iraqi Journal of Chemical and Petroleum Engineering, 25(1): 1-12. https://doi.org/10.31699/IJCPE.2024.1.1