Muhammad Aji Cahyadi![]() | Parjanto
| Parjanto![]() | Ahmad Yunus*
| Ahmad Yunus*![]()
© 2025 The authors. This article is published by IIETA and is licensed under the CC BY 4.0 license (http://creativecommons.org/licenses/by/4.0/).
OPEN ACCESS
Bacterial leaf blight, caused by Xanthomonas oryzae pv. oryzae (Xoo), is a major disease that significantly reduces rice yields. A local variety of Central Java, Mentik Wangi, has several unique characteristics that are favored by consumers, such as a soft texture and a distinctive fragrant aroma. Despite its advantages, Mentik Wangi is susceptible to bacterial leaf blight because Xoo targets the susceptibility gene OsSWEET11. CRISPR/Cas9 technology can induce resistance by mutating the gene's promoter, preventing its recognition by Xoo. This study aimed to observe the phenotypic traits of T1 mutant lines of Mentik Wangi rice edited using CRISPR/Cas9. T1 seeds derived from T0 parents were analyzed for agronomic traits, including plant height, tiller number, flowering time, and grain weight. Dunnett's test showed no significant differences between mutant lines and their wild-type parents, suggesting no pleiotropic effects from the OsSWEET11 mutation. These results indicate that mutating susceptibility genes can be a viable approach for developing bacterial leaf blight-tolerant rice without compromising agronomic performance. However, molecular analyses are needed to confirm the inheritance of mutations and correlate them with agronomic traits in the T1 generation. This study demonstrates the potential of CRISPR/Cas9 technology in breeding disease-resistant rice varieties.
agronomic performance evaluation, bacterial leaf blight, CRISPR/Cas9, local plasma Nutfah, Mentik Wangi, OsSWEET11, resistance breeding
There are various rice varieties, including Mentik Wangi, an elite variety from Central Java. This type of rice has a unique aroma and produces soft-textured rice [1]. However, Mentik Wangi is a local variety that is vulnerable to bacterial leaf blight. Bacterial leaf blight initially appears as spots on the leaves, which later expand, causing the leaves to turn pale yellow [2, 3]. Bacterial leaf blight is a plant disease that causes significant losses. It affects rice plants and is caused by the gram-negative bacterium Xanthomonas oryzae pv. oryzae (Xoo), which typically infects through wounds and/or hydathodes, moves and colonizes the xylem vessels of the leaves and creates grey to white lesions along the leaf vessels [4]. In Indonesia, yield losses due to bacterial leaf blight are also influenced by weather conditions, with losses reaching 21-36% during the rainy season and ranging between 18% and 28% during the dry season [5]. Globally, yield losses from bacterial leaf blight can reach up to 50% [6]. This indicates that bacterial leaf blight not only affects specific countries but is also a global concern.
The bacterium Xanthomonas oryzae pv. oryzae (Xoo) secretes Transcription Activator-Like (TAL) effectors, which specifically target the Effector Binding Element (EBE) in the promoter region of the dominant Xa13 gene (also known as Os8N3 or OsSWEET11), leading to the coding of the Xa13 protein. This protein facilitates sugar efflux (transporting sugars from inside the cell to the apoplast), which Xoo utilizes as a food source. Additionally, the Xa13 protein interacts with the COPT1 and COPT5 proteins, which are involved in redistributing the Cu mineral from xylem tissues. Copper is crucial for plant resistance to Xoo, and this redistribution allows the pathogen to freely colonize the xylem tissues of rice plants and cause disease [7].
Mutations in the recessive OsSWEET11 and OsSWEET14 genes, particularly in the EBE region of their promoters, prevent the TAL effectors from hijacking the expression of these genes. As a result, the sugar transporter proteins are not produced, preventing sugar efflux and depriving the Xoo pathogen of the nutrients it needs from its host plant. The recessive OsSWEET11 gene (Xa13) also prevents copper redistribution and maintains copper levels in the xylem vessels, inhibiting Xoo growth and providing resistance to Xanthomonas oryzae pv. oryzae (Xoo) [7-9].
To obtain OsSWEET11 and OsSWEET14 genes with mutations in their promoter EBEs, Xu et al. [10] used CRISPR/Cas9 technology on the Kitaake rice variety to induce mutations in the PthXo1-EBE region of the OsSWEET11 promoter and the PthXo3-EBE region of the OsSWEET14 promoter. Based on sequencing data, they successfully obtained four T2 homozygous lines, one of which, MS14K, showed a five-nucleotide homozygous mutation in both the PthXo1-EBE and PthXo3-EBE regions.
The use of CRISPR/Cas9 to induce disease resistance has also been widely explored in previous studies. For example, CRISPR/Cas9 was utilized to edit three susceptibility genes, SWEET11, SWEET13, and SWEET14, in two major rice varieties, Ciherang and IR64, resulting in nine Xoo-resistant lines [11]. Another study by Huang et al. [12] induced mutations in rice susceptibility genes against the nematode Meloidogyne graminicola, successfully obtaining two transgene-free mutant lines and five mutant lines containing transgenic elements, all of which exhibited higher resistance to M. graminicola compared to their wild-type parent. Additionally, Yang et al. [13] targeted two susceptibility genes, Pi21 and OsSULTR3;6. A single Pi21 mutant showed increased susceptibility to blast disease during both the tillering and reproductive phases. Furthermore, a single homozygous OsSULTR3;6 mutant line, when inoculated with Xanthomonas oryzae pv. oryzicola (Xoc), exhibited a disease lesion length 75% shorter than the wild type. These various studies demonstrate that CRISPR/Cas9 is a reliable method for inducing mutations in susceptibility genes, thereby conferring passive resistance to pathogens.
Class III SWEET protein family members are also involved in various biological processes, such as pollen and seed development [14]. Inactivating these genes has been shown to cause detrimental pleiotropic effects, such as reduced endosperm development and seed filling in Kitaake OsSWEET11 and OsSWEET11- OsSWEET15 mutants [15]. Moreover, RNA-mediated gene silencing of OsSWEET14 or OsSWEET11 in Kitaake bacterial leaf blight-resistant lines negatively impacted seed [16, 17]. However, reported reductions in yield and quality are not universal occurrences. Duy et al. [18] found no significant differences in agronomic performance among three CRISPR/Cas9-induced OsSWEET14 homozygous mutant lines compared to their wild-type parents, indicating that limited promoter region modifications did not affect the normal expression of the OsSWEET14 gene.
Given these findings, evaluating the agronomic performance, particularly yield-related components, of SWEET mutant lines in subsequent generations is crucial. Several studies have previously conducted agronomic performance evaluations on individuals within mutant lines. For instance, Duy et al. [18] evaluated the agronomic performance of the mutant line OsSWEET14 to determine whether mutations in the OsSWEET14 promoter affect the agronomic traits of rice. In this study, Duy et al. [18] edited the OsSWEET14 gene in the Vietnamese rice variety TRB225 and evaluated its agronomic performance under greenhouse conditions. Similarly, Achary and Reddy [19] conducted an agronomic performance evaluation of mutant wheat GW2-KO under field conditions, comparing various vegetative variables and yield components between the mutant wheat and its wild type.
Rifhani et al. [20] have constructed a CRISPR/Cas9-gRNA construct targeting the OsSWEET11 promoters in Mentik Wangi rice and successfully transformed the rice with this construct. This research yielded 129 putative T0 mutant Mentik Wangi plants. Rifhani et al. [20] also conducted molecular analysis on T0 generation plants and revealed that there were four lines confirmed to have mutations in the OsSWEET11 gene. To test the effect of promoter mutations in OsSWEET11 in the T1 generation on agronomic performance, all T0 transgenic mutants were self-pollinated to produce T1 seeds. This study aims to evaluate the impact of editing the OSSWEET11 gene through CRISPR/Cas9 technology on the agronomic traits of the T1 generation of the Mentik Wangi variety, and explore whether the mutation will cause negative phenotypic changes. It is hypothesized that the mutation will have no significant effect on agronomic performance, providing a promising outlook for further development.
2.1 Study location and variables observed
This study was conducted in the greenhouse of the Faculty of Agriculture, Universitas Sebelas Maret, Surakarta, at an altitude of 96 meters above sea level (masl) with an astronomical location of 7° 33' 39.5" S and 110° 51' 31.4" E. The research took place from February to August 2024. The seeds used in this study were T1 generation rice seeds, resulting from a study by Rifhani et al. [20]. These seeds were obtained through genome editing using the CRISPR/Cas9 method on the Mentik Wangi rice variety. The mutant lines obtained were selected based on the presence of mutations in the OsSWEET11 gene in the T0 generation. Four mutant lines were successfully selected: line 85, line 88, line 113, and line 121. This study was designed as a simple experiment to compare dependent variables obtained from the mutant lines with their wild-type parent. Data were analyzed using ANOVA, followed by Dunnett's test to compare the wild-type parent with each mutant line. The observed variables included plant height, number of tillers, flowering time, total number of grains per clump, total number of filled grains per clump, grain weight per clump, and percentage of unfilled grains per clump. The selection of vegetative variables, such as plant height, in this study is based on the research by Liu et al. [21], which revealed that the expression of sugar transporter genes also affects plant phenotypes, such as height and flowering time. Similarly, Zhang et al. [22] demonstrated that the expression of a sugar transporter protein-coding gene influences the tillering response in rice. Therefore, in this study, where we observe the impact of mutations in OsSWEET11, a sugar transporter protein-coding gene, on the agronomic performance of plants, it is necessary to evaluate the aforementioned variables, which are important agronomic traits for rice growth and are closely related to breeding goals.
2.2 Research implementation and plant management
The rice seeds were soaked for 24 hours, drained, wrapped in tissue, and incubated until the seeds developed radicles. The seeds with radicles were then planted in seedling trays. The seedlings were sown in trays containing soil, with four mutant Mentik Wangi lines to be sown. Each line was sown in a separate group in the same tray, resulting in 4 seedling trays for the four mutant lines. After 18 days, the seedlings were ready to be transplanted into research buckets. The rice plants were planted in buckets filled with soil that had been chemically sterilized. Each bucket contained one rice seedling. For each line, 25 plants were grown, so for the four lines, a total of 100 individual plants were grown, all of which served as samples for this study. The rice plants were watered periodically, about every 2-3 days, and their growth stages were monitored to collect data based on predetermined variables. Fertilization was carried out according to the recommended dosage from Kurniadie’s [23] study, with an NPK dosage of 300 kg/hectare and a ZA fertilizer dosage of 333 kg/hectare, which was then converted to calculate the fertilizer dose for one bucket with 6 kg of soil per bucket. The NPK fertilizer was applied twice: half at planting and the other half when the plants were 3 weeks old. Meanwhile, the ZA fertilizer was applied all at once during planting [23].
2.3 PCR analysis of transgenic element in T1 generation
The Cas9 gene detection used a total reaction mixture of 10 µl, consisting of 5 µl Kappa 2G Polymerase, 0.3 µl forward Cas9 primer (5 µM), 0.3 µl reverse Cas9 primer (5 µM), 1 µl template (isolated DNA from Mentik Wangi T1 rice), and 3.4 µl NFW. The PCR program used for detecting the Cas9 gene consists of 35 cycles, as follows: pre-denaturation at 95°C for 10 minutes, denaturation at 95℃ for 30 seconds, annealing at 55℃ for 30 seconds, elongation at 72℃ for 45 seconds, and final elongation at 72℃ for 5 minutes. The PCR products are subjected to electrophoresis and then visualized using a gel documentation system. Samples positive for the Cas9 gene are identified by the presence of an amplicon with a size of 444 bp.
3.1 Height
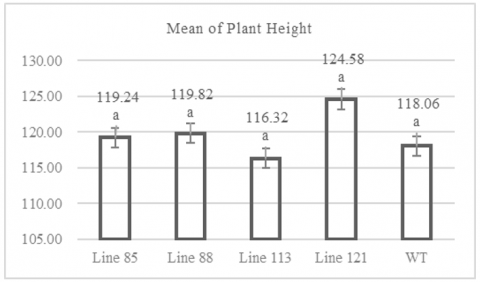
The ANOVA results of all variables showed that there were significant differences between the tested strains as shown in Table 1, we then conducted a further Dunnett test to confirm the accuracy of the ANOVA test results. The CRISPR/Cas9-based mutations produced rice plants with an average medium height ranging from 116 to 124 cm. Figure 1 shows that MW 113 mutant line population have an average height of 116.32 cm, while the MW 121 mutant line population have an average height of 124.58 cm. Figure 1 also indicates that the wild-type plants had an average height of 118.06 cm. The shortest individual plant was found in the MW 113 line with a height of 98 cm, while the tallest individual was in the MW 121 line with a height of 133 cm (Table A1). Statistical analysis using Dunnett's test showed that the plant height data of the mutant lines, when compared to the wild-type plants as a control, did not differ significantly, with a significance value of >0.05.
Figure 1. Graph of plant height
Numbers followed by the same letter indicate results that are not significantly different according to the Dunnet test at p> 0.05.
Table 1. ANOVA test of quantitative variables
|
Variable |
df1 |
df2 |
F Value |
α =5% |
|
|
F Table |
Significance |
||||
|
PH |
4 |
103 |
4.631 |
2.46 |
* |
|
NT |
4 |
103 |
9.624 |
2.46 |
* |
|
FT |
4 |
103 |
4.211 |
2.46 |
* |
|
NG |
4 |
104 |
11.537 |
2.46 |
* |
|
NFG |
4 |
104 |
15.046 |
2.46 |
* |
|
WG |
4 |
103 |
18.227 |
2.46 |
* |
|
PUG |
4 |
104 |
11.968 |
2.46 |
* |
Note: PH: Plant Height, NT: Number of Tillers, FT: Flowering time, NG: Number of Grains per clump, NFG: Number of Filled Grains per clump, WG: Weight of Grains per clump, PUG: Percentage of Unfilled Grains per clump.
3.2 Number of tillers
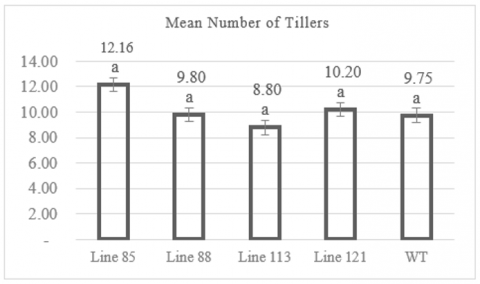
The observation of the number of tillers showed that the mutant rice lines produced an average range of 8.8 to 12.16 tillers. Figure 2 indicates that MW 113 mutant line population have an average of 8.8 tillers. On the other hand, the highest number of tillers was observed in the MW 85 mutant line population, with an average of 12.16 tillers. Figure 2 also shows that wild-type plants had an average of 9.75 tillers. The individual plant with the fewest tillers was found in the MW 113 line with 5 tillers, while the individual with the most tillers was in the MW 85 line with 18 tillers (Table A1). Data analysis using Dunnett's test method revealed that the average number of tillers in the mutant lines did not differ significantly from the control population (wild-type), with a significance value of >0.05.
Figure 2. Graph of number of tillers
Numbers followed by the same letter indicate results that are not significantly different according to the Dunnet test at p> 0.05.
3.3 Flowering time
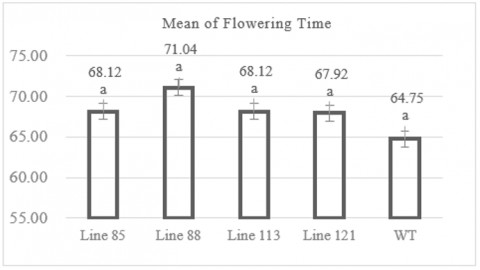
The observation of flowering time in the Mentik Wangi mutant rice lines showed that the flowering time across the four mutant line populations ranged between 68.12 to 71.04 days after planting (DAP) in average. The shortest flowering time was found in two lines, MW 85 and MW 113, both with the same average of 68.12 DAP (Figure 3). However, the individual plant with the shortest flowering time among these two lines was in the MW 85 line (Table A1), with a flowering time of 67 DAP. The line with the longest flowering time was MW 88, with an average of 71.04 DAP (Figure 3), and the individual with the longest flowering time took 85 DAP (Table A1). Figure 3 shows that the wild-type population had an average flowering time of 64.75 DAP, ranging between 63 and 65 DAP. The Dunnett post-hoc test comparing the average flowering time of the mutant lines to the control population (wild-type) showed significance values >0.05 for all comparisons, indicating no significant differences in the average flowering time between the mutant lines and their wild-type parent.
Figure 3. Graph of flowering time
Numbers followed by the same letter indicate results that are not significantly different according to the Dunnet test at p> 0.05.
3.4 Total grains number per clump
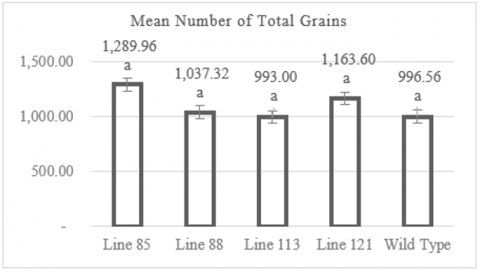
Observations of the total grain number per clump revealed that the mutant rice lines produced a total grain count ranging from 993 to 1,289.96 grains per clump in average. Figure 4 indicates that the lowest total grain number was recorded in the mutant line MW 113, with an average of 993 grains per clump. In contrast, the highest total grain number was observed in the mutant line MW 85, with an average of 1,289.96 grains per clump. Figure 4 also shows that the wild-type plants had an average total grain number per clump of 996.56 grains. The individual plant with the lowest total grain number per clump was found in line MW 121, with 448 grains, while the individual with the highest total grain number per clump was in line MW 85, with 1,631 grains (Table A1). Data analysis using the Dunnett test showed that the average total grain number per clump among the mutant lines did not differ significantly from the control population (wild type), with significance values >0.05.
Figure 4. Graph of number of total grains
Numbers followed by the same letter indicate results that are not significantly different according to the Dunnet test at p> 0.05.
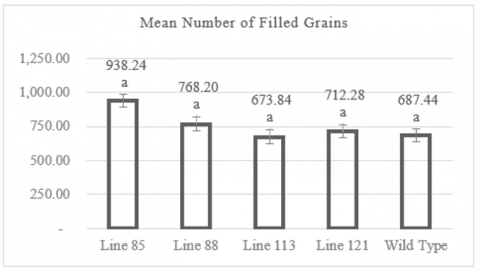
3.5 Filled grain number per clump
Observations of filled grain number per clump showed that the mutant rice lines produced filled grain count ranging from 673.84 to 938.24 grains per clump in average. Figure 5 indicates that the lowest filled grain number was recorded in the mutant line MW 113, with an average of 673.84 grains per clump. In contrast, the highest filled grain number was observed in the mutant line MW 85, with an average of 938.24 grains per clump. Figure 5 also shows that the wild-type plants had an average filled grain number per clump of 687.44 grains.
The individual plant with the lowest filled grain number per clump was found in line MW 121, with 292 grains, while the individual with the highest filled grain number per clump was in line MW 85, with 1,172 grains (Table A1). Data analysis using the Dunnett test showed that the average filled grain number per clump among the mutant lines did not differ significantly from the control population (wild type), with significance values >0.05.
Figure 5. Graph of number of filled grains
Numbers followed by the same letter indicate results that are not significantly different according to the Dunnet test at p> 0.05.
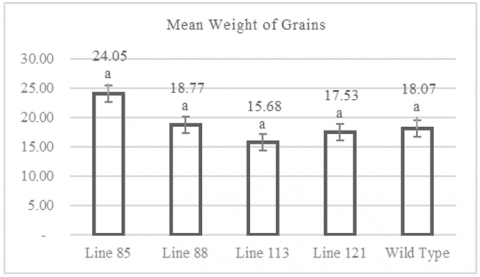
3.6 Weight of grains per clump
Observations of grain weight per clump revealed that the mutant rice lines produced average grain weights ranging from 15.68 to 24.05 grams per clump. Figure 6 indicates that the lowest grain weight per clump was recorded in the mutant line MW 113, with an average of 15.68 grams per clump. In contrast, the highest grain weight per clump was observed in the mutant line MW 85, with an average of 24.05 grams per clump. Figure 6 also shows that the wild-type plants had an average grain weight per clump of 18.07 grams.
Figure 6. Graph of weight of grains
Numbers followed by the same letter indicate results that are not significantly different according to the Dunnet test at p> 0.05.
The individual plant with the smallest grain weight per clump was found in line MW 121, with a weight of 6.84 grams, while the individual with the highest grain weight per clump was in line MW 85, with a weight of 31.14 grams (Table A1). Data analysis using the Dunnett test showed that the average grain weight per clump among the mutant lines did not differ significantly from the control population (wild type), with significance values >0.05.
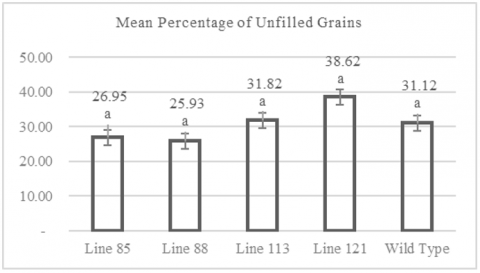
3.7 Percentage of unfilled grains per clump
Observation of the percentage of empty grains per clump showed that the mutant rice lines produced an average percentage of empty grains of 25.93% to 38.62% per clump. Figure 7 shows that the lowest percentage of empty grains was recorded in the mutant line MW 88, with an average percentage of 25.93%. In contrast, the highest percentage of empty grains was observed in the mutant line MW 121, with an average of 38.62%. Figure 7 also shows that wild-type plants had an average percentage of empty grains per clump of 31.12%. The individual plant with the smallest percentage of empty grains per clump was found in line MW 88, with a percentage of 9.75%, while the individual with the highest percentage of empty grains per clump was in line MW 113, with a percentage of 53.08% (Table A1). Data analysis using the Dunnett test showed that the average percentage of empty grains per clump among the mutant lines did not differ significantly from the control population (wild type), with significance values > 0.05.
Figure 7. Graph of percentage of unfilled grains
Numbers followed by the same letter indicate results that are not significantly different according to the Dunnet test at p> 0.05.
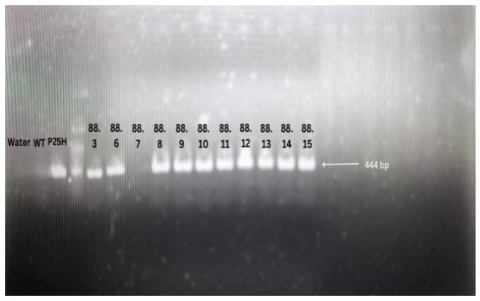
Figure 8. Visualization results of Cas9 gene PCR
Water: Negative control. WT (Wildtype): Wild-type sample (non-transgenic control). P25H: Plasmid as a positive control.
3.8 Detection of the Cas9 gene
We also analyzed the presence of the Cas9 gene in all tested individuals. The visualization in Figure 8 showed that nearly all individuals tested in this study still contained the Cas9 gene, except for one individual from line 88, number 7 (designated as individual 88.7). This indicates that the majority of the plants tested have not yet been freed from transgenic elements. Furthermore, it can be assumed that most of the tested individuals inherited the CRISPR/Cas9 construct from their parent and likely also inherited mutations from the parent.
The analysis of plant height and the number of tillers in four CRISPR/Cas9-gRNAOsSWEET mutant lines revealed no significant differences compared to their parental lines. This aligns with research by Duy et al. [18], which involved editing the OsSWEET14 gene's promoter and found no differences in height or tiller number between mutant lines and their wild-type parents. Similarly, Oliva et al. [11] Found no differences in plant height between mutant plants and their parental lines. According to Sulicantini et al. [24], rice plants can be categorized into three groups based on their height: short (<110 cm), medium (110-130 cm), and tall (>130 cm). The data analysis showed that the average height of the mutant lines ranged between 116-124 cm, indicating that these mutant lines fall into the medium height group (110-130 cm). Additionally, Peng et al. [25] stated that the ideal rice plant height should be between 90-100 cm. Based on this standard, the four mutant lines do not qualify as ideal-height rice plants.
The number of tillers is an important agronomic trait influencing rice [26]. Tiller characteristics can be observed from early growth until the maximum tillering phase, which is achieved during the grain-filling stage. Primary tillers emerge from the main stem, secondary tillers arise from primary tillers, and tertiary tillers emerge from secondary tillers, and so on [27]. Therefore, an increase in tiller number positively correlates with crop yield. Data analysis revealed no significant differences in the number of tillers between mutant lines and control plants. This indicates that the editing limited to the promoter region did not affect the normal expression of SWEET genes [18], thus not disrupting the growth or tillering of mutant lines. Additionally, other genes like OsGA3ox2, OsGA20ox2, and OsMADS57 play vital roles in regulating plant height [28]. Therefore, these genes should be the focus of research to regulate plant height.
Flowering time is when a plant begins to flower [29]. According to Ismachin and Sobrizal [30], earlier flowering results in earlier harvest time. Flowering time is positively correlated with harvest time [31]. Mutations in the OsSWEET11 gene do not significantly affect flowering time, as evidenced by the lack of significant differences in flowering time between rice plants with and without mutations in this gene. This may be due to other vital factors influencing flowering time, such as photoperiod sensitivity [32], temperature [33], genetic factors like Hd1, Hd3a, RFT1, and Ghd7 [34], phytohormones [35], water and nutrient availability [36, 37], and stress factors [38].
Variables such as total grain number and filled grain number are significantly and positively associated with yield [39, 40]. Additionally, grain weight per clump also positively correlates with yield per unit area [41]. Ikhwani et al. [42] stated a positive relationship between grain weight and filled grain number per clump, making these three variables useful indicators of genotypic yield. This study aligns with findings from Zeng et al. [43], who also observed no difference in yield between OsSWEET14 mutant rice lines and the Zhonghua 11 wild type. The absence of distinct phenotypic changes may result from compensation by other genes involved in grain filling. As stated by Fei et al. [44], the minimal phenotypic changes in OsSWEET14 mutants compared to wild types suggest that other members of the clade III SWEET gene family, such as OsSWEET15, might compensate for the loss of OsSWEET14 function. Similarly, Fei et al. [44] also analyzed the tissue-specific expression of OsSWEET14 and OsSWEET15, revealing that both genes are expressed in developing rice caryopses, further supporting the hypothesis of functional compensation for the OsSWEET11 gene by these two genes. Genetic redundancy may underlie this compensatory phenomenon.
The percentage of unfilled grains variable reflects the proportion of unfilled or underdeveloped grains. This measurement is crucial for understanding and improving crop yields due to its direct correlation with overall productivity. According to Majidimehr [45], the empty grain number is negatively correlated with yield, indicating that higher empty grain percentages result in lower yield per clump. The empty grain number can be converted into a percentage by dividing the number of empty grains by the total grains per clump. Breeders prefer lines with a lower empty grain percentage, making this variable essential for line selection. In this study, no significant differences were observed in the empty grain percentage, likely for similar reasons as other variables: functional compensation by other genes involved in grain filling. As reported by Scofield et al. [46], knocked out the OsSUT1 gene resulted in mutant lines with significantly reduced grain filling. Hu et al. [47] highlighted that OsSUT1 is vital for rice plant development during reproductive stages and is strongly expressed in rice stems and developing caryopses, indicating its role in grain filling. This gene is specifically expressed massively in the aleurone layer of rice caryopsis or grain [48, 49].
In this study, we also examined the presence of transgenic elements, specifically the Cas9 gene, in the genome of T1 generation rice plants that had been cultivated. Detecting the Cas9 gene in progeny generations is crucial, as Cas9 expression in progeny can result in unwanted new mutations, which differ from those obtained in the T0 generation [50]. Furthermore, Ishizaki [50] emphasized that eliminating the Cas9 gene is essential to ensure the stability of mutation inheritance and to prevent chimerism in later generations.
Based on PCR analysis of the Cas9 gene, it was found that all individuals still carried the Cas9 gene except for one individual from line 88 number 7 (namely individual 88.7), in which the Cas9 gene was no longer detected in its genome. During reproduction, if plants or animals carrying CRISPR/Cas9-induced mutations reproduce, there is a possibility that the offspring inherit a version of the genome without the Cas9 transgene. This aligns with the findings of Yang et al. [51], who reported that 11.3% of CRISPR/Cas9 mutant Brassica napus T1 generation individuals did not show a Cas9 band.
A possible explanation for this phenomenon is that the CRISPR/Cas9 cassette is lost during cell division, resulting in the absence of detectable Cas9 in the T1 generation. The relatively small sample size in this study might have contributed to the limited number of individuals confirmed to be transgene-free, leaving other unplanted seeds potentially free of the Cas9 transgene unidentified.
Moving forward, individuals detected to carry the Cas9 gene as well as those without it need to undergo further testing through flanking PCR and sequencing to confirm the presence of mutations induced in the target gene OsSWEET11.
Overall, it can be concluded that mutations in the OsSWEET11 promoter region did not significantly affect phenotypic traits in the genetic background of the Mentik Wangi variety. Possible reasons for this include:
Future studies should include molecular analysis of the mutant lines especially DNA sequencing of the target gene to confirm whether the mutation occurs in the OsSWEET11 target gene and examine the mutation form. Additionally, gene expression analysis using qRT-PCR on specific tissues is necessary to determine the impact of mutations on OsSWEET11 transcription in the Mentik Wangi genetic background.
Agronomic variables in the mutant lines did not differ significantly compared to their wild-type parents. This could be due to several possible factors, such as:
Furthermore, if the mutation is indeed inherited from the T0 generation, this demonstrates that editing the OsSWEET11 gene does not negatively affect the agronomic performance of the mutant plants. Thus, the gene-editing method to engineer bacterial leaf blight resistance in the Mentik Wangi rice variety is a viable approach without causing significant yield penalties.
Because this study has not yet conducted a disease resistance test on individuals in the mutant line, it is not yet known how mutations in the gene promoter impact the resistance of the mutant line to bacterial leaf blight. Molecular analysis in the form of DNA sequencing is still needed to confirm the presence of mutations in the mutant plant genome. Additionally, disease resistance analysis should be performed by inoculating the confirmed mutant plants with the bacterial pathogen causing bacterial leaf blight.
Table A1. Supplementary table
|
Individual Number |
PH (cm) |
NT |
FT (days) |
WG (g) |
NG |
NFG |
PUG (%) |
|
MW 85.1 |
114 |
12 |
67 |
17.59 |
1178 |
699 |
40.66 |
|
MW 85.2 |
124 |
16 |
67 |
23.58 |
1305 |
886 |
32.11 |
|
MW 85.3 |
126 |
18 |
67 |
23.91 |
1631 |
984 |
39.67 |
|
MW 85.4 |
111 |
12 |
67 |
21.13 |
1267 |
979 |
22.73 |
|
MW 85.5 |
123.5 |
10 |
67 |
23.83 |
1203 |
925 |
23.11 |
|
MW 85.6 |
124.5 |
11 |
67 |
18.95 |
1269 |
768 |
39.48 |
|
MW 85.8 |
124 |
13 |
67 |
24.89 |
1118 |
940 |
15.92 |
|
MW 85.9 |
110 |
12 |
67 |
17.47 |
1179 |
779 |
33.93 |
|
MW 85.10 |
116 |
12 |
67 |
24.09 |
1153 |
972 |
15.7 |
|
MW 85.11 |
112 |
10 |
67 |
17.85 |
1202 |
779 |
35.19 |
|
MW 85.12 |
120 |
11 |
67 |
24.91 |
1179 |
957 |
18.83 |
|
MW 85.13 |
114 |
12 |
67 |
26.8 |
1326 |
1052 |
20.66 |
|
MW 85.14 |
121 |
11 |
67 |
21.15 |
1347 |
864 |
35.86 |
|
MW 85.15 |
126 |
12 |
67 |
26.27 |
1547 |
978 |
36.78 |
|
MW 85.16 |
117 |
13 |
67 |
31.14 |
1576 |
1172 |
25.63 |
|
MW 85.17 |
128 |
10 |
67 |
23.78 |
1367 |
901 |
34.09 |
|
MW 85.18 |
127.5 |
12 |
67 |
25.89 |
1363 |
997 |
26.85 |
|
MW 85.19 |
110 |
15 |
69 |
26.43 |
1286 |
1000 |
22.24 |
|
MW 85.20 |
120 |
13 |
67 |
28.76 |
1361 |
1083 |
20.43 |
|
MW 85.21 |
123.5 |
12 |
67 |
27.16 |
1207 |
932 |
22.78 |
|
MW 85.23 |
122 |
7 |
85 |
21.13 |
1099 |
807 |
26.57 |
|
MW 85.24 |
124.5 |
11 |
69 |
25.63 |
1322 |
1028 |
22.24 |
|
MW 85.25 |
107 |
14 |
68 |
28.67 |
1401 |
1053 |
24.84 |
|
MW 85.26 |
120.5 |
15 |
67 |
26.61 |
1244 |
1016 |
18.33 |
|
MW 85.27 |
115 |
10 |
72 |
23.56 |
1119 |
905 |
19.12 |
|
MW 88.1 |
127.5 |
10 |
67 |
19.78 |
1155 |
796 |
31.08 |
|
MW 88.2 |
128.5 |
12 |
67 |
18.69 |
1212 |
787 |
35.07 |
|
MW 88.3 |
118 |
10 |
67 |
17.62 |
1024 |
695 |
32.13 |
|
MW 88.4 |
131 |
9 |
67 |
23.2 |
1341 |
932 |
30.5 |
|
MW 88.5 |
128.5 |
12 |
67 |
16.03 |
1068 |
688 |
35.58 |
|
MW 88.6 |
124 |
10 |
67 |
11.46 |
758 |
456 |
39.84 |
|
MW 88.7 |
124 |
10 |
67 |
20.15 |
1005 |
822 |
18.21 |
|
MW 88.8 |
122.5 |
10 |
67 |
17.55 |
1079 |
730 |
32.34 |
|
MW 88.9 |
124 |
9 |
67 |
18.97 |
1156 |
794 |
31.31 |
|
MW 88.10 |
121 |
12 |
67 |
23.36 |
1178 |
929 |
21.14 |
|
MW 88.11 |
126 |
6 |
67 |
13.97 |
844 |
611 |
27.61 |
|
MW 88.12 |
121 |
8 |
67 |
20.33 |
1097 |
848 |
22.7 |
|
MW 88.13 |
120 |
14 |
67 |
24.02 |
1167 |
987 |
15.42 |
|
MW 88.14 |
122 |
10 |
67 |
19.54 |
994 |
795 |
20.02 |
|
MW 88.15 |
119.5 |
12 |
67 |
20.96 |
1165 |
811 |
30.39 |
|
MW 88.16 |
111 |
8 |
85 |
16.78 |
995 |
703 |
29.35 |
|
MW 88.17 |
110 |
8 |
85 |
15.95 |
834 |
688 |
17.51 |
|
MW 88.18 |
108 |
7 |
74 |
24.9 |
1274 |
1032 |
19 |
|
MW 88.21 |
120 |
8 |
70 |
11.06 |
569 |
433 |
23.9 |
|
MW 88.22 |
112.5 |
9 |
74 |
16.1 |
888 |
664 |
25.23 |
|
MW 88.23 |
113 |
6 |
85 |
15.6 |
892 |
673 |
24.55 |
|
MW 88.24 |
114.5 |
10 |
74 |
17.66 |
959 |
709 |
26.07 |
|
MW 88.25 |
121 |
13 |
67 |
24.33 |
1046 |
944 |
9.75 |
|
MW 88.27 |
120 |
11 |
72 |
22.61 |
1220 |
902 |
26.07 |
|
MW 88.28 |
108 |
11 |
85 |
18.64 |
1013 |
776 |
23.4 |
|
MW 113.1 |
124 |
9 |
67 |
11.9 |
1070 |
502 |
53.08 |
|
MW 113.2 |
127 |
10 |
67 |
16.12 |
1081 |
647 |
40.15 |
|
MW 113.3 |
119 |
11 |
67 |
20.39 |
1239 |
830 |
33.01 |
|
MW 113.4 |
124 |
11 |
67 |
16.64 |
965 |
628 |
34.92 |
|
MW 113.5 |
121 |
11 |
67 |
18.02 |
1142 |
783 |
31.44 |
|
MW 113.6 |
109 |
9 |
67 |
14.54 |
1020 |
673 |
34.02 |
|
MW 113.7 |
122 |
8 |
67 |
12.88 |
795 |
585 |
26.42 |
|
MW 113.8 |
126 |
8 |
67 |
15.52 |
981 |
671 |
31.6 |
|
MW 113.9 |
121 |
12 |
67 |
17.87 |
1077 |
756 |
29.81 |
|
MW 113.10 |
124 |
10 |
67 |
19.38 |
1069 |
831 |
22.26 |
|
MW 113.11 |
128 |
7 |
69 |
13 |
959 |
581 |
39.42 |
|
MW 113.12 |
121 |
8 |
69 |
17.14 |
1008 |
719 |
28.67 |
|
MW 113.13 |
127 |
8 |
69 |
19.58 |
1107 |
792 |
28.46 |
|
MW 113.14 |
113 |
8 |
68 |
13.42 |
921 |
625 |
32.14 |
|
MW 113.15 |
109 |
9 |
70 |
14.65 |
953 |
659 |
30.85 |
|
MW 113.16 |
131 |
7 |
69 |
14.12 |
852 |
609 |
28.52 |
|
MW 113.18 |
107 |
6 |
68 |
19 |
1081 |
763 |
29.42 |
|
MW 113.19 |
124 |
11 |
67 |
19.22 |
1076 |
808 |
24.91 |
|
MW 113.21 |
121 |
11 |
70 |
13 |
940 |
645 |
31.38 |
|
MW 113.22 |
100 |
8 |
69 |
14.16 |
932 |
612 |
34.33 |
|
MW 113.24 |
106 |
8 |
68 |
15.18 |
1147 |
721 |
37.14 |
|
MW 113.25 |
101 |
7 |
74 |
10.75 |
646 |
490 |
24.15 |
|
MW 113.27 |
105 |
9 |
68 |
18.91 |
1091 |
792 |
27.41 |
|
MW 113.28 |
98 |
5 |
68 |
14.33 |
724 |
595 |
17.82 |
|
MW 113.29 |
100 |
9 |
67 |
12.31 |
949 |
529 |
44.26 |
|
MW 121.1 |
122 |
9 |
69 |
14.64 |
859 |
570 |
33.64 |
|
MW 121.2 |
122 |
11 |
67 |
20.75 |
1105 |
805 |
27.15 |
|
MW 121.3 |
123 |
9 |
67 |
17.36 |
1135 |
691 |
39.12 |
|
MW 121.4 |
127 |
12 |
67 |
19.62 |
1236 |
766 |
38.03 |
|
MW 121.5 |
128 |
10 |
67 |
19.99 |
1120 |
807 |
27.95 |
|
MW 121.6 |
125 |
11 |
68 |
22.2 |
1334 |
874 |
34.48 |
|
MW 121.7 |
126 |
13 |
67 |
13.22 |
888 |
520 |
41.44 |
|
MW 121.8 |
124 |
11 |
67 |
17.07 |
1491 |
714 |
52.11 |
|
MW 121.9 |
120 |
12 |
67 |
21.98 |
1377 |
879 |
36.17 |
|
MW 121.10 |
129 |
11 |
67 |
15.13 |
982 |
624 |
36.46 |
|
MW 121.11 |
132 |
8 |
67 |
14.79 |
1144 |
628 |
45.1 |
|
MW 121.12 |
117 |
8 |
67 |
16.92 |
1278 |
692 |
45.85 |
|
MW 121.13 |
116 |
6 |
85 |
12.09 |
843 |
508 |
39.74 |
|
MW 121.14 |
123 |
13 |
67 |
19.65 |
1465 |
854 |
41.71 |
|
MW 121.15 |
120.5 |
8 |
67 |
15.95 |
1019 |
638 |
37.39 |
|
MW 121.16 |
123 |
12 |
67 |
25.94 |
1463 |
1036 |
29.19 |
|
MW 121.17 |
133 |
9 |
68 |
22.33 |
1388 |
914 |
34.15 |
|
MW 121.18 |
128 |
9 |
67 |
17.31 |
1474 |
724 |
50.88 |
|
MW 121.19 |
128 |
12 |
67 |
21.22 |
1268 |
852 |
32.81 |
|
MW 121.20 |
128 |
9 |
67 |
21.43 |
1271 |
863 |
32.1 |
|
MW 121.21 |
128 |
10 |
67 |
21.74 |
1304 |
893 |
31.52 |
|
MW 121.22 |
123 |
13 |
67 |
11.79 |
869 |
460 |
47.07 |
|
MW 121.23 |
122 |
10 |
67 |
14.53 |
1175 |
615 |
47.66 |
|
MW 121.24 |
120 |
10 |
67 |
6.84 |
448 |
292 |
34.82 |
|
MW 121.25 |
127 |
9 |
68 |
13.78 |
1154 |
588 |
49.05 |
|
WT.1 |
122 |
10 |
65 |
19.94 |
1076 |
743 |
30.95 |
|
WT.2 |
121 |
9 |
65 |
15.29 |
1035 |
755 |
27.05 |
|
WT.3 |
125 |
9 |
63 |
24.2 |
783 |
564 |
27.97 |
|
WT.4 |
121.5 |
11 |
65 |
17.13 |
1261 |
880 |
30.21 |
|
WT.5 |
110 |
11 |
65 |
19.6 |
878 |
637 |
27.45 |
|
WT.6 |
117 |
10 |
65 |
19.14 |
1099 |
733 |
33.3 |
|
WT.7 |
116 |
8 |
65 |
12.01 |
985 |
733 |
25.58 |
|
WT.8 |
112 |
10 |
65 |
17.27 |
848 |
475 |
43.99 |
|
WT.9 |
114 |
12 |
67 |
17.59 |
1004 |
667 |
33.57 |
Note: PH: Plant Height, NT: Number of Tillers, FT: Flowering time, NG: Number of Grains per clump, NFG: Number of Filled Grains per clump, WG: Weight of Grains per clump, PUG: Percentage of Unfilled Grains per clump.
[1] Yulianto, Y. (2017). Ketahanan varietas padi lokal Mentik Wangi terhadap penyakit blas. Journal of Food System and Agribusiness, 1(1): 47-54. https://doi.org/10.25181/jofsa.v1i1.83
[2] Khaeruni, A., Taufik, M., Wijayanto, T., Johan, E. (2014). Perkembangan penyakit hawar daun bakteri pada tiga varietas padi sawah yang diinokulasi pada beberapa fase pertumbuhan. Jurnal Fitopatologi Indonesia, 10(4): 119-125. https://doi.org/10.14692/jfi.10.4.119
[3] Nurhidayah, S., Purwoko, B.S., Dewi, I.S., Suwarno, W.B., Lubis, I., Yuriyah, S. (2024). Resistance of doubled haploid rice lines with green super rice characters to bacterial leaf blight. Caraka Tani Journal of Sustainable Agriculture, 39(2): 381-395. https://doi.org/10.20961/carakatani.v39i2.88198
[4] Niño-Liu, D.O., Ronald, P.C., Bogdanove, A.J. (2006). Xanthomonas oryzae pathovars: Model pathogens of a model crop. Molecular plant pathology, 7(5): 303-324. https://doi.org/10.1111/j.1364-3703.2006.00344.x
[5] Suparyono, Sudir, Suprihanto. (2004). Pathotype profile of Xanthomonas oryzae pv. oryzae isolates from the rice ecosystem in Java. Indonesian Journal of Agricultural Science, 5(2): 63-69. https://doi.org/10.21082/ijas.v5n2.2004.p63-69
[6] Fred, A.K., Kiswara, G., Yi, G., Kim, K.M. (2016). Screening rice cultivars for resistance to bacterial leaf blight. Journal of Microbiology and Biotechnology, 26(5): 938-945. https://doi.org/10.4014/jmb.1510.10016
[7] Yuan, M., Wang, S., Chu, Z., Li, X., Xu, C. (2010). The bacterial pathogen Xanthomonas oryzae overcomes rice defenses by regulating host copper redistribution. The Plant Cell, 22(9): 3164-3176. https://doi.org/10.1105/tpc.110.078022
[8] Chu, Z., Wang, S., Chen, X., Yin, D., Xu, C., Li, X., Wang, J., Zhu, L. (2006). Promoter mutations of an essential gene for pollen development result in disease resistance in rice. Genes and Development, 20(10): 1250-1255. https://doi.org/10.1101/gad.1416306
[9] Li, T., Liu, B., Spalding, M.H., Weeks, D.P., Yang, B. (2012). High-efficiency TALEN-based gene editing produces disease-resistant rice. Nature Biotechnology. https://doi.org/10.1038/nbt.2199
[10] Xu, Z., Xu, X., Gong, Q., Li, Z., Li, Y., Wang, S., Yang, J., Chen, X., Wang, J., Yu, H., Zhu, L. (2019). Engineering broad-spectrum bacterial blight resistance by simultaneously disrupting variable TALE-binding elements of multiple susceptibility genes in rice. Molecular Plant, 12(11): 1434-1446. https://doi.org/10.1016/j.molp.2019.08.006
[11] Oliva, R., Ji, C., Atienza-Grande, G., Huguet-Tapia, J.C., Perez-Quintero, A., Li, T., Eom, J.S., Li, C., Nguyen, H., Liu, B., Auguy, F., Sciallano, C., Luu, V.T., Dossa, G.S., Cunnac, S., Schmidt, S.M., Slamet-Loedin, I., Vera-Cruz, C., Szurek, B., Frommer, W.B., White, F.F., Yang, B., Booher, N.J., Bogdanove, A.J. (2019). Broad-spectrum resistance to bacterial blight in rice using genome editing. Nature Biotechnology, 37(11): 1344-1350. https://doi.org/10.1038/s41587-019-0267-z
[12] Huang, Q., Li, C., Wang, C., Yue, T., Ding, Y., Cheng, Z., Wang, Y. (2023). CRISPR/Cas9-mediated mutagenesis of the susceptibility gene OsHPP04 in rice confers enhanced resistance to rice root-knot nematode. Frontiers in Plant Science, 14: 1-11. https://doi.org/10.3389/fpls.2023.1134653
[13] Yang, J., Wang, X., Cheng, Y., Liu, Z., Li, J., Wang, D., Zhao, Y., Wang, G. (2023). Improvement of resistance to rice blast and bacterial leaf streak by CRISPR/Cas9-mediated mutagenesis of Pi21 and OsSULTR3; 6 in rice (Oryza sativa L.). Frontiers in Plant Science, 14: 1-12. https://doi.org/10.3389/fpls.2023.1209384
[14] Chen, L.Q. (2014). SWEET sugar transporters for phloem transport and pathogen nutrition. New Phytologist, 201(4): 1150-1155. https://doi.org/10.1111/nph.12445
[15] Yang, J., Luo, D., Yang, B., Frommer, W.B., Eom, J.S. (2018). SWEET11 and 15 as key players in seed filling in rice. New Phytologist, 218(2): 604-615. https://doi.org/10.1111/nph.15004
[16] Yang, B., Sugio, A., White, F.F. (2006). Os8N3 is a host disease-susceptibility gene for bacterial blight of rice. In Proceedings of the National Academy of Sciences, 103(27): 10503-10508. https://doi.org/10.1073/pnas.0604088103
[17] Antony, G., Zhou, J., Huang, S., Li, T., Liu, B., White, F., Goss, E.M., Yang, B. (2010). Rice Xa13 recessive resistance to bacterial blight is defeated by induction of the disease susceptibility gene Os-11N3. The Plant Cell, 22(11): 3864-3876. https://doi.org/10.1105/tpc.110.078964
[18] Duy, P.N., Li, Z., Liang, Z., Nguyen, C.T., Xia, S., Liu, D., Lin, Q., Zhang, X., Li, J., Yang, B., Li, T. (2021). Improved bacterial leaf blight disease resistance in the major elite Vietnamese rice cultivar TBR225 via editing of the OsSWEET14 promoter. PloS One, 16(9): e0255470. https://doi.org/10.1371/journal.pone.0255470
[19] Achary, V.M.M., Reddy, M.K. (2021). CRISPR-Cas9 mediated mutation in GRAIN WIDTH and WEIGHT2 (GW2) locus improves aleurone layer and grain nutritional quality in rice. Scientific Reports, 11(1): 1-14. https://doi.org/10.1038/s41598-021-00828-z
[20] Rifhani, N.F., Rachmawati, D., Setiari, N., Safitri, A., Rifa’i, M., Rahayu, S., Nandariyah, N., Supriyadi, S., Sobrizal, S. (2023). Construction of the CRISPR/Cas9 module and genetic transformation of aromatic rice cv. Mentik Wangi for developing bacterial leaf blight resistance. Biodiversitas, 24(6): 3258-3268. https://doi.org/10.13057/biodiv/d240620
[21] Liu, D., Xu, L., Wang, W., Jia, S., Jin, S., Gao, J. (2020). OsRRM, an RNA-binding protein, modulates sugar transport in rice (Oryza sativa L.). Frontiers in Plant Science, 11: 1-14. https://doi.org/10.3389/fpls.2020.605276
[22] Zhang, J., Li, Z., Liang, Y., Zhi, L., Wang, S., Liu, L. (2024). Sugar transporter modulates nitrogen-determined tillering and yield formation in rice. Nature Communications, 15(1): 9233. https://doi.org/10.1038/s41467-024-53651-1
[23] Kurniadie, D. (2002). Pengaruh kombinasi dosis pupuk majemuk NPK Phonska dan pupuk N terhadap pertumbuhan dan hasil tanaman padi sawah (oryza sativa L) varietas IR 64. Bionatura, 4(3): 217942.
[24] Sulichantini, E.D., Idris, S.D., Safitri, D.A. (2023). Morphological and agronomical characters identification of rice plant (Oryza sativa L.) Backcross1 (BC1F1) Pandan Ungu/Kambang//Pandan Ungu. Journal of Agricultural Ecology and Research International, 24(6): 40-46. https://doi.org/10.9734/JAERI/2023/v24i6559
[25] Peng, S., Khush, G.S., Virk, P., Tang, Q., Zou, Y. (2008). Progress in ideotype breeding to increase rice yield potential. Field Crops Research, 108(1): 32-38. https://doi.org/10.1016/j.fcr.2008.04.001
[26] Badshah, M.A., Naimei, T., Zou, Y., Ibrahim, M., Wang, K. (2014). Yield and tillering response of super hybrid rice Liangyoupeijiu to tillage and establishment methods. Crop Journal, 2(1): 79-86. https://doi.org/10.1016/j.cj.2013.11.004
[27] Afza, H., Andarini, Y.N., Risliawati, A. (2020). Tiller profile diversity of upland rice germplasm in ICABIOGRAD gene bank. IOP Conference Series: Earth and Environmental Science, 482(1): 1-7. https://doi.org/10.1088/1755-1315/482/1/012041
[28] Chu, Y., Xu, N., Wu, Q., Li, X., Yuan, M., Jiang, W., Liu, Z., Wang, X., Lou, L. (2019). Rice transcription factor OsMADS57 regulates plant height by modulating gibberellin catabolism. Rice, 12(1): 1-14. https://doi.org/10.1186/s12284-019-0298-6
[29] Wahyu, Y., Darwati, I., Pulungan, M.Y., Roostika, I. (2013). Keragaan mutan putatif Purwoceng (Pimpinella pruatjan Molk.) dari benih diiradiasi sinar gamma pada tiga ketinggian tempat. Jurnal Agronomi Indonesia, 41(1): 77-82.
[30] Ismachin, M., Sobrizal, S. (2006). A significant contribution of mutation techniques to rice breeding in Indonesia. Plant Mutation Reports, 1: 18-21.
[31] Diptaningsari, D., Purwoko, B.S., Wirnas, D. (2013). Galur harapan padi gogo turunan padi lokal Pulau Buru. Prosiding Seminar Nasional Sumber Daya Genetik dan Pemuliaan Tanaman, 52-60.
[32] Molla, K.A. (2022). Flowering time and photoperiod sensitivity in rice: Key players and their interactions identified. The Plant Cell, 34(10): 3489-3490. https://doi.org/10.1093/plcell/koac230
[33] Song, Y.L., Gao, Z.C., Luan, W.J. (2012). Interaction between temperature and photoperiod in regulation of flowering time in rice. Science China Life Sciences, 55(3): 241-249. https://doi.org/10.1007/s11427-012-4300-4
[34] Zhou, S., Wei, X., Xiang, J., Li, Q., Li, M., Zhang, J., Wang, H., Zhao, Y., Lyu, J., Wei, X., Wang, M. (2021). Transcriptional and post-transcriptional regulation of heading date in rice. New Phytologist, 230(3): 943-956. https://doi.org/10.1111/nph.17158
[35] Vicentini, G., Wang, X., Zhao, J., Zhang, J., Tian, F. (2023). Environmental control of rice flowering time. Plant Communications, 4(5): 100610. https://doi.org/10.1016/j.xplc.2023.100610
[36] Zhang, C., Dong, S.S., Han, Z., Liu, Z., Wang, C., Li, W., Song, C.P. (2016). A drought-inducible transcription factor delays reproductive timing in rice. Plant Physiology, 171(1): 334-343. https://doi.org/10.1104/pp.16.01691
[37] Zhang, S., Yu, Z., Zuo, L., Wang, X., Yu, Z., Wang, W., Zhang, J., Ding, Y. (2021). Nitrogen mediates flowering time and nitrogen use efficiency via floral regulators in rice. Current Biology, 31(4): 671-683.e5. https://doi.org/10.1016/j.cub.2020.10.095
[38] Ishimaru, T., Araki, S., Ikeda, T., Kuwagata, T., Takaragawa, H., Wada, H., Hirabayashi, H., Saito, K. (2022). Effect of drought stress on flowering characteristics in rice (Oryza sativa L.): A study using genotypes contrasting in drought tolerance and flower opening time. Plant Production Science, 25(3): 359-370. https://doi.org/10.1080/1343943X.2022.2085589
[39] Kiani, G., Nematzadeh, G. (2012). Correlation and path coefficient studies in F2 populations of rice. Notulae Scientia Biologicae, 4(2): 124-127. https://doi.org/10.15835/nsb427366
[40] Patel, J., Patel, K., Prajapati, K., Soni, N., Patel, A. (2017). Correlation and path coefficient analysis in rainfall upland rice (Oryza sativa L.). Environment and Ecology, 35(2): 789-794. https://doi.org/10.20546/ijcmas.2018.707.022
[41] Oladosu, Y., Rafii, M.Y., Magaji, U., Abdullah, N., Miah, G., et al. (2018). Genotypic and phenotypic relationship among yield components in rice under tropical conditions. BioMed Research International, 2018(1): 8936767. https://doi.org/10.1155/2018/8936767
[42] Ikhwani, Novisrayani, N., Husna, N., Yuniarti, E. (2022). Formula application of N fixation and P solubilizing isolate from two soil types of paddy field on the growth and yield of rice (Oryza sativa Linn.). IOP Conference Series: Earth and Environmental Science, 976(1). https://doi.org/10.1088/1755-1315/976/1/012040
[43] Zeng, X., Luo, Y., Vu, N.T.Q., Shen, S., Xia, K., Zhang, M. (2020). CRISPR/Cas9-mediated mutation of OsSWEET14 in rice cv. Zhonghua11 confers resistance to Xanthomonas oryzae pv. oryzae without yield penalty. BMC Plant Biology, 20(1): 1-11. https://doi.org/10.1186/s12870-020-02524-y
[44] Fei, H., Wang, K., Dai, X., Zhang, W., Ma, J., Pan, Z., Luan, W., Wang, D. (2021). OsSWEET14 cooperates with OsSWEET11 to contribute to grain filling in rice. Plant Science, 306: 110851. https://doi.org/10.1016/j.plantsci.2021.110851
[45] Majidimehr, A. (2018). Study of quantitative characteristics correlated with grain yield in rice using multivariate analysis. Journal of Crop Breeding, 10(27): 143-151. https://doi.org/10.29252/jcb.10.27.143
[46] Scofield, G.N., Hirose, T., Gaudron, J.A., Upadhyaya, N.M., Ohsugi, R., Furbank, R.T. (2002). Antisense suppression of the rice sucrose transporter gene, OsSUT1, leads to impaired grain filling and germination but does not affect photosynthesis. Functional Plant Biology, 29(7): 815-826. https://doi.org/10.1071/PP01204
[47] Hu, Z., Zhou, D., Ou, M., Liu, Y., Zhang, Z., Ren, H., He, G. (2021). Rice SUT and SWEET transporters. International Journal of Molecular Sciences, 22(20): 1-12. https://doi.org/10.3390/ijms222011198
[48] Bagnall, N., Wang, X., Scofield, G.N., Furbank, R.T., Offler, C., Patrick, J. (2000). Sucrose transport-related genes are expressed in both maternal and filial tissues of developing wheat grains. Australian Journal of Plant Physiology, 27: 1009-1020.
[49] Furbank, R., Scofield, G., Hirose, T., Wang, X.D., Patrick, J., Offler, C. (2001). Cellular localisation and function of a sucrose transporter OsSUT1 in developing rice grains. Australian Journal of Plant Physiology, 28: 1187-1196. https://doi.org/10.1071/PP01111
[50] Ishizaki, T. (2016). CRISPR/Cas9 in rice can induce new mutations in later generations, leading to chimerism and unpredicted segregation of the targeted mutation. Molecular Breeding, 36(12): 165. https://doi.org/10.1007/s11032-016-0591-7
[51] Yang, H., Wu, J.J., Tang, T., Liu, K.D., Dai, C. (2017). CRISPR/Cas9-mediated genome editing efficiently creates specific mutations at multiple loci using one sgRNA in Brassica napus. Scientific Reports, 7(1): 1-13. https://doi.org/10.1038/s41598-017-07871-9