Modeling Potential Distributions of Endemic Toad Oreophryne monticola Under Land Use Changes in Bali

I Made Sudiana | I Ketut Surata | I Gst Agung Ayu Nova Dwi Marhaeni | Andrio A. Wibowo | Vita Meylani*
© 2024 The authors. This article is published by IIETA and is licensed under the CC BY 4.0 license (http://creativecommons.org/licenses/by/4.0/).
OPEN ACCESS
Oreophryne monticola (Boulenger, 1897) is an endemic toad species in particular Bali and Lombok Islands that has been classified as endangered species. The threats are related to the land use changes from intact vegetation to agricultural lands and settlements due to the tourism industry and development. This study aims to estimate the potential distribution of this species by modeling using Shared Socioeconomic Pathways (SSP). The selected SSP scenarios include low land use change scenarios and moderate and high land use changes, namely SSP 1, SSP 3, and SSP 5. The potential habitats were modeled using species distribution modeling (SDM) algorithms. The SSP 1 model shows the potential habitats of O. monticola in areas sizing 564 km2, which equals to 9.75% of the Bali Island area. Under the low land use change scenario, only small portions equal to 12 km2 are considered not suitable. Under the moderate land use change scenario, or SSP 3, this scenario has resulted in the reduction of potential habitats for O. monticola. The reduction of potential habitats under this scenario is 196 km2, which equals 34.75% of total suitable habitats. This massive potential habitat reduction under SSP 3 occurred in 2 districts. Under the SSP 5 scenario, the remaining suitable habitats were only sizing 46 km2, or equal to 8.15% of total suitable habitats. This means that high land use change has caused a reduction of O. monticola’s potential habitats of about 91.85%. The areas where the suitable habitats for O. monticola are still present are observed at the border of Tabanan and Buleleng districts, and another fragment was observed in Bangli District. Those remaining suitable habitats were nearby Lake Buyan in the west and Lake Batur in the east. This study then contributes to inform which area should be protected to support the conservation of this endemic amphibian species.
amphibian, Bali, conservation, land use, SSP (Shared Socioeconomic Pathways), species distribution modeling, toad
The Lombok cross toad, or Oreophryne monticola (Boulenger 1897), is a member of the Microhylidae family of toads, which is classified under the Anura order. This species is unique to the Lesser Sunda Archipelago, specifically the islands of Lombok and Bali in Southeast Asia in particular Indonesia. In contrast to other Oreophryne species that are primarily found in the east, this species is mostly distributed in the west and it isolated in the islands of Bali and Lombok [1, 2]. As a result of its unique traits, this species has become endemic [3, 4]. This species is classified as endangered with declining trends, according to the IUCN SSC Amphibian Specialist Group (2018) and on the IUCN website (https://www.iucnredlist.org/search?query=Oreophryne%20monticola%20&searchType=species). The loss of this species' specific habitats, such as wetlands, has put it in threats.
Currently and worldwide, including in Indonesia, land use changes have posed a threat to the diversity and livelihood of species, including amphibians. Land use changes driven by anthropogenic activities in the form of overexploitation of natural resources and expansion of agricultural lands have led to habitat loss, which is believed to be responsible for increasing rates of species extinction [5, 6] and biodiversity at the global scale. In their study, Cordier et al. [7] confirmed that land use changes occurring in the present of selective logging and deforestation, followed by agriculture and cattle farming, and then urbanization, have inverse impacts on amphibian species and diversity.
In Indonesia, in particular Bali Island, a land use change has been observed on this island that has become a favorite tourist destination. To support and boost the tourism industry, intact lands have been converted into tourism-related land covers, including hotels, restaurants, golf courses, and shopping malls. It was predicted by Rimba et al. [8] that the land use change rates in the form of new built-up areas will grow by 43%. The land use change has also been observed in the remote hinterland, which is a potential habitat for wildlife. Indrawan and Trisasongko [9] reported that Badung, a hinterland on the outskirts of Denpasar city in Bali, has been threatened by land use change. It is estimated that intact forest in the Badung has declined from 6,046.7 ha to only 0.03 ha within 10 years.
Using species distribution modelling (SDM) in conjunction with anticipated land use change scenarios under Shared Socioeconomic Pathways (SSP) [10] is the most effective approach to assess broadly how the land use change would impact the presences and distributions of amphibian species. The previous RPC Representative Concentration Pathways (RCPs), which represented different levels of future radiative forcing due to changes in land use, are being continued by this SSP. Currently, SSP is made up of SSP 1, SSP 2, SSP 3, SSP 4, and SSP 5. Each SSP stands for a scenario; SSP 1 represents optimistic scenario, while SSP 5 is for pessimistic scenario. The development of each scenario was predicated upon the subsequent indicators: international commerce, land use modification regulations, land productivity growth, the environmental impact of food consumption, globalization, and mitigation policies on land changes.
SDM is a method needed to estimate how SSP impacts a certain species. The maximum entropy (MaxEnt) methods provide the foundation of this technique. We can map and model the possible distribution of species using this method. There are currently more methods available for figuring out where a species is distributed and whether an environment is suitable for it. These methods include machine learning (MaxEnt, Random Forest, Support Vector Machine/SVM), deep learning (Artificial Neural Network/ANN), statistics (generalized additive model/GAM, GLM), and geoclimatology (Bioclim, Domain, Biomapper). Each method is unique and comes with pros and cons of its own. Machine learning is one of the most popular and successful technologies for modelling species distribution, among other things [11].
Bali is an island with rich biodiversity. Despite its species richness, this island is threatened by rapid land use changes due to rapid development that threatens amphibian species. The Lombok cross toad, or Oreophryne monticola (Boulenger 1897), is an endemic amphibian to Bali Island that is also threatened. Then this study aimed to use species distribution modeling to predict the future potential distributions of O. monticola (Boulenger, 1897) under land use change scenarios of Shared Socioeconomic Pathways (SSP), including SSP 1, SSP 3, and SSP 5, in Bali Island, representing optimistic, moderate, and pessimistic scenarios. The results can then be used to plan sustainable development in Bali that can contribute to species conservation, in particular O. monticola. Current research is limited to evaluating the impact of land use on O. monticola, and this becomes the research gap. In this situation, this research is trying to address whether in the future the distribution of O. monticola will be changed following land use changes. This study is different from previously available studies since the novelty of this is using machine learning.
2.1 Study area
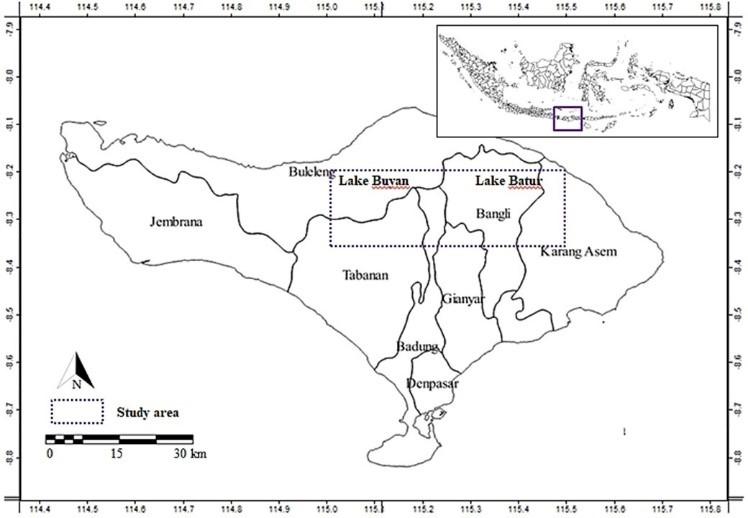
Bali Island is approximately 5,780 km2 and very popular for its tourism industry besides agricultural sectors. The northern parts of Bali are different from the southern parts. The northern parts are dominated by vegetation in the form of intact forest and agricultural land uses. The northern parts also have an elevation higher than the southern parts. The northern parts, with elevations up to 2,000 m, are characterized by three mountains. First is Mount Agung in the northeast, Mount Batur (1,717 m) in the central parts, and Mount Bratan (2,276 m) in the northwest. A caldera lake has been formed both in Mouint Batur and Mount Bratan. Batur Lake is in Mount Batur, and Buyan Lake is in Mount Bratan. The land uses surrounding Mount Batur and Mount Bratan are vegetation covers combined with settlements and agricultural land uses. Administratively, Bali Island is divided into 8 districts and 1 city (Figure 1). On the contrary to the northern parts, the southern parts are characterized by lowland and the land uses are dominated by built up areas. Different land use is predicted to impact the species since the species prefer intact land use rather than built-ups.
Figure 1. Location of study area in Bali Island, Indonesia, in the areas between Lake Batur in the east and Lake Buyan in the west
2.2 Procedure
The systematic steps of the survey procedure can be seen in Figure 2. It was initiated first by doing field surveys. The next steps are land use analyses and modeling using SSP 1, SSP 3, and SSP 5 scenarios.
Figure 2. The systematic steps of the survey procedure
2.3 Oreophryne monticola occurrence surveys
From January to March 2024, fieldwork and literature and database reviews were paired with explorations to determine the occurrence of O. monticola on Bali Island (Figure 1). The northern parts of Bali Island, where intact land uses are still prevalent, were given priority for field surveys following [12]. The surveys were prioritized in the areas between Lake Batur in the east and Bedugul and Lake Buyan in the west. The Visual Encounter Survey (VES) and a database compiled from literature reviews sourced from journal articles and reports published by government agencies, including the agency of agriculture and forestry at the Indonesian Ministry of Environment and Forestry, were used to record the occurrence of O. monticola. All habitat types in every survey site were surveyed by VES twice both during the day and at night.
The VES is used when the researcher actively surveying for O. monticola on all microhabitats including beneath logs, debris, litters, and rocks. A head lamp was used to help with the nighttime visual surveying, which involved carefully moving throughout a study site over the course of the fieldwork period. After Riyanto [13], the VES was regularly used for three hours of daytime and three hours of nighttime censuses.
For day surveying, the VES ran from 9:00 to 12:00, and for night surveying, it ran from 20:00 to 23:00. In line with Zakaria et al. [14], O. monticola was captured with the use of a sweep net due to their slippery body, which allows them to escape readily, as well as their fragile body, which makes them easily hurt if handled carelessly with the bare hands. The global positioning system (GPS) of the Garmin Etrex 30 type was used to record the geographic locations of O. monticola occurrences in the field. To be used in the species distribution modeling, the occurrence data were transformed into Microsoft Excel and exported in CSV format. The species identification used to identify O. monticola was based on amphibian identification keys [15-17], in accordance with Riyanto and Rahmadi [18].
2.4 Land use analyses
The land use in Bali Island comprising its district were classified using Geographical Information System (GIS) methods with QGIS version 2.16.2 [19]. The method is started with the retrieval of Bali Island boundary and Quickbird and GoeEye-1 satellite images of this island with 1.85 m multispectral resolution. The Quickbird and GoeEye-1 imagery of the island was then classified into several districts and land uses. The result is a thematic layer in the form of shape files (shps) of districts located in the Bali Island with their land uses classified as tree, shrub, grass, cropland, settlement, bareland, and mangrove.
2.5 Land use change scenarios SSP 1, SSP 3, and SSP 5
Table 1. SSP land use scenarios [20]
|
Scenarios |
Remarks |
Deforestation Rates |
|
SSP 1 |
Implementation of sustainable growth and land use is regulated. |
Very low |
|
SSP 2 |
Land use is less regulated |
Low |
|
SSP 3 |
Fragmentation is occurring and limited regulation on land use |
Medium |
|
SSP 4 |
Regulation on land use is decreasing |
High |
|
SSP 5 |
Very low regulation on land use |
Very high |
The selected land use change scenarios were SSP 1, SSP 3, and SSP 5, representing low, moderate, and high land use changes. Each SSP is unique and represents development scenarios that potentially shape the land use in the future, as can be seen in Table 1. In this study, only SSP 1, SSP 3, and SSP 5 scenarios are used, representing optimistic, moderate, and pessimistic scenarios. The SSP scenarios were downloaded from (https://sedac.ciesin.columbia.edu/) according to Gao and O’Neill [21, 22]. The SSP scenarios were then used as predictors and combined with the occurrences of O. monticola to generate a model using SDM. SSP 1 and 2 are predicted to have low impacts on species due to lower deforestation rates. Meanwhile, higher SSP will increase the risks to species due to an increase in deforestation rates.
2.6 Species potential distribution analyses
Using species distribution modeling packages [23] within the R platform version 3.6.3 [24], this study used and combined machine learning, geoclimate, and statistical based analyses to generate predicted potential distribution maps of O. monticola across Bali Island, Indonesia using land use change scenarios SSP 1, SSP 3, and SSP5 as the predictors. The library ("sp"), library ("dismo") [25], library ("rgdal") [26], and library ("raster") [27] are some of the R program packages used to create the species distribution maps. After that, the analysis results from machine learning models predicting O. monticola potential distribution ranges were imported into GIS using QGIS version 2.16.2 for presentation and additional study [28]. According to Wei et al. [29], species potential distribution levels on the employed machine learning model map are classified as unsuitable and suitable.
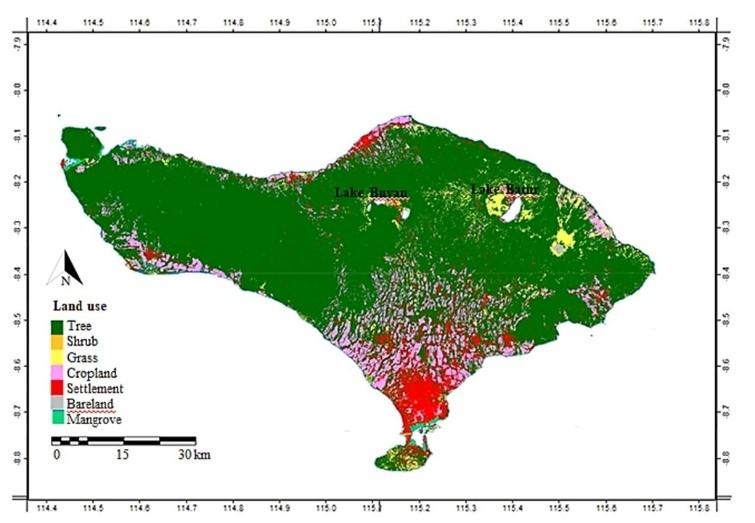
3.1 Land use
Land use in Bali, as can be seen in Figure 3, shows a distinct difference in land use, especially between the north and south regions. The land use in the south regions is mostly dominated by settlements and croplands. In contrast, the land use in the north regions is mostly dominated by vegetation covers fragmented by settlements and grasslands. The study area covering a landscape spanning from Lake Batur in the east to Bedugul and Lake Buyan in the west was also dominated by vegetation. While this vegetated region was fragmented by settlements and grasslands, followed by croplands in particular in the east near Lake Batur and northern Badung District. Lake Batur, as reported by Nuringtyas [30], has been threatened recently by the presence of anthropogenic activities.
Figure 3. Land use in Bali Island
3.2 Land use SSP scenarios
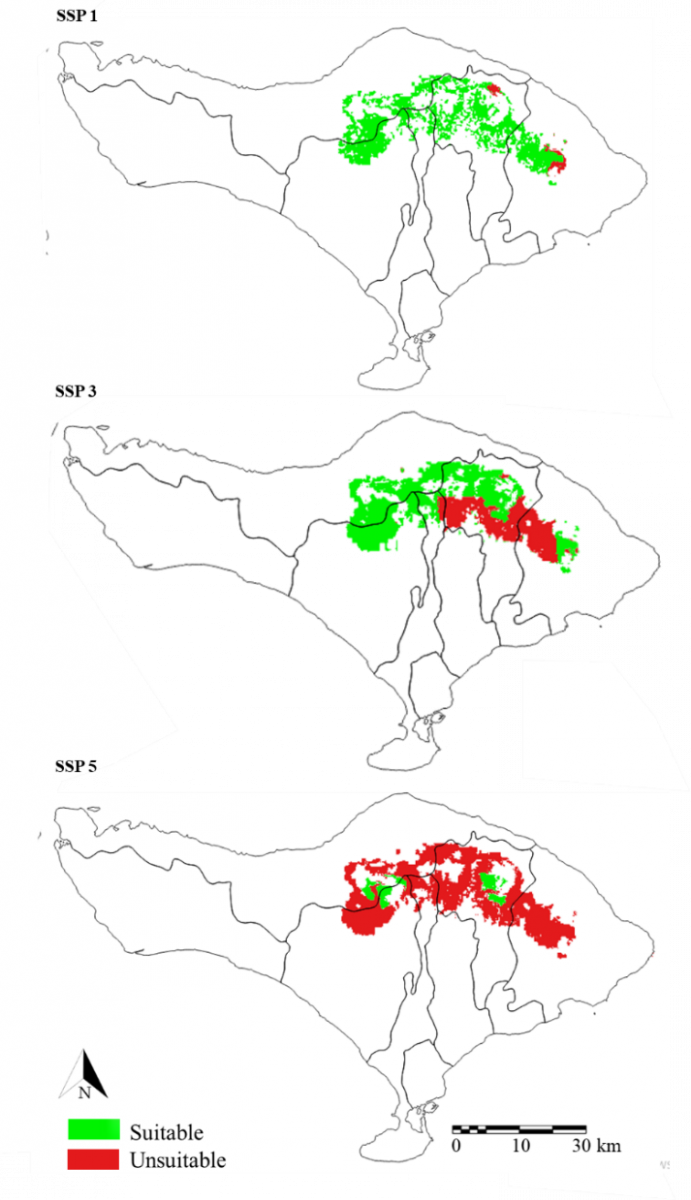
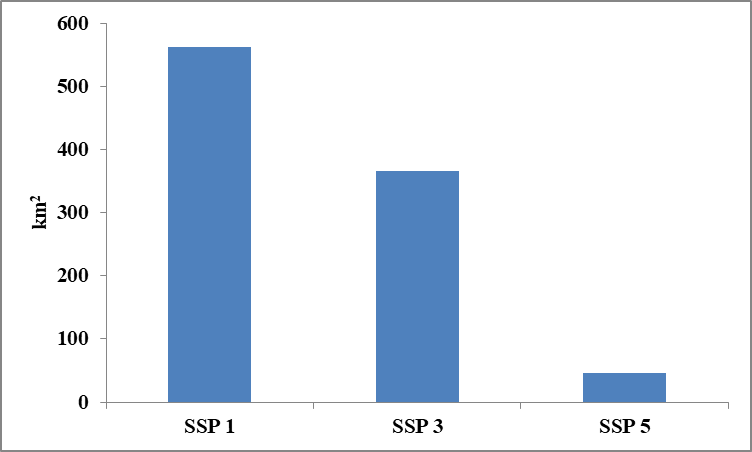
Figure 4 presents the potential distributions related to the SSP land use scenario in Bali Island. In SSP 1, the potential distribution is spanning from Lake Batur in the east to Bedugul and Lake Buyan in the west. The potential distribution areas are covering 5 districts, including Tabanan in the west, Buleleng in the north, Badung and Bangli in the central, and Karangasem in the east. The total suitable habitats under SSP 1 are about 564 km2, which equals to 9.75% of Bali Island area. Only small portions of areas in Karangasem District are considered not suitable or equal to 12 km2. SSP 3 scenarios have resulted in the reduction of potential habitats for O. monticola. The reduction of potential habitats under this scenario is 196 km2, which equals 34.75% of total suitable habitats. This massive potential habitat reduction under SSP 3 occurred in Bangli and Karangasem Districts. Under the SSP 5 scenario, the remaining suitable habitats were only sizing 46 km2, or equal to 8.15% of total suitable habitats as can be seen in Figure 5. The districts where the suitable habitats for O. monticola are still present are observed at the border of Tabanan and Buleleng districts, and another fragment was observed in Bangli District. Those remaining suitable habitats were nearby Lake Buyan in the west and Lake Batur in the east.
Figure 4. Estimated potential distributions of O. monticola related to SSP land use scenarios in Bali Island
Figure 5. Estimated areas of potential distributions for O. monticola in km2 related to SSP land use scenarios in Bali Island
3.3 Discussions
This study is the first to successfully elaborate land use in response to SSP scenarios. Large regions located between Lake Batur in the east and Bedugul and Lake Buyan in the west that fit the SSP 1 scenario for O. monticola were associated with intact vegetation. According to the current study utilizing SSP 1, the SSP 1 scenario, which is characterized by the existence of intact vegetation, was appropriate. Fan et al. [31] asserted that SSP 1 closely resembles a model that prioritizes ecological concepts and development, with a focus on green principles, while also implementing a sustainability scenario and minimizing land use changes. Because of this, the SSP 1 is well known for its ability to promote vegetation development, which leads to the ongoing expansion of vegetation covers and forests outside, and sustaining ecological balance and biodiversity, in particular amphibian species. The establishment of vegetation surrounding the deserted and urban areas is also crucial for supporting amphibian species. Besides that, the coexistence of urban growth, agricultural or silvicultural settings, and the preservation of intact land is emphasized in this SSP 1. Burrow and Maerz [32] confirmed that the presence of plant communities resulted from reforestation within deserted urban and agricultural areas can strongly contribute conversely to the distribution, abundance, and performance of amphibians in multiple direct and indirect ways. Corresponding to this, a region between Lake Batur in the east and Bedugul and Lake Buyan was a traditional urban settlement combined with agricultural or silvicultural areas that has prioritized and implemented reforestation and tree planting.
Land use scenarios under SSP 1 characterized by vegetation cover increases resulted from reforestation and tree planting even in settlement and agricultural areas [33] can be a significant predictor of amphibian richness or abundance where vegetation community composition measured in percent cover and stratification by height were positively correlated with amphibian richness. In these reforested areas, amphibians can move, breed, forage for food, and evade predators within the structural matrix that is provided by increasing plant coverings as regulated under SSP 1. Additionally, vegetation covers can have a significant impact on amphibians' biochemical environments and microclimates. Confirmed by Kurniawan et al. [12], the preferred habitats of O. monticola were tropical dry forest characterized by steeply sloping open areas with inclinations of 20° with or without layers of leaf litter. The preferred trees were tree stands separated about 5-7 meters apart. This study is comparable to a previous study by Kurniawan et al. [12], that also uses SDM. The significant differences are that this study progressed the use of SDM and combined it with the SSP scenario of land use. By using machine learning, this study advances in delineating the impacted areas at district levels.
The SSP 3 and SSP 5 confirm the reductions of potential distributions. This coincided with the particular SSP scenarios characterized by limited and even lack of land use change regulations followed by deforestations. In this study, Bangli District is the area that was impacted by the land use within SSP 3, and the reductions of potential distribution areas kept increasing within SSP 5. Despite habitat reductions, there are still potential habitats in the Bangli. This land use change condition is in agreement with current land use in Bangli. Anggraini et al. [34] reported that land use in Bangli was dominated by cropland, accounting for 29.92%. According to Wang et al. [35], cropland is a land use that has the potential to impact the distribution pattern of vertebrates, including amphibians, and this land use is also responsible for amphibian extinction. Study by Hansen et al. [36], confirming that cropland affects body condition and abundance of amphibians inhabiting croplands. The remaining habitats of O. monticola were observed in Bangli due to several conditions. First, despite land use changes, Bangli still has intact habitats, including community forests, state forests, and event swamps, which account for 8.32%, 25.9%, and 0.43%. In Bangli, the remaining intact habitats were observed nearby Batur Lake. This is also similar to remaining habitats in Tabanan and Buleleng nearby Buyan Lake. Areas surrounding Batur Lake are currently prioritized for conservation through several environmental management activities [37]. This conservation-based activity then has contributed to providing habitats for O. monticola and resulted in the reaming habitats of this species despite land use changes nearby.
According to the SSP modeling, land use change affected the potential distribution of O. monticola. In the future and regarding the limitations of this study, it is recommended that in the future to include the elevation and bioclimatic variables considering that the amphibian has affinity towards elevations and climates. The conservation strategies to preserve the habitats of O. monticola should be progressing on the protections of remaining vegetation covers, especially near Lake Buyan and Lake Batur. Ecotourism can be an option to reduce the land use conversion nearby those lakes. This sustainable tourism can provide alternative revenue for the community to stop them from altering the lands.
This research was funded by Department of Biology Education, Faculty of Mathematics and Natural Sciences Education, IKIP Saraswati.
[1] Evans, B.J., Brown, R.M., McGuire, J.A., Supriatna, J., Andayani, N., Diesmos, A., Iskandar, D., Melnick, D.J., Cannatella, D.C. (2003). Phylogenetics of fanged frogs: Testing biogeographical hypotheses at the interface of the Asian and Australian faunal zones. Systematic Biology, 52(6): 794-819. https://doi.org/10.1093/sysbio/52.6.794
[2] Reilly, S.B., Stubbs, A.L., Karin, B.R., Bi, K., Arida, E., Iskandar, D.T., McGuire, J.A. (2019). Leap-frog dispersal and mitochondrial introgression: Phylogenomics and biogeography of Limnonectes fanged frogs in the Lesser Sundas Archipelago of Wallacea. Journal of Biogeography, 46(4): 757-769. https://doi.org/10.1111/jbi.13526
[3] Amezquita, A., Lima, A.P., Jehle, R., Castellanos, L., Ramos, O., Crawford, A.J., Gasser, H., Hödl, W. (2009). Calls, colours, shape, and genes: A multi-trait approach to the study of geographic variation in the Amazonian frog Allobates femoralis. Biological Journal of the Linnean Society, 98(4): 826-838. https://doi.org/10.1111/j.1095-8312.2009.01324.x
[4] Kurniati, H. (2013). Vocalizations of Microhyla achatina Tschudi, 1838 (Anura: Microhylidae) from the foot hills of Mount Salak, West Java. Jurnal Biologi Indonesia, 9(2): 301-310.
[5] Driscoll, D.A., Bland, L.M., Bryan, B.A., Newsome, T.M., Nicholson, E., Ritchie, E.G., Doherty, T.S. (2018). A biodiversity-crisis hierarchy to evaluate and refine conservation indicators. Nature Ecology & Evolution, 2(5): 775-781. https://doi.org/10.1038/s41559-018-0504-8
[6] Ceballos, G., Ehrlich, P.R., Raven, P.H. (2020). Vertebrates on the brink as indicators of biological annihilation and the sixth mass extinction. Proceedings of the National Academy of Sciences, 117(24): 13596-13602. https://doi.org/10.1073/pnas.1922686117
[7] Cordier, J.M., Aguilar, R., Lescano, J.N., Leynaud, G.C., Bonino, A., Miloch, D., Nori, J. (2021). A global assessment of amphibian and reptile responses to land-use changes. Biological Conservation, 253: 108863. https://doi.org/10.1016/j.biocon.2020.108863
[8] Rimba, A.B., Atmaja, T., Mohan, G., Chapagain, S., Andi, A., Payus, C., Fukushi, K. (2020). Identifying land use and land cover (LULC) change from 2000 to 2025 driven by tourism growth: A study case in Bali. The International Archives of the Photogrammetry, Remote Sensing and Spatial Information Sciences, 43(B3): 1621-1627. https://doi.org/10.5194/isprs-archives-XLIII-B3-2020-1621-2020
[9] Indrawan, I.N.P., Trisasongko, B.H. (2022). Land use land cover change in Badung Regency, Bali. In IOP Conference Series: Earth and Environmental Science, 950(1): 1-10. https://doi.org/10.1088/1755-1315/950/1/012096
[10] Estoque, R.C., Ooba, M., Togawa, T., Hijioka, Y. (2020). Projected land-use changes in the Shared Socioeconomic Pathways: Insights and implications. Ambio, 49(12): 1972-1981. https://doi.org/10.1007/s13280-020-01338-4
[11] Marcer, A., Sáez, L., Molowny-Horas, R., Pons, X., Pino, J. (2013). Using species distribution modelling to disentangle realised versus potential distributions for rare species conservation. Biological Conservation, 166: 221-230. https://doi.org/10.1016/j.biocon.2013.07.001
[12] Kurniawan, N., Nugraha, F.A.D., Priambodo, B., Kurnianto, A.S., Fathoni, M., Septiadi, L. (2020). Ecology and colour variation of Oreophryne monticola (Anura: Microhylidae) with reference to vocalisation and predicted habitat suitability. Herpetological Bulletin, 151: 17-23. https://doi.org/10.33256/hb151.1723
[13] Riyanto, A. (2011). Herpetofaunal community structure and habitat associations in Gunung Ciremai National Park, West Java, Indonesia. Biodiversitas Journal of Biological Diversity, 12(1): 38-44. https://doi.org/10.13057/biodiv/d120108
[14] Zakaria, N., Allahudin, M.I.H., Ma'ad, S.N.S., Sulaiman, A.A., Abdullah, N.A., Zamri, M.I.M., Deraman, M.Y. (2022). Diversity amphibians and reptiles at Sungai Kerteh mangrove forest, Terengganu, Malaysia. Biodiversitas Journal of Biological Diversity, 23(11): 5574-5584. https://doi.org/10.13057/biodiv/d231105
[15] Kusrini, M. D. (2013). Panduan bergambar identifikasi amfibi Jawa Barat. Bogor: Fakultas Kehutanan IPB dan Direktorat Konservasi Keanekaragaman Hayati.
[16] Frost, D.R. (2021). Amphibian species of the world 6.1. American Museum of Natural History, New York, USA.
[17] Uetz, P., Freed, P., Hosek, J. (2021). The reptile database. http://www.reptile-database.org, accessed on Oct. 20, 2024.
[18] Riyanto, A., Rahmadi, C. (2021). Amphibian and reptile diversity of peleng island, banggai kepulauan, Central Sulawesi, Indonesia. Biodiversitas Journal of Biological Diversity, 22(5): 2930-2939. https://doi.org/10.13057/biodiv/d220558
[19] Thoha, A.S., Triani, H. (2021). A spatial model of forest and land fire vulnerability level in the Dairi District, North Sumatra, Indonesia. Biodiversitas Journal of Biological Diversity, 22(8): 3319-3326. https://doi.org/10.13057/biodiv/d220827
[20] Chen, M., Vernon, C.R., Graham, N.T., Hejazi, M., Huang, M., Cheng, Y., Calvin, K. (2020). Global land use for 2015–2100 at 0.05 resolution under diverse socioeconomic and climate scenarios. Scientific Data, 7(1): 320. https://doi.org/10.1038/s41597-020-00669-x
[21] Gao, J., O’Neill, B.C. (2020). Mapping global urban land for the 21st century with data-driven simulations and Shared Socioeconomic Pathways. Nature Communications, 11(1): 2302. https://doi.org/10.1038/s41467-020-15788-7
[22] Gao, J., O’Neill, B.C. (2021). Global one-eighth degree urban land extent projection and base year grids by SSP Scenarios, 2000-2100. Palisades, New York: NASA Socioeconomic Data and Applications Center. https://doi.org/10.7927/nj0x-8y67
[23] Dolci, D., Peruzzi, L. (2022). Assessing the effectiveness of correlative ecological niche model temporal projection through floristic data. Biology, 11(8): 1219. https://doi.org/10.3390/biology11081219
[24] Mao, M., Chen, S., Ke, Z., Qian, Z., Xu, Y. (2022). Using MaxEnt to predict the potential distribution of the little fire ant (Wasmannia auropunctata) in China. Insects, 13(11): 1008. https://doi.org/10.3390/insects13111008
[25] Khan, A.M., Li, Q., Saqib, Z., Khan, N., Habib, T., Khalid, N., Tariq, A. (2022). MaxEnt modelling and impact of climate change on habitat suitability variations of economically important Chilgoza Pine (Pinus gerardiana Wall.) in South Asia. Forests, 13(5): 715. https://doi.org/10.3390/f13050715
[26] Bivand, R. (2022). R packages for analyzing spatial data: A comparative case study with areal data. Geographical Analysis, 54(3): 488-518. https://doi.org/10.1111/gean.12319
[27] Lemenkova, P. (2020). Using R Packages' tmap','raster'and'ggmap'for dartographic visualization: An example of dem-based terrain modelling of Italy, Apennine Peninsula. Zbornik radova-Geografski fakultet Univerziteta u Beogradu, 68: 99-116.
[28] Hijmans, R.J., Guarino, L., Mathur, P. (2012). Diva-GIS Version 7.5 Manual. DIVA GIS. https://www.un-spider.org/sites/default/files/DIVA-GIS_manual_7.pdf, accessed on Oct. 20, 2024.
[29] Wei, B.O., Wang, R., Hou, K., Wang, X., Wu, W. (2018). Predicting the current and future cultivation regions of Carthamus tinctorius L. using MaxEnt model under climate change in China. Global Ecology and Conservation, 16: e00477. https://doi.org/10.1016/j.gecco.2018.e00477
[30] Nuringtyas, S.B. (2023). Kajian Kerusakan Lingkungan akibat Aktivitas Masyarakat pada Ekosistem Danau Batur Kabupaten Bangli Provinsi Bali. Doctoral dissertation, Universitas Gadjah Mada.
[31] Fan, H., Si, Q., Dong, W., Lu, G., Liu, X. (2023). Land use change and landscape ecological risk prediction in Urumqi under the Shared Socio-Economic Pathways and the Representative Concentration Pathways (SSP-RCP) Scenarios. Sustainability, 15(19): 14214. https://doi.org/10.3390/su151914214
[32] Burrow, A., Maerz, J. (2022). How plants affect amphibian populations. Biological Reviews, 97(5): 1749-1767. https://doi.org/10.1111/brv.12861
[33] Thompson, M.E., Nowakowski, A.J., Donnelly, M.A. (2016). The importance of defining focal assemblages when evaluating amphibian and reptile responses to land use. Conservation Biology, 30(2): 249-258. https://doi.org/10.1111/cobi.12637
[34] Anggraini, L.J., Ngadiyono, N., Bintara, S., Baliarti, E. (2021). Sustainability studies of smallholder livestock based on climatological conditions, land resources and farmer profile. In IOP Conference Series: Earth and Environmental Science, 667(1): 27-31. https://doi.org/10.1088/1755-1315/667/1/012091
[35] Wang, C.J., Wan, J.Z., Fajardo, J. (2021). Effects of agricultural lands on the distribution pattern of genus diversity for neotropical terrestrial vertebrates. Ecological Indicators, 129: 107900. https://doi.org/10.1016/j.ecolind.2021.107900
[36] Hansen, N.A., Scheele, B.C., Driscoll, D.A., Lindenmayer, D.B. (2019). Amphibians in agricultural landscapes: The habitat value of crop areas, linear plantings and remnant woodland patches. Animal Conservation, 22(1): 72-82. https://doi.org/10.1111/acv.12437
[37] Suyasa, I.W.B., Sudiartha, G.A.W. (2023). Environmental management strategies in controlling pollution of Batur Lake in Kintamani Bali Indonesia. Indian Journal of Applied Research. https://doi.org/10.36106/ijar/9110262