Emad Telfah Abdel Ghani![]() | Isam Mohammed Abdelhameed*
| Isam Mohammed Abdelhameed*![]() | Nese Yaman
| Nese Yaman![]()
© 2024 The authors. This article is published by IIETA and is licensed under the CC BY 4.0 license (http://creativecommons.org/licenses/by/4.0/).
OPEN ACCESS
The use of salt water for irrigation purposes has become widespread in the last fifty years, as it is available in many countries. The use of saline water as drainage water and saline groundwater is increasing because of climate change effects on both the quantity and quality of irrigation water, especially in arid and semi-arid areas. This research examined the effect of effective rainfall and leaching fraction on the productivity of four strategic crops when irrigated with medium salinity water from two different sources, groundwater was approved from two wells with a salt concentration of 5.43 dS m-1, and 8.39 dS m-1. Understanding the relationship between saline water use and relative yield under various field conditions of climate change, like effective rainfall ratio and leaching fraction, is very important to expand using saline water and decrease the water gap between demand and available water resources. A computer program was built to estimate the productivity of wheat, barley, maize, and cotton when irrigated by each of the two water sources mentioned under three values of leaching fraction and four ratios of effective rainfall. It was noticed that crop productivity is associated with a linear relationship with rainfall ratios, and nonlinear relationships with leaching fraction, as climate changes affects both the rainfall depth and the water quality, these relationships of crop yield must be taken into consideration for managing the agriculture projects in arid zones.
climate change, leaching requirements, water gap, effective rainfall, saline irrigation water
In arid and semi-arid zones, most water resources suffer from decreasing quantities and deterioration in their quality because of climate change and environmental pollution associated with continuous industrial and agricultural expansion. The water gap between demand and available fresh water is expanding [1].
The arid and semi-arid zones are suffering from severe climate change effects, decreasing renewable water resources and deterioration in its quality. Despite the significant expansion in the use of moderate saline water in irrigation in the last five decades [2], nevertheless, However, field management of industrial water still requires more research to reduce the risk of soil being affected by salinity, which costs humanity so much [3, 4].
The plants are varied in their salinity tolerance. All plants are affected by the osmotic potential in salinity degree named threshold point, these threshold points are varied from 1 dS/m for sensitive plants to more than 8 dS/m for high tolerant plants [5, 6]. The crops differed in salinity tolerance, and the lowest relative yield is economically acceptable when its yield is 50% of the greatest yield under the same conditions [7, 8].
Climate change has made its effects felt in different ways all over the world after the Industrial Revolution, it was stated that the world's average temperature has increased by 1.1℃ since this revolution. Climate change is sometimes felt through heavy rains and storms, sometimes causing serious production losses through long-term droughts. in the summer months, increasing temperatures, decreasing or absent precipitation, low relative humidity, and strong wind speed increase plant water consumption. For this reason, in most semi-arid regions, crop production cannot be carried out without irrigation during the summer months [9].
According to the climate changes, the water gap between demand and available water is expanded, and then many programs are introduced to increase using saline water in irrigation [10]. Dual Irrigation Technology (DIT) has been introduced, which divides the irrigation process into two stages, in the first stage the field is supplied with saline water to complete the advance face of surface irrigation, and then the field is irrigated by fresh water to complete the irrigation water requirements, and to reduce the impact of the salinity on the soil by forcing a saline water to move downward according to piston flow condition [11]. High frequency irrigation systems line trickle irrigation and sprinkler irrigation will be used to improve the irrigation efficiency and decreasing water losses [12, 13]. Summer and winter crops were selected in this model, leaching fraction (LF) values of 0.1 to 0.3 were used according to FAO criteria [3]. The water gap between rainfall and evaporation losses was increased according to climate changes, Table 1 explains that the ratio of the annually evaporation losses to the annually rainfall depth is increased from 12 to 19 in the last 50 years due to climate changes effects in arid-zone (Rutbah city in Iraq). Also, this table explains that the annually rainfall depth is about 10% of the summer crops and about 30% to 50% of some winter crops [14].
The current research aims to study the effect of both effective rainfall and leaching requirements on crop production by using saline irrigation water, increasing both rainfall and leaching requirements reduces soil salinity, then increases production according to the linear relationship between crop yield and the salinity developed by Maas and Hoffman [16].
Table 1. Annually average rainfall and evaporation at Rutba-Iraq, 1971-2010
|
Parameter |
Rainfall, mm |
Evaporation, mm |
|
Jan. |
22.7 |
55.6 |
|
Feb. |
21.2 |
81.6 |
|
Mar. |
24.6 |
122 |
|
Apr. |
23.9 |
202 |
|
May. |
7.2 |
296 |
|
Jun. |
0.01 |
378 |
|
Jul. |
0.0 |
420.7 |
|
Aug. |
0.0 |
402 |
|
Sep. |
0.01 |
354 |
|
Oct. |
6.7 |
234 |
|
Nov. |
13.0 |
116 |
|
Dec. |
23.0 |
61.3 |
|
Summation |
143.3 |
2722.9 |
Previous studies don’t discuss the effective rainfall with various Leaching Requirements (LR) on crop production, since these studies didn’t explain these very important climate and field conditions, this research dealt with proving these relationships and interpreting them mathematically, by building a computer program that calculates the production of four strategic crops, namely wheat, barley, cotton, and corn, which are irrigated with two different irrigation water salinity under various rainy conditions and different field management by choosing appropriate LR values. To reach optimal management of the use of alternative water resources and coexistence with the increasing shortage in freshwater resources due to the climate changes associated with agricultural and industrial expansion in the world.
The four selected crops mentioned differ in salinity tolerance, barley and cotton classified as salt-tolerant, wheat classified as medium tolerance to salinity, and maize being moderately salt-sensitive [17].
The irrigation water in this study is a groundwater pumped from two wells with a salt concentration of 5.43 dS m-1, and 8.39 dS m-1. This is a theoretical study by building a computer program.
It was assumed that the salinity of the water used for irrigation throughout the season can be calculated from the above equation as a weighted average of the salinity of irrigation water diluted with rainwater. Since there are summer rains in some countries, such as Yemen, effective rainfall has been calculated for summer crops as well (maize and cotton) and zero rainfall ratios have been adopted as one of the possible alternatives to represent the general conditions of summer crops in the region. Nevertheless, the percentages of zero, 10%, 30%, and 50% for active rainfall, these ratios were proposed according to the rainfall data of a period 1971-2010 (Table 1). The options for Leaching Requirements (LR) have adopted ratios of 0.1, 0.2, and 0.3 for each of the four crops mentioned. This represents the ratio of the depth of leaching water to the depth of irrigation water calculated based on the plant water consumption, as the leaching requirement expressed as a ratio, it also defined as Leachlin Fraction (LF) [18]. The crop yield is related to an inverse linear relationship with the salinity of the saturated paste of the soil, as explained in Eq. (2) [10].
$Y R=100-b\left(E C_e-a\right) \ldots$ if $E C_e>a$ (1)
$Y R=100$ if $E C_e<a$ (2)
YR: the relative yield (%).
b: the regression of the linear relationship between yield and irrigation water salinity.
a: salinity threshold value dS/m.
The salinity of the soil-saturated paste was calculated by using Eq. (3) [3].
$L R=E C_w \backslash\left(5 E C_e-E C_w\right)$ (3)
LR: Leaching Requirements (%).
ECe: electrical conductivity of saturated soil past, dS m-1.
The salinity of saturated soil paste was calculated from Eq. (3) for the different leaching treatment cases for both wells (5.43 dS m-1, and 8.39 dS m-1).
A computer program based on the linear relationship between crop yield and salinity was built. The rainwater was considered saline-free, and thus Eq. (4) was formulated to calculate the salinity of the final irrigation water assumed at the end of the agricultural season.
$E C_b=E C_w *(1-R F e)$ (4)
ECw, ECb: the electrical conductivity of irrigation water and rainfall diluted water, respectively, dS m-1.
RFe: the effective rainfall ratio, as a percentage of irrigation requirements.
The economically acceptable yield rate in irrigated agriculture is 50% or more of the maximum yield according to FAO standards [3]. Table 1 shows the relative yield values of the four crops irrigated with the water of both wells and the results of this table will be discussed as follows:
Tables 2 and 3 show that the use of water from the first well (W1) and second well (W2) in irrigation resulted in yield at economically acceptable ratios for both wheat and barley at leaching requirements of (0.2) even when there is no effective rainfall, the relative yield in this case is 66% for wheat and 86 for barley. These economical values were not achieved at leaching requirements of (0.1) except when active rainfall is available by half of the wheat water requirements, the relative yield value is 72%. As barley is more tolerant than wheat, it will add an economical relative yield under leaching requirements 0.1 with effective rainfall by 10% of its annual water requirements, the relative yield is 50%. For summer crops, maize and cotton, it is noticed the effect of the large variation in their salt tolerance on the relative yield under the same rainy conditions and for equal leaching requirements, where salt-tolerant cotton is located to a medium degree between wheat and barley, as it achieves acceptable yield at the minimum leaching requirement at the availability of effective rainfall to about 10% for well 1 (W1), the relative yield is 47% and its value raised to 68% under rainfall ratio 30% of its annual water requirements. In the absence of rain at appropriate active depths, the percentage of leaching requirements must be raised to 0.2 of the irrigation water requirements. The relative yield values are 84% and 53% for well 1 (W1) and W2 respectively.
Table 2. The relative yield as affected by leaching requirements and effective rainfall for the well W1
|
Crop |
Leaching Fraction (LF) |
Active Rainfall Ratio (RFe %) |
|||
|
0 |
10 |
30 |
50 |
||
|
Wheat |
0.1 |
1 |
15 |
44 |
72 |
|
0.2 |
66 |
73 |
89 |
100 |
|
|
0.3 |
78 |
92 |
100 |
100 |
|
|
Barley |
0.1 |
40 |
50 |
70 |
90 |
|
0.2 |
86 |
91 |
100 |
100 |
|
|
0.3 |
100 |
100 |
100 |
100 |
|
|
Cotton |
0.1 |
37 |
47 |
68 |
88 |
|
0.2 |
84 |
89 |
100 |
100 |
|
|
0.3 |
99 |
100 |
100 |
100 |
|
|
Maize |
0.1 |
0 |
0 |
0 |
1 |
|
0.2 |
0 |
3 |
29 |
55 |
|
|
0.3 |
26 |
36 |
55 |
73 |
|
Table 3. The relative yield as affected by leaching requirements and effective rainfall for the well W2
|
Crop |
Leaching Fraction (LF) |
Active Rainfall Ratio (RFe %) |
|||
|
0 |
10 |
30 |
50 |
||
|
Wheat |
0.1 |
0 |
0 |
0 |
33 |
|
0.2 |
23 |
35 |
59 |
83 |
|
|
0.3 |
56 |
65 |
82 |
100 |
|
|
Barley |
0.1 |
0 |
1 |
32 |
63 |
|
0.2 |
56 |
64 |
81 |
98 |
|
|
0.3 |
79 |
85 |
98 |
100 |
|
|
Cotton |
0.1 |
0 |
0 |
31 |
60 |
|
0.2 |
53 |
61 |
80 |
96 |
|
|
0.3 |
77 |
83 |
96 |
100 |
|
|
Maize |
0.1 |
0 |
0 |
0 |
0 |
|
0.2 |
0 |
0 |
0 |
0 |
|
|
0.3 |
0 |
0 |
19 |
48 |
|
For the maize crop, which is classified as a medium salinity sensitive crop, it is noticed that the water of the first well used in its irrigation is not valid except when there is active rainfall of not less than 30% of the annual water requirements with leaching requirements of 0.3. If rain is available by 50% of the maize needs, the leaching requirements necessary to achieve economic yield are reduced to only 0.2. The second well (W2) doesn’t reach an economical yield even if the maximum values of LR and Re are used. These results will encourage framers to use saline water of about 5dS/m (as the first well W1) to irrigate a wide range of crops sensitivity, use the high saline water (8Ds/m like W2) only for tolerance crops like barely, cotton and wheat.
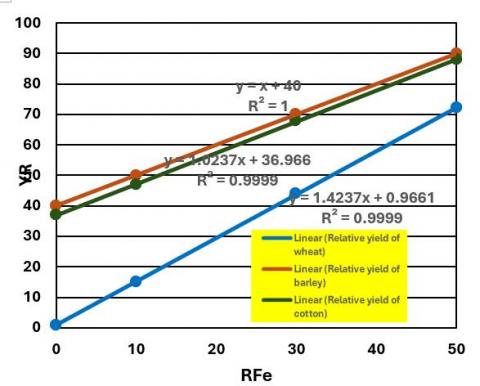
The relationship between relative yield and effective rainfall is drawn from Table 1 data. Figure 1 shows the linear relationship of barley yield when irrigated from the water of the second well (W2). According to Eq. (3), the relative yield values of 100% are excluded from the drawing because these percentages are not real but they are greater than 100. The linear relationship in Eq. (3) determined the relative yield values when the soil past salinity is less than the threshold value of a given crop, so the relative yield values of 100% will be neglected from the drawing of the different production relations shown in Figures 1 and 2.
When observing the decline of linear relationships between yield and effective rainfall ratio in Figure 1, it is found that there is an inverse nonlinear relationship between the slope of these relationships and the leaching fraction, where the slope of that linear relationship decreases with the increase in leaching values, the steepest slop is with lowest leaching value (0.1). Figure 2 explains this linear relation for tolerant crops, wheat, barley and cotton, as the wheat is less tolerance than barley and cotton, the yield for wheat is the lowest at the same ratios of rainfall ratios, consequently, the effect of effective rainfall of different leaching treatments on the crop yield decreases as effective rainfall rates increase.
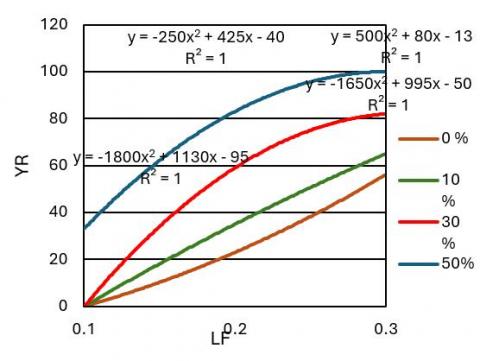
Figure 3 and Figure 4 explain the nonlinear inverse relationship between the relative yield and leaching requirement, this figure shows that the effect of leaching on the crop yield decreases with effective rainfall, as increased rainfall contributes to improved soil conditions. In both cases, the correlation values with yield ratios are very high, (R2 values are about 1) as shown in Figures 1, 2 and 3.
Figure 1. The relative yield (YR) verses effective rainfall ratio (RFe) for barely crop irrigated from second well for different LF values [19]
Figure 2. The linewr relation between YR and RFe for tollerant cropes (wheat, barley and cotton)
Figure 3. The relationship between yield (YR) and Leaching Requirements (LR) for cotton crops irrigated from the second well for two scenarios of effective rainfall ratios
Figure 4. The relation between YR and LR for all RFe ratios (0, 10, 30 and 50%)
Table 4. Relative yield (YR) of the four crops for different active rainfall ratio (RFe) coefficients (0-30)% at irrigation from the first well (W1) and the regression of the linear relationship (m) between yield and active rainfall ratio
|
Crop |
Leaching Fraction LF |
Active Rainfall Ratio (RFe %) |
|||||
|
0 |
10 |
30 |
|||||
|
RY,1 |
R |
RY,1 |
R |
RY,1 |
R |
||
|
Wheat |
0.1 |
1 |
14\10 |
15 |
29\20 |
44 |
28\20 |
|
0.2 |
66 |
7\10 |
73 |
11\20 |
89 |
11\20 |
|
|
0.3 |
87 |
5\10 |
92 |
|
100 |
|
|
|
Barley |
0.1 |
40 |
10\10 |
50 |
20\20 |
70 |
20\20 |
|
0.2 |
86 |
5\10 |
91 |
|
100 |
|
|
|
0.3 |
100 |
|
100 |
|
100 |
|
|
|
Cotton |
0.1 |
37 |
10\10 |
47 |
21\20 |
68 |
20\20 |
|
0.2 |
84 |
5\10 |
89 |
11\20 |
100 |
|
|
|
0.3 |
99 |
|
100 |
|
100 |
|
|
|
Corn |
0.1 |
0 |
|
0 |
|
0 |
|
|
0.2 |
0 |
|
3 |
26\20 |
29 |
26\20 |
|
|
0.3 |
26 |
10\10 |
36 |
19\20 |
55 |
18\20 |
|
Table 2 and Table 3 show the decline of linear relationships between yield and active rainfall percentage when irrigating with the water of the first well and the second well respectively. Where the regression is calculated from the result of dividing the change in yield by the change in the active rainfall ratio, for example, in the first line of Table 4, the regression is calculated by subtracting yield at active rains equal to zero of yield at 10% rain and dividing the result by the increase in the active rainfall percentage of 10%, and Eq. (5) below shows the calculation of regression:
$R=d Y R \backslash d R F_e$ (5)
R: Regression of the linear relationship between yield and active rainfall ratio.
d YR, d RFe: variation in relative yield and variation in leaching requirements and variation respectively.
The yield values of 0% were neglected as well as the yield of 100% of the calculations, where the first digit does not mean that there is yield, while 100% means that the linear relationship between yield and salinity may give a value greater than 100%, but Eq. (3) modified the result. For the same reason, the yield values of 100% are excluded from the relationship graph in Figures 1 and 2.
In Tables 4 and 5, it is noticed that the relationship regression for all leaching requirements for the given crop is stable with merging and possibly matching to the slopes of that relationship for crops with close salt tolerance such as barley and cotton at all the leaching requirements that have been selected and for both types of water used from the two wells. It is also noticed that the decline of this relationship decreases as the leaching requirements increase and that this decrease is non-linear. For example, the slope in Table 5 for barley and cotton decreases from 20/31 at leaching requirements of 0.1 to 20/17 at leaching requirements of 0.2, then decreases to 20/13 at leaching requirements of 0.3, and so on for wheat and corn in Tables 4 and 5.
A significant decrease in the regression of the relationship is observed at the first increase in the leaching requirements (by 0.1) followed by a smaller decrease when the leaching requirements are increased by the same percentage and for all the experiment treatments.
These results help decision makers to select the areas that can be irrigated by saline water, and to select the crops that can give economical relative yield (YR) according the water quality and the rainfall depth.
Table 5. Relative yield of the four crops for the different active rainfall ratio (RFe) treatments (10-50)% when irrigating from the second well (W2), and the regression of linear relationships (m) between yield and active rainfall ratio
|
Crop |
Leaching Fraction LF |
Active Rainfall Ratio (RFe %) |
|||||
|
10 |
30 |
50 |
|||||
|
R |
RY,2 |
R |
RY,2 |
R |
RY,2 |
||
|
Wheat |
0.1 |
|
0 |
|
0 |
|
33 |
|
0.2 |
12\10 |
35 |
24\20 |
59 |
24\20 |
83 |
|
|
0.3 |
9\10 |
65 |
17\20 |
82 |
18\20 |
100 |
|
|
Barley |
0.1 |
|
1 |
31\20 |
32 |
31\20 |
63 |
|
0.2 |
9\10 |
64 |
17\20 |
81 |
17\20 |
98 |
|
|
0.3 |
6\10 |
85 |
13\20 |
98 |
|
100 |
|
|
Cotton |
0.1 |
|
0 |
|
31 |
32\20 |
60 |
|
0.2 |
|
61 |
|
80 |
17\20 |
96 |
|
|
0.3 |
6\10 |
83 |
13\20 |
96 |
|
100 |
|
|
Corn |
0.1 |
|
0 |
|
0 |
|
0 |
|
0.2 |
|
0 |
|
0 |
|
0 |
|
|
0.3 |
|
0 |
|
19 |
29\20 |
48 |
|
The relationship between relative yield and Leaching Requirement (LR): Figure 2 shows the nonlinear relationship between yield and leaching requirement drawn from data in Table 2 for cotton crops when irrigated with water from the second well (W2), although the increase in both rainfall and leaching contributes to reducing soil salinity and improving yield according to a linear relationship between yield and salinity, but this improvement in yield was greater when leaching fraction increased with a nonlinear relationship needs to be explained. This nonlinear relationship will be discussed in this article by trying to solve Eqs. (1) to (3) instantaneously by substituting its values (EC) in Eq. (4) with its equivalent from Eq. (3) after simplifying it to the formula below:
$E C_\rho=E C_w(1+L R) \backslash(5 * L R)$ (6)
When expressing the regression of the linear relationship between yield and salinity, as shown in Figure 2 in the following mathematical formula:
$\mathrm{b}=\mathrm{dYR} \backslash d E C_e$ (7)
When substituting Eqs. (6) and (7) into Eq. (2) and simplification, we get:
$\mathrm{YR}=100-\left[d Y R \backslash d E C_e\right] *\left\{\left[E C_w(1+L R) \backslash 5 * L R\right]-a\right\}$ (8)
It is known that there is an approximate linear relationship between the salinity of irrigation water and the salinity of the extract of saturated soil paste. Tanwar [20] expressed this relationship in the mathematical formula shown in Eq. (9), when considering the distribution of soil water consumption as 10, 20, 30, and 40 of the four quadrants of the soil profile depth respectively:
$E C_e=1.5 E C_w$ (9)
Therefore, this relationship can be expressed for different field management formulas by the following equation:
$E C_w=C_1 E C_e$ (10)
C1 is a constant equal to 1.5 if the distribution of water consumption from soil depth is adopted in the above proportions. The threshold of salinity susceptibility a can also be expressed in the form below:
$a=C_2 E C_e$ (11)
$C_2=1 \ldots \ldots \ldots \ldots \ldots E C_e=a$
$C_2>1 \ldots \ldots \ldots \ldots \ldots E C_e<a$
$0<C_2<1 \ldots \ldots \ldots \ldots \ldots E C_e>a$
Substituting Eqs. (10) and (11) into Eq. (8) gives the following relationship:
$\begin{aligned} & \mathrm{YR}=100-\left[d Y R \backslash d E C_e\right] \\ & *\left\{\left[C_1 E C_e(1+L R) \backslash 5 * L R\right]\right. \\ &\left.-C_2 E C_e\right\}\end{aligned}$ (12)
Simplifying the above equation gives us the following formula:
$\mathrm{YR}=100-d Y R\left[E C_e \backslash d E C_e\right]\left\{\left[C_3(1+L R) \backslash L R\right]-C_2\right\}$ (13)
Thus, Eq. (13) explains the theoretical basis of the non-linear relationship between relative yield and leaching fraction, which is shown in Figure 2 for the cotton crop irrigated with the water of the second well for two rainfall ratios of 10% and 30%.
It is also noticed that the curves of nonlinear relationships between the leaching fraction and yield in Figure 2 join from each other whenever the leaching fraction is increases, as the difference in relative yield using the two different sources decreases with the increase in leaching fraction, meaning that the impact of leaching on yield decreases with increasing leaching fraction, which needs for thinking about the possibility of an optimal leaching factor that achieves optimal yield per unit volume of water [21].
This research dealt with the study of the climate changes effects on water quantity and quality. The decreasing in rainfall quantities is expressed in this study as a ratio of rainfall to the crop water requirements, the effect of both rainfall and leaching requirements on the yield of crops irrigated by moderate saline water that pumped from two wells, the salinity of the first well is 5.42 dS m-1, while the salinity of the second well is 8.39 dS m-1. A computer program was built to calculate the yield of four strategic crops for four effective rainfall rates and three values of leaching requirements. It was found that this water can be used to irrigate tolerant crops (barley and cotton) with high relative yield values. The most important conclusions are:
This paper recommends to expanding field studies in using saline water to irrigate a wide range of crops (varied salinity tolerance) and for long periods of time to observe the steady state salinity effects on soil and crops.
[1] Al-Salihi, Z.A., Kamel, A.H., Abdulhameed, I.M. (2024). Effect of climate changes on water resources in Iraq: A review study. In AIP Conference Proceedings, 3009: 030079. https://doi.org/10.1063/5.0190474
[2] Sameer, M., Alhadeethi, I.K., Abdulhameed, I.M. (2024). Crop factor of maize (Zea mays L.) and its relationship to the salinity of irrigation water. IOP Conference Series Earth and Environmental, 1371: 082016. https://doi.org/10.1088/1755-1315/1371/8/082016
[3] Rhoades, J.D., Kandish, A., Mashali, A.M. (1992). The use of saline waters for crop production. FAO Irrigation and Drainage Paper 48. Food and Agriculture Organization of the United Nations, Rome, Italy 1992.
[4] Abdulhameed, I.M., Malloki, H.N. (2021). Saline irrigation water matrix (siwm) to optimize crop productivity: - (A review). In IOP Conference Series: Earth and Environmental Science, 779(1): 012025. https://doi.org/10.1088/1755- 1315/779/1/012025
[5] Maas, E.V. (1993). Testing crops for salinity tolerance. In Proc. Workshop on Adaptation of Plants to Soil Stresses. Lincoln, NE: University of Nebraska, 94: 234-247.
[6] Abdulhameed, I.M., Sonay Sozudogru, O.K., Malloki, H.N., Akca, M.O., Omar, B., Cayci, G. (2022). Bio-saline agriculture modeling, using saline water for irrigation purposes. International Journal of Design & Nature and Ecodynamics, 17(6): 951-956. https://doi.org/10.18280/ijdne.170617
[7] Kim, H., Jeong, H., Jeon, J., Bae, S. (2016). Effects of irrigation with saline water on crop growth and yield in greenhouse cultivation. Water, 8(4): 127. https://doi.org/10.3390/w8040127
[8] Abdulhameed, I., Sonay zudogru OK, S., Çayci, G., Akça, M., Malloki, H., Omar, B. (2024). Cultivating sustainable green belts with ADW and RWH in Iraq's arid zones. International Journal of Sustainable Development and Planning, 19(1). http://doi.org/10.18280/ijdne.190107
[9] Yaman, N., Abdulhameed, I.M. (2024). Climate change challenges in irrigation and agriculture in arid and semi arid regions. In 11th JEEP International Scientific Agribusiness conference-MAK 2024, Serbia, 11: 79-91.
[10] Al-Salihi, Z.A., Kamel, A.H., Abdulhameed, I.M. (2022). Effect of climate change on the Tigris river basin in Iraq. International Journal of Design & Nature and Ecodynamics, 17(4): 585-593. https://doi.org/10.18280/ijdne.170413
[11] Aljumaily, A.M., Alhadithy, I.M. (2008). Dual Irrigation Technology (DIT) under surface irrigation system. Al-Rafidain Engineering Journal (AREJ), 16(4): 53-60.
[12] AL-issawi, H.H.E., Al-Abaied, A.A.W.I., Hameed, I.M.A. (2021). Evaluation of mobile trickle irrigation and sub-surface nanotechnology trickle irrigation by irrigating bean (cv. Veto). IOP Conference Series: Earth and Environmental Science, 779(1): 012016. https://doi.org/10.1088/1755-1315/779/1/012016
[13] Abdulhameed, I.M., Sulaiman, S.O., Najm, A.B.A., Al-Ansari, N. (2022). Optimising water resources management by using Water Evaluation and Planning (WEAP) in the West of Iraq. Journal of Water and Land Development, 53(IV-VI): 176-186. https://doi.org/10.24425/jwld.2022.140795
[14] Ahmed, A.D., Abdulhameed, I.M., Ghani, E.T.A., Ibrahim, M.K. (2020). Selection of water harvesting sites in Horan valley. IOP Conference Series: Materials Science and Engineering, 881(1): 012183. https://doi.org/10.1088/1757-899X/881/1/012183
[15] Bhatt, R., Oliveira, M.W., Santos, D.F. (2023). Irrigation water-Quality issues, limits, and way forward. DELOS: Desarrollo Local Sostenible, 16(47): 2941-2961. https://doi.org/10.55905/rdelosv16.n47-026
[16] Maas, E.V., Hoffman, G.J. (1977). Crop salt tolerance-current assessment. Journal of the Irrigation and Drainage Division, 103(2): 115-134. https://doi.org/10.1061/JRCEA4.0001137
[17] Rhoades J.D. (1984). Using saline waters for irrigation. Proc. In: Skaggs, R.W., Schilfgaarde, J.V. (eds), Agricultural Drainage. https://doi.org/10.2134/agronmonogr38.c18.
[18] Najm, A.B.A., Abdulhameed, I.M., Sulaiman, S.O. (2020). Water requirements of crops under various Kc coefficient approaches by using Water Evaluation and Planning (WEAP). International Journal of Design & Nature and Ecodynamics, 15(5): 739-748. https://doi.org/10.18280/ijdne.150516
[19] Abdulhameed, I.M. (2017). Maximizing irrigation water productivity by optimizing leaching fraction. Journal of Agricultural Science and Technology A, 7(2017): 73-80. https://doi.org/10.17265/2161-6256/2017.02.001
[20] Tanwar, B.S. (2003). Saline water management for irrigation (3rd revised draft). Work Team on Use of Poor Quality Water for Irrigation (WTPQW), International Commission on Irrigation and Drainage (ICID), New Delhi, India.
[21] Ning, S., Zhou, B., Wang, Q., Tao, W. (2020). Evaluation of irrigation water salinity and leaching fraction on the water productivity for crops. International Journal of Agricultural and Biological Engineering, 13(1): 170-177.