Aya Mudher Ghayeb![]() | Khalid Sabbar Mohammed*
| Khalid Sabbar Mohammed*![]()
© 2024 The authors. This article is published by IIETA and is licensed under the CC BY 4.0 license (http://creativecommons.org/licenses/by/4.0/).
OPEN ACCESS
This study aims to calculate the amount of surface water runoff suitable for water harvesting in Al-Shagrah valley basin in the western desert of Anbar, because this study will have positive effects on the study area if implemented, which suffers from water shortages. So the study utilized modern geographic technologies (GIS&RS) and the SCS-CN statistical model, known for accurately determining results related to water harvesting systems. The study focused on the main two factors (land covers, hydrological soils). So the study result indicated that the study area has five different land covers and two types of hydrological soils classified as (B-C) soils using LANDSAT visual satellite imagery with a resolution of (30×30) and the Supervisor Classification technique. The study identified eight CN values ranging from 69 to 91. By analyzing data from the four parameters (S-La-Q-QV) and integrating them using the ArcGIS 10.8 software, it was determined that four earthen dams could be built with a storage capacity of (5,388,300) m3 of water. These results support future developmental projects in the area.
surface runoff, water harvesting, Al-Shagrah valley, SCS-CN, modern technologies
Arid and semi-arid regions are characterized by harsh climatic conditions, marked by high evaporation rates and low levels of rainfall. In desert areas, irregular and intense rain showers below 150-200m are common during certain seasons [1]. This is primarily due to factors such as evaporation, seepage, and significant water loss through surface runoff, as well as the absence of a consistent water source in the study area. Water plays a crucial role in agriculture, particularly in Arab countries where it is considered a limiting factor. Therefore, water harvesting can serve as an effective solution to supplement water resources [2]. This method involves collecting and storing water for agricultural use, livestock, or even as drinking water after proper treatment. The current study aims to assess if the terrain and climate conditions in Al-Shagrah valley basin are suitable for water harvesting purposes. Water harvesting technology refers to a series of scientific and technical techniques used to capture and retain runoff water from rainfall for various beneficial uses [3]. It encompasses any process or procedure applied to the land to maximize the utilization of rainwater. The collection of surface runoff water can be done either directly by storing it for human activities or indirectly by allowing the soil to retain more water to minimize runoff. The importance of the study came for the region because there are no or few other water sources, such as groundwater or surface water [4].
In this case, it becomes the most effective means of securing the lives of humans, animals and plants.
Rainfall is one of the most important sources of water in arid and semi-arid environments.
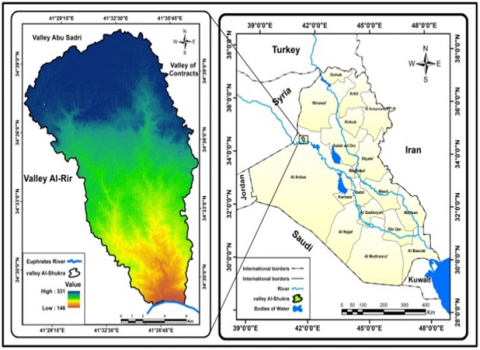
Figure 1. Location of Al-Shagrah valley basin in Anbar Governorate, Iraq
Source: Republic of Iraq, Ministry of Industry and Minerals, General Establishment for Geological Survey and Mineral Investigation, Geological Map, 2000, Scale 1:250000 Arc map
To run off surface water and replenish groundwater reserves, and therefore rainwater harvesting technology becomes more suitable for supporting water resources. Although water harvesting operations are linked to some factors that cannot be controlled, such as climatic conditions and soil type [5]. However, making good use of the available rainwater, no matter how small, will provide basic sources of water in some cases. For this reason, the process of harvesting water in the Wadi Al-Shukra basin will be discussed, because of the importance of these rains in the success of winter agriculture and human settlement [6]. Therefore, the objective of the research is to calculate the amount of surface runoff and pinpoint suitable locations for storing seasonal water to aid in the development of the valley basin in the future. Al-Shagrah valley basin is situated geographically between latitudes 34°28'47"N and 34°40'41"N to the north and longitudes 41°27'9"E and 41°37'43"E to the east. In terms of its spatial location, it is positioned in the western region of Iraq, within the western part of the Western Plateau in Anbar Governorate, covering an area of 205km2 as illustrated in Figure 1.
2.1 Geology of the study area
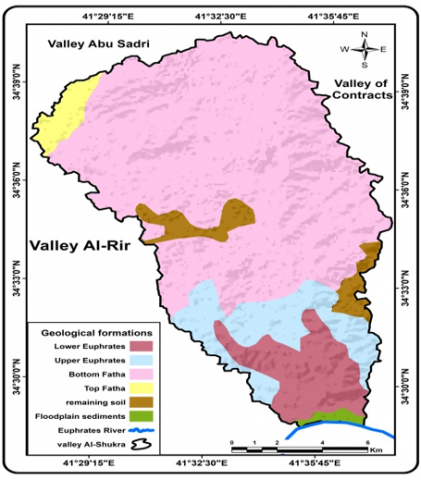
The research area is made up of multiple geological formations dating back to the Miocene era. The Miocene era comprises four formations, one of which is the Euphrates Formation lower member covering the southern part of the study area in an arc shape extending from east to west [7]. This lower member also occupies a significant portion of the northern and northwestern parts of the study area with a thickness ranging from 80 to 100 meters. Additionally, it is visible in the northern part of the study area with a thickness of 55-75 meters and covers the western and eastern parts as narrow strips. The Euphrates Formation lower member is also present along the river in the southernmost area with a thickness of 1-2 meters, by explaining the geological characteristics, the study area is suitable for water harvesting operations, because it is free of faults, fissures and crevices. The region is also characterized by its high porosity, in some areas with highly permeable sandy soils, and there are some areas characterized by high clay soils that enhance water flow on the surface towards the watersheds, especially at the feet of the mountains (see Figure 2) [8].
Figure 2. Geological formations of study area
Source: Republic of Iraq, Ministry of Industry and Minerals, General Establishment for Geological Survey and Mineral Investigation, Geological Map, 2000, scale 1:250,000. Arc Map 10.4.1.
2.2 Land slope
Studying the slope of the land plays a significant role in analyzing the flow of surface water, including its speed, drainage patterns, erosion potential, and sedimentation processes. In the study area, three categories of slopes are identified [9]:
Category 1: The largest category, consisting of nearly flat lands covering an area of 135km2 (65.9% of the study area) with slope angles ranging from 0 to 2 degrees.
Category 2: Lands with a slightly steeper slope, ranging from 2 to 5 degrees, occupying 64km2 (31.2% of the study area) following the first category.
Category 3: Represented by lands with gentle slopes ranging from 5 to 10 degrees, covering an area of 6km2 (2.9% of the study area). Through the slope data, we find that the study area is suitable for water harvesting operations, as most of it is mild to moderate, with a slope of 0-5 degrees, at a rate of 99.6%, with an area estimated at 199km2 of the total study area, which represents the first and second categories of slope. Therefore, most of the study area has good water flow for water harvesting purposes and without causing damage to the land [10].
2.3 Climate
Table 1. Monthly averages and general average temperature (degrees Celsius) at the two stations in the study area for the period (1990-2020)
|
The Station Months |
AL-Qaim |
Anna |
|
Temperature (℃) |
Temperature (℃) |
|
|
January |
7.7 |
8 |
|
February |
9.8 |
9.9 |
|
March |
14.8 |
14.2 |
|
April |
20.5 |
20.4 |
|
May |
25.6 |
26.0 |
|
June |
30.4 |
30.4 |
|
July |
32.7 |
33.4 |
|
August |
32.1 |
32.5 |
|
September |
28.4 |
28.8 |
|
October |
23.0 |
22.6 |
|
November |
14.8 |
14.5 |
|
December |
9.4 |
9.7 |
|
Average |
20.8 |
20.9 |
Source: Ministry of Transport and Communications, Iraqi General Authority for Meteorology and Seismic Monitoring, Mach Department, average daily temperature records.
Climate refers to the examination of natural phenomena occurring in the lower atmosphere and how they interact with the Earth's natural covers, resulting in temperature changes near the Earth's surface. These natural events cause variations in rainfall, wind speed and direction, and atmospheric pressure, leading to differences in climate from one location to another. Elements of climate like temperature, solar radiation, wind, rain, and evaporation have a direct or indirect impact on various hydrogeomorphological processes [11]. Understanding the climatic characteristics of a basin is crucial in order to comprehend how they shape its hydrological and geomorphological traits. To achieve this, data from Al-Qaim and Anah stations for the time span of 1990 to 2020 must be analyzed [12]. The importance of the climatic analysis of the study area came from the fact that there is an urgent need to implement water harvesting technology for the study area due to its climate extremes in two different periods, the first being hot and dry for 7 months during the summer, and the second period being rainy and cold for 4 months. We need a technology that reduces the harshness and dryness of summer. By storing and collecting rain that falls during the winter period, which may reach torrential torrents (Tables 1, 2) [13].
Table 2. Monthly average and annual total rainfall for the two stations in the study area (1990-2020)
|
Months |
AL-Qaim |
Anna |
|
January |
26.0 |
28.2 |
|
February |
22.7 |
21.8 |
|
March |
25.4 |
27.7 |
|
April |
13.4 |
11.9 |
|
May |
4.0 |
3.1 |
|
June |
0.0 |
0.0 |
|
July |
0.0 |
0.0 |
|
August |
0.0 |
0.0 |
|
September |
0.0 |
0.0 |
|
October |
9.1 |
11.7 |
|
November |
19.2 |
20.3 |
|
December |
20.0 |
21.2 |
|
Total |
139.8 |
145.9 |
Source: Ministry of Transport, Iraqi Meteorological and Seismic Monitoring Authority, Climate Department, unpublished data, 2020.
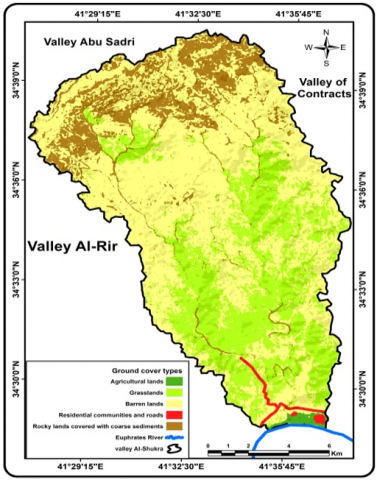
It consists of actual, physical characteristics and occurrences found on the Earth's surface. To study the land cover of Al-Shagrah valley basin, the researchers used satellite imagery (LANDSAT) with high precision (30*30) using Supervised Classification technology. This involves categorizing digital image units based on their similarity into spectrally homogeneous groups. Apart from observations during the field trip, the research area was divided into five categories, as displayed in Figure 3 and Table 3 [14]:
Table 3. Land cover types in the study area
|
Ground Cover Types |
Area/km2 |
Percentage |
|
Grasslands |
59 |
28.8% |
|
Barren lands |
114 |
55.6% |
|
Rocky terrain covered with coarse sediments |
27 |
13.2% |
|
Agricultural lands |
3 |
1.5% |
|
Residential communities and roads |
2 |
1.0% |
|
Total |
205 |
100.0% |
(Scs, U. S. (1992). Soil Conservation Service: Urban hydrology for small watersheds. Technical Release, 77, 2004.)
(1) Agricultural lands can be seen as a strip located in the southern part of the study area along the Euphrates River, covering 3km2 which accounts for 1.5% of the total basin area.
(2) Grasslands are predominantly found in the central and southern regions, indicated by a light green color, covering 59km2 and making up 28.8% of the basin area, ranking second in terms of coverage.
(3) Barren lands are widespread across most of the basin, depicted in yellow, covering 114km2 which represents 55.6% of the total basin area. These lands lack vegetation due to water scarcity and soil degradation; however, they play a positive role in facilitating surface runoff without hindering water absorption or evaporation.
(4) Residential communities and roads are situated in the southern parts of the study area, marked in red, covering 2km2 which accounts for 1% of the total basin area.
(5) Rocky terrains filled with rough sediments: This category can be found in the northern and northeastern regions of the research site, encompassing 27 square kilometers and accounting for 13.2% of the basin's total area. The terrain is characterized by loose sediments that have been eroded by water and wind, as well as an incline that accelerates water flow and causes sediment to be carried away and dispersed throughout the valley floor [15].
Figure 3. Land cover of the study area
Source: Satellite visual image from the American satellite (Landsat) with a resolution of 30×30, based on the ARC GIS 10.8 program.
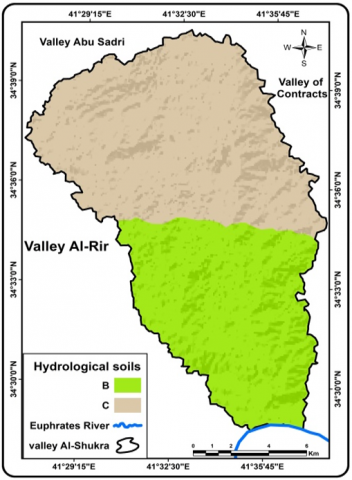
Soil quality is a crucial factor in determining the amount of surface runoff. The US Soil Service System categorizes soils into four hydrological groups (A.B.C.D) based on their permeability and porosity, as shown in Table 4. Permeability of soil indicates how much soil texture affects surface runoff [16].
The hydrological soil aggregates in Figure 4 shows that there are two main types of soil present: B and C. The study area is divided into northern and southern regions, which will be further explained.
(1) Hydrological group (B):
These types of soils can be located in the southern part of the valley close to the Euphrates River and cover an area of 88 square kilometers, which accounts for 42.7% of the total basin area. They are sandy, of moderate depth, and have a rough to medium-coarse texture, made up of a combination of gravel, rock pieces, and boulders connected by organic materials [17].
(2) Hydrological group (C):
This specific type of soil covers an expanse of 117 square kilometers, accounting for 57.3% of the entire basin area. The distinctive feature of this soil is its high surface runoff rates caused by its limited infiltration capacity, resulting from its clay and silt composition. This hinders water penetration into the soil, leading to seasonal river flooding. These soils were formed under dry climatic conditions.
Rainfall and insufficient water to dissolve the salts and remove them by the filtration process, i.e. in areas which the amount of evaporation exceeds the amount of precipitation, therefore one of its most important characteristics is the lack of materials organic matter or its absence and the accumulation of basic salts on or near the surface .So it stands out in light colours with the appearance of some other colours such as red, brown, yellow and grey resulting from the prevailing rock colours there. Infiltration and seepage depend on the amount of rainfall falling, its concentration, and the texture of the soil its thickness and previous moisture, as well as the degree of slope and roughness of the surface [18].
Table 4. Hydrological soil classifications according to the (SCS) method
|
Soil Classification |
Flow Depth |
Soil Characteristics |
|
A |
little |
Deep sandy layer with a very small amount of clay |
|
B |
Middle |
A Sand layer of less depth than the first type with moderate infiltration |
|
C |
Above average |
Clay layer of limited depth with below average infiltration rate |
|
D |
High |
A Clay layer with a high swelling layer of fine soil close to the surface |
(Scs, U. S. (1992). Soil Conservation Service: Urban hydrology for small watersheds. Technical Release, 77, 2004.)
Figure 4. Hydrological soil types for the study area
Source: Satellite visualization of the American Landsat satellite with a capacity of 30×30, based on the ARC GIS 10.8 program.
5.1 Building a water harvesting model (SCS-CN)
The region under study is experiencing a scarcity of water as a result of the arid desert climate. This climate is characterized by seasonal precipitation that quickly drains away due to surface runoff, evaporation, and seepage, resulting in minimal benefit. Estimating the amount of water that can be collected from rainwater is a crucial aspect of researching water harvesting and its application in various human activities [19]. Various methods are employed to calculate the volume of surface runoff in water catchment areas. One such method is the SCS-CN equation, a mathematical formula that is widely regarded as accurate and important in estimating surface runoff volume. This equation was developed by the US Soil Conservation Service, a branch of the Department of Agriculture in the United States. The SCS-CN method relies on certain data inputs, such as land cover, hydrological soil characteristics, vegetation type, and precipitation levels [20].
5.2 Extracting (CN) values for the valley basin
Figure 5. The extracted (CN) values for the study area
Source: Satellite visualization of the American Landsat satellite with a capacity of 30×30, based on the ARC GIS 10.8 program.
CN values indicate the capacity of the soil and land cover to soak up water and their permeability. These values are inversely related to surface permeability. When CN values are higher, there is increased surface runoff, especially when the surface permeability is low [21]. CN values range from 0 to 100, with lower values indicating high permeability and the ability to absorb all precipitation. Conversely, higher values closer to 100 suggest impermeable surfaces where rainfall transforms into surface runoff [22]. Al-Shagrah valley basin has a total of 8 CN values, ranging from 69 to 91 as illustrated in Table 5 and Figure 5. The largest area was covered by value 86, totalling 75.63km2, accounting for 36.87% of the area. Value 79 came in second with 43.62km2, or 21.26%, followed by value 91 with 40.21km2, or 19.60%. Value 85 covered 25.40km2, representing 12.38%. Value 69 covered 15.91km2, making up 7.75%, and value 90 covered 1.66km2, or 0.80%. Value 74 covered 1.32km2, or 0.64%, and value 89 covered 1.26km2. with a percentage of (0.61%), which is the lowest value recorded in the study area.
Table 5. CN values extracted for the study area
|
Values |
Area (Km2) |
Ratio (%) |
|
69 |
15.91 |
7.75% |
|
74 |
1.32 |
0.64% |
|
79 |
43.62 |
21.26% |
|
85 |
25.40 |
12.38% |
|
86 |
75.63 |
36.87% |
|
89 |
1.26 |
0.61% |
|
90 |
1.66 |
0.80% |
|
91 |
40.21 |
1.60% |
|
Total |
205 |
100% |
Source: The researchers based on Figure 6.
High values of CN in the region suggest that there is a high level of surface water runoff, implying that the soil has low permeability and limited water retention capacity. This is a favourable sign for the potential success of water harvesting initiatives in Al-Shagrah valley basin. The equations used in the SCS-CN method represent the mathematical relationship as follows [23]:
$\begin{gathered}S=\frac{25400}{\mathrm{CN}}-254 \\ L a=0.2 * \mathrm{~S} \\ Q=\frac{(\mathrm{P}-\mathrm{La})^2}{\mathrm{P}-\mathrm{La}+\mathrm{S}} \\ Q V=(Q * A / 1000)\end{gathered}$
Q represents the depth of runoff, measured in inches.
P represents the amount of rain that falls, measured in inches.
La represents the initial abstractions before surface runoff begins, including evaporation, seepage, and vegetation.
S represents the surface accumulation after the runoff has started, measured in inches.
A represents the area in square kilometers.
5.3 Calculating the water retention coefficient after the start of surface runoff (S)
The factor (S) represents the condition of the soil when fully saturated with water following rainfall and the occurrence of surface runoff. Essentially, it signifies the maximum capacity of the soil to hold water once surface runoff begins. The depth of the water-saturated layer can vary depending on the soil type and its water absorption capabilities [24]. The factor (S) is also influenced by the prevailing vegetation in the region. In the specific area under examination, values of (S) nearing zero suggest a decline in the soil's water retention post-surface runoff, while elevated values indicate an improvement in the soil's water-holding capacity leading to a decrease in surface runoff, as shown in Figure 6 [25].
Figure 6. Values (S) mm for the basin of the study area
Source: Satellite visualization of the American Landsat satellite with a capacity of 30×30, based on the ARC GIS 10.8 program.
The values of (S) in Al-Shagrah valley basin were found to range from 144.12 to 25.12. The value of 144.12 covered an area of 15.19km2, representing 7.75% of the area, while the value of 89.24 covered 1.32km2, accounting for 0.64%. In the third position was the value of 67.52, which occupied 43.62km2, representing 21.35%, followed by the value of 44.82 covering 25.40km2, with a percentage of 12.38%. The value of 41.35 was in fifth place with an area of 75.63km2 and a percentage of 36.87. Next was the value of 31.39 with 1.26km2 and a rate of 0.61%. The value of 28.22 occupied the seventh position with an area of 1.66km2 and a rate of 0.80%. Lastly, the value of 25.12 covered an area of 40.21km2, representing 19.60%, as shown in in Table 6.
Table 6. S values extracted for the study area
|
Value (S) |
Area (km2) |
Ratio (%) |
|
144.12 |
15.91 |
7.75% |
|
89.24 |
1.32 |
0.64% |
|
67.52 |
43.62 |
21.35% |
|
44.82 |
25.40 |
12.38% |
|
41.35 |
75.63 |
36.87% |
|
31.39 |
1.26 |
0.61% |
|
28.22 |
1.66 |
0.80% |
|
25.12 |
40.20 |
19.60% |
|
Total |
205 |
100% |
Source: The researchers based on Figure 6.
The majority of the values for slope in Al-Shagrah valley basin were low, showing that the soil quickly reacts to water runoff when it rains. This suggests a strong correlation between curve number (CN) and slope (S) values in terms of their impact on surface water runoff. The regions with the highest CN coefficients also had the lowest S coefficients, indicating that the soil in this area has low permeability.
5.4 Calculating the initial extraction (La) factor
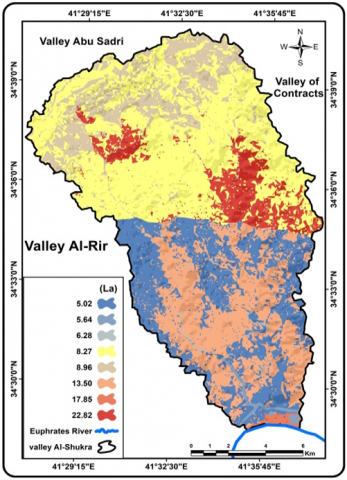
The coefficient (La) is crucial for determining the quantity of surface runoff. It represents the volume of rainwater that is lost before the initiation of surface runoff. This includes evaporation, seepage, and interception by vegetation. Low values of the coefficient (La) approaching zero suggest minimal loss of rainwater before surface runoff begins, leading to increased runoff. Conversely, high values of the factor (La) indicate significant water loss, resulting in limited surface runoff [26].
Figure 7. Values of (La) mm for the basin of the study area
Source: Satellite visualization of the American Landsat satellite with a capacity of 30×30, based on the ARC GIS 10.8 program.
Table 7. (La) values extracted for the study area
|
Value (La) |
Area (km2) |
Ratio (%) |
|
22.82 |
15.91 |
7.75% |
|
17.85 |
1.32 |
0.64% |
|
13.5 |
43.62 |
21.26% |
|
8.96 |
25.40 |
12.38% |
|
8.27 |
75.63 |
36.87% |
|
6.28 |
1.26 |
0.69% |
|
5.64 |
1.66 |
0.81% |
|
5.02 |
40.20 |
19.60% |
|
Total |
205 |
100% |
Source: The researchers based on Figure 7.
Eight LA values were documented in Table 7 and Figure 7, varying from 22.82mm to the highest values, covering an area of 15.91km2 at a rate of 7.75%. On the other hand, the lowest values were reported at 5.02mm, covering an area of 40.21km2 at a rate of 19.60%. The remaining values fell between the highest and lowest value.
Low (La) values suggest a reduction in rainwater loss prior to the initiation of surface runoff within the basin. This suggests an increase in the conversion of rainwater into surface runoff [27].
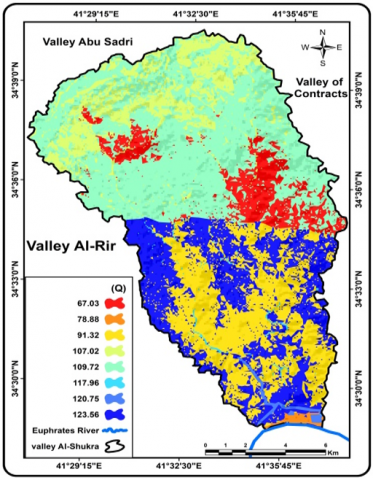
5.5 Calculating the depth of surface runoff (Q)
Figure 8. Values (Q) mm for the basin of the study area
Source: Satellite visualization of the American Landsat satellite with a capacity of 30×30, based on the ARC GIS 10.8 program.
Table 8. Q values extracted for the study area
|
Value (Q) |
Area (km2) |
Ratio (%) |
|
67.03 |
15.91 |
7.75% |
|
78.88 |
1.32 |
0.64% |
|
91.32 |
43.62 |
21.26% |
|
107.02 |
25.40 |
12.38% |
|
109.72 |
75.63 |
36.87% |
|
117.96 |
1.26 |
0.69% |
|
120.75 |
1.66 |
0.81% |
|
123.56 |
40.20 |
19.60% |
|
Total |
205 |
100% |
Source: The researchers based on Figure 8.
Surface runoff depth refers to the volume of water flowing on the ground surface during rainfall, which is determined using CN-S-La values and precipitation data in the watersheds. The primary goal of calculating surface runoff depth is to identify the maximum extent reached by surface runoff. Analysis of Table 8 and Figure 8 reveals that the values for estimating surface runoff depth are elevated in the research area, indicating a high depth of surface runoff [28]. The greatest recorded depth was 123.56, covering an area of 40.21km2 with a rate of 19.60%. Conversely, the lowest value documented was 67.03, covering an area of 15.1km2, representing 7.75%.
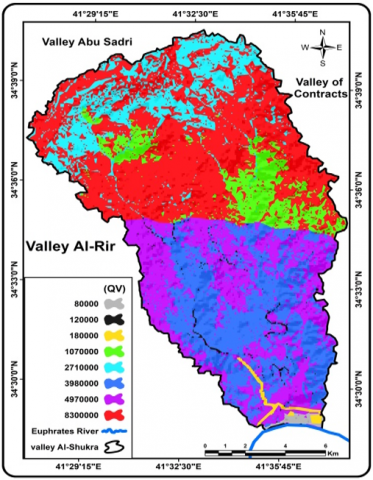
5.6 Calculating the surface runoff volume (QV)
Determining surface runoff is a crucial aspect of hydrological research concerning water collection and selecting locations for dam construction, particularly in regions with minimal rainfall. The amount of surface runoff indicates the overall runoff volume and helps identify flood-prone areas within the watershed, as shown in Table 9 and Figure 9 [29].
The examination of Table 10 and Figure 10 show that the maximum surface runoff value was 8,300,000, encompassing 75.63km2 and displaying a percentage of 36.87%. In contrast, the minimum reported value was 80,000, covering 1.32km2 with a percentage of 0.64%.
Table 9. (QV) values extracted for the study area
|
Value (QV) |
Area (km2) |
Ratio (%) |
|
67.03 |
15.91 |
7.75% |
|
78.88 |
1.32 |
0.64% |
|
91.32 |
43.62 |
21.26% |
|
107.02 |
25.40 |
12.38% |
|
109.72 |
75.63 |
36.87% |
|
117.96 |
1.26 |
0.69% |
|
120.75 |
1.66 |
0.81% |
|
123.56 |
40.20 |
19.60% |
|
Total |
205 |
100% |
Source: The researchers based on Figure 9.
Figure 9. QV mm values for the basin of the study area
Source: Satellite visualization of the American Landsat satellite with a capacity of 30×30, based on the ARC GIS 10.8 program.
Table 10. Height and storage levels for the proposed payment sites
|
Proposed Water Tanks |
The Sea Height from Surface Level |
Tank Volume/m3 |
|
The first proposed tank |
218 |
648900 |
|
The second proposed tank |
198 |
1541700 |
|
The third proposed tank |
217 |
1751400 |
|
The fourth proposed tank |
180 |
1446300 |
|
Total |
- |
5,388,300 |
Source: The researchers, based on Figure 10 and the Arc Map 10.4.1 program.
Figure 10. The locations for establishing watersheds in the study area
Source: Satellite visualization of the American Landsat satellite with a capacity of 30×30, based on the ARC GIS 10.8 program.
5.7 Choosing appropriate sites for water harvesting
The process of choosing appropriate locations for water harvesting involves several steps, which are as follows:
Step 1: Determining the elevation of the area where water will be stored using the digital elevation model (DEM) of Al-Shagrah valley basin and identifying lands with a gentle slope based on contour lines. This step is crucial in the construction of dams in water basins [30].
Step 2: Matching the river bed map with contour lines to establish the flow direction of the waterways.
Step 3: Identifying suitable sites that can benefit from human activities such as agriculture (plants, animals).
After completing these steps, four potential sites have been identified for constructing earthen dams for water storage purposes. An earthen dam is a barrier that diverts the watercourse to store water during the rainy season and utilize it during dry spells for various purposes. These sites were selected due to their suitability in terms of slope and contour line convergence [31].
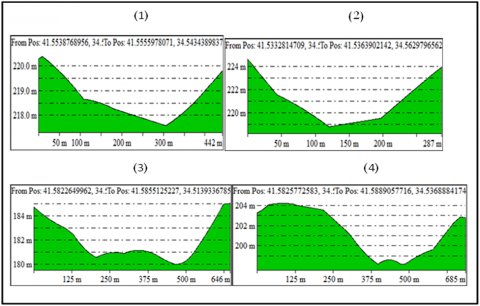
5.8 Proposed locations for establishing earthen embankments for the study area
Location 1: The initial dam can be found to the west of the research site in valley basin no.3 (Refer to Figure 10 and Figure 11). According to the data in Table 10, this dam has a storage capacity of 648,900m3 and stands at an elevation of 218m above sea level.
Location 2: The second dam is situated in the center of the study area within valley basin no.3 (Refer to Figure 10 and Figure 11). Table 10 indicates that this dam has a storage capacity of 1,751,400m3 and is positioned at an elevation of 217m above sea level.
Location 3: The third dam is positioned within the basin of valley basin no. 2 (Refer to Figure 10 and Figure 11). This dam offers a storage capacity of 1,541,700m3 at an elevation of 198m above sea level.
Location 4: The fourth dam is situated to the southwest of the third dam and to the south of the study area, with a storage capacity of 1,446,300m3 and an elevation of 180m above sea level as illustrated in Figure 10, Figure 11, and Table 10.
Figure 11. Cross sections of the four dams in the study area
It has been determined that the natural characteristics of the study area in terms of geology, climate, and geomorphology are conducive for conducting the study and achieving the research objectives. The spatial analysis revealed that the study area is suitable for water harvesting due to its abundant water quantities and favorable soil characteristics. As a result, it is feasible to store seasonal water by identifying four watersheds with large storage capacities estimated at 5,388.30, which could be adequate for any future activities in the region. The research methodology, which utilizes modern geographical technologies, has been shown to be a suitable approach for analytical studies of valley basins. In conclusion, the study recommends that decision-makers consider and implement the study findings to minimize water wastage and utilize rainwater effectively.
[1] Hadadin, N., Shawash, S., Tarawneh, Z., Banihani, Q., Hamdi, M.R. (2012). Spatial hydrological analysis for water harvesting potential using ArcGIS model: The case of the north-eastern desert, Jordan. Water Policy, 14(3): 524-538. https://doi.org/10.2166/wp.2011.058
[2] Che-Ani, A.I., Shaari, N., Sairi, A., Zain, M.F.M., Tahir, M.M. (2009). Rainwater harvesting as an alternative water supply in the future. European Journal of Scientific Research, 34(1): 132-140.
[3] Gabriela, R.M.H., Vladimir, C.T.J. (2022). Rainwater harvesting system as a strategy for adaptation on climate change: A review. IOP Conference Series: Earth and Environmental Science, 1121(1): 012007. https://doi.org/10.1088/1755-1315/1121/1/012007
[4] Van Meter, K.J., Steiff, M., McLaughlin, D.L., Basu, N.B. (2016). The socioecohydrology of rainwater harvesting in India: Understanding water storage and release dynamics across spatial scales. Hydrology and Earth System Sciences, 20(7): 2629-2647. https://doi.org/10.5194/hess-20-2629-2016
[5] Al-Houri, Z.M., Abu-Hadba, O.K., Hamdan, K.A. (2014). The potential of roof top rain water harvesting as a water resource in Jordan: Featuring two application case studies. International Journal of Environmental and Ecological Engineering, 8(2): 147-153. https://doi.org/10.5281/zenodo.1096279
[6] Maidment, D.R. (1992). Handbook of Hydrology. McGraw-Hill, New York.
[7] Suoaguno, K., Hidayat, P. (2008). Water harvesting techniques for sustainable water resources management in catchments area. In Proceedings of International Workshop on Integrated Watershed Management for Sustainable Water Use in a Humid Tropical Region, Tsukuba, pp. 18-30.
[8] Ibrahim, A.L.H.K., Mohammed, K.S. (2023). Spatial analysis of water harvesting areas in Akash valley basin and the possibility of investing it for development purposes. Midad Al-Adab Refereed Journal, 1: 11-52.
[9] Al-Houri, Z., Al-Omari, A. (2022). Assessment of rooftop rainwater harvesting in Ajloun, Jordan. Water Reuse, 12(1): 22-32. https://doi.org/10.2166/wrd.2021.064
[10] Kazemi, R. (2022). Analysis of regional flow duration curve for the rainwater harvesting systems in different climate of Iran. Water Harvesting Research, 5(2): 144-149. https://doi.org/10.22077/jwhr.2022.5504.1070
[11] Mohammed, K.S., Barkat, S.A. (2023). Estimating the volume of surface runoff for water harvesting purposes and the possibility of investing it in Abu Dalayah valley basin using modern statistical methods. Journal of Sustainable Studies, 5(4): 625-650.
[12] Rahman, S., Khan, M.T.R., Akib, S., Din, N.B.C., Biswas, S.K., Shirazi, S.M. (2014). Sustainability of rainwater harvesting system in terms of water quality. The Scientific World Journal, 2014(1): 721357. https://doi.org/10.1155/2014/721357
[13] Hamid, D.K. (2016). Spatial analysis to estimate the volume of runoff for the basin (Valley Alvdha) in northeastern Iraq using GIS. Journal of Al-Farahidi's Arts, 8(25): 296-318.
[14] Barakat, S.A., Mohammed, K.S. (2021). Geomorphometric analysis of abu dalaih valley basin using geomatics techniques and the possibility of investing it for water harvesting purposes. Al-Anbar University Journal for Humanities, 2021(2): 1960-1996. https://doi.org/10.37653/juah.2021.171600
[15] Yair, A. (1983). Hillslope hydrology water harvesting and areal distribution of some ancient agricultural systems in the northern Negev desert. Journal of Arid Environments, 6(3): 283-301. https://doi.org/10.1016/S0140-1963(18)31514-3
[16] Tamagnone, P., Cea, L., Comino, E., Rosso, M. (2020). Rainwater harvesting techniques to face water scarcity in African drylands: Hydrological efficiency assessment. Water, 12(9): 2646. https://doi.org/10.3390/w12092646
[17] Alrawi, I., Chen, J., Othman, A.A., Ali, S.S., Harash, F. (2023). Insights of dam site selection for rainwater harvesting using GIS: A case study in the Al-Qalamoun Basin, Syria. Heliyon, 9(9). https://doi.org/10.1016/j.heliyon.2023.e19795
[18] Alwan, I.A., Aziz, N.A., Hamoodi, M.N. (2020). Potential water harvesting sites identification using spatial multi-criteria evaluation in Maysan Province, Iraq. ISPRS International Journal of Geo-Information, 9(4): 235. https://doi.org/10.3390/ijgi9040235
[19] Mohmmed, S.J., Hassan, M.A. (2022). Assessment of the possibility of water harvesting for the Al-Labad Basin-West of Samarra, using artificial intelligence technology, watershed modeling (WMS). International Journal of Health Sciences, 6(S5): 1035-1054. https://dx.doi.org/10.53730/ijhs.v6nS5.8806
[20] Mohammed, K.S. (2021). Geomorphometric analysis of Alfdhay Valley basin using geomatics techniques and the possibility of investing it for water harvesting. PalArch's Journal of Archaeology of Egypt/Egyptology, 18(10): 1812-1827.
[21] Mishra, S.K., Singh, V.P., Sansalone, J.J., Aravamuthan, V. (2003). A modified SCS-CN method: Characterization and testing. Water Resources Management, 17: 37-68. https://doi.org/10.1023/A:1023099005944
[22] Soulis, K.X., Valiantzas, J.D. (2012). SCS-CN parameter determination using rainfall-runoff data in heterogeneous watersheds–the two-CN system approach. Hydrology and Earth System Sciences, 16(3): 1001-1015. https://doi.org/10.5194/hess-16-1001-2012
[23] Mishra, S.K., Singh, V.P. (2013). Soil Conservation Service Curve Number (SCS-CN) Methodology. Springer Science & Business Media.
[24] Xiao, B., Wang, Q.H., Fan, J., Han, F.P., Dai, Q.H. (2011). Application of the SCS-CN model to runoff estimation in a small watershed with high spatial heterogeneity. Pedosphere, 21(6): 738-749. https://doi.org/10.1016/S1002-0160(11)60177-X
[25] Bartlett, M.S., Parolari, A.J., McDonnell, J.J., Porporato, A. (2016). Beyond the SCS‐CN method: A theoretical framework for spatially lumped rainfall‐runoff response. Water Resources Research, 52(6): 4608-4627. https://doi.org/10.1002/2015WR018439
[26] Amutha, R., Porchelvan, P. (2009). Estimation of surface runoff in Malattar sub-watershed using SCS-CN method. Journal of the Indian Society of Remote Sensing, 37: 291-304. https://doi.org/10.1007/s12524-009-0017-7
[27] Soulis, K.X., Valiantzas, J.D. (2013). Identification of the SCS-CN parameter spatial distribution using rainfall-runoff data in heterogeneous watersheds. Water Resources Management, 27: 1737-1749. https://doi.org/10.1007/s11269-012-0082-5
[28] Kadam, A.K., Kale, S.S., Pande, N.N., Pawar, N.J., Sankhua, R.N. (2012). Identifying potential rainwater harvesting sites of a semi-arid, basaltic region of Western India, using SCS-CN method. Water Resources Management, 26: 2537-2554. https://doi.org/10.1007/s11269-012-0031-3
[29] Mishra, S.K., Singh, V.P. (2002). SCS-CN method. Part I: Derivation of SCS-CN-based models. College of Agriculture and Life Sciences.
[30] Mishra, S.K., Singh, V.P., Mishra, S.K., Singh, V.P. (2003). SCS-CN method. In: Soil Conservation Service Curve Number (SCS-CN) Methodology, pp. 84-146. https://doi.org/10.1007/978-94-017-0147-1_2
[31] Mishra, S.K., Jain, M.K., Bhunya, P.K., Singh, V.P. (2005). Field applicability of the SCS-CN-based Mishra–Singh general model and its variants. Water Resources Management, 19: 37-62. https://doi.org/10.1007/s11269-005-1076-3