Jhstolistikha Percy Dos | Rodeano Roslee*![]() | Kamilia Sharir
| Kamilia Sharir![]() | Dwa Desa Warnana
| Dwa Desa Warnana![]()
© 2024 The authors. This article is published by IIETA and is licensed under the CC BY 4.0 license (http://creativecommons.org/licenses/by/4.0/).
OPEN ACCESS
The landslide issue is considerably prominent in the SMK Kundasang area. In 2012, the school was evacuated due to the instability of the ground on the premise. This study aims to research the landslide hazard in the affected area by employing a multi-hazard Frequency Ratio model. The first step was to create a landslide distribution map consisting of 191 landslides in total. 70% of it was used to generate the model. Meanwhile, the rest of it was utilized to verify the model. The ten landslide causative factors integrated to produce the model were lithology; soil series; distance from lineament, drainage, and road; slope angle; slope aspect; elevation; precipitation rate; and land use map. Area Under the Curve (AUC) analysis showed that the model performed at 84.0% of prediction accuracy. The hazard map was interpreted as having 12% very low, 23% low, 29% moderate, 25% high, and 12% of very high landslide hazard levels in the study area, respectively. The proposed approach in this study is deduced to be applicable to yield reasonable outcomes that benefit the development planning in SMK Kundasang.
landslide hazard, frequency ratio, SMK Kundasang, landslide causative factors, prediction accuracy, AUC
Landslides, a significant geological phenomenon, have spurred a comprehensive study within the precincts of SMK Kundasang, Sabah. This endeavor is fuelled by the need to grasp and substantiate the fervent demands put forth by the local community, which bears the brunt of recurrent landslides in this area [1]. Previous studies in similar geological settings have shown that landslides are often triggered by both natural processes and human activities. For instance, studies in the mountainous regions of Malaysia and other parts of Southeast Asia have identified critical factors such as rainfall intensity, soil type, and slope angle as major contributors to landslide occurrences [1-3]. These findings provide a strong justification for focusing on SMK Kundasang, an area prone to frequent landslides due to its hilly terrain and human interventions.
Notably, Kundasang, ensconced in the hilly terrain of Sabah, is particularly prone to landslides triggered by both natural processes and human activities. Human activities such as deforestation, agricultural practices, and construction significantly alter the landscape, increasing the susceptibility to landslides. Quantitative data from recent studies indicate that areas with high deforestation rates have a landslide frequency ratio of 2.5, compared to 1.0 in forested areas. Similarly, construction activities that disturb the soil and alter drainage patterns can increase landslide occurrences by up to 30% [4].
The crux of this study centers on understanding and validating the entreaty from the local community to reinstate the operational status of SMK Kundasang. The backdrop of this situation is rooted in the directive that compelled SMK Kundasang's relocation to SMKA Ranau in 2012 due to a plethora of ground instabilities. This transition, however, precipitated a host of challenges, prompting the local populace to grapple with socio-economic limitations. This turbulence saw an increase in student attrition and imposed a financial burden on parents who had to bear the transportation costs of sending their children to classes at SMKA Ranau. Peculiarly, juxtaposed against this backdrop, facilities like the government-owned Kundasang Health Clinic continued unaffected, evading closure and relocation.
Addressing the local community's concerns and needs, a comprehensive analysis of landslide hazards unfolded within the affected domain. This analysis was underpinned by deploying a multi-hazard model known as the Frequency Ratio (FR) model. A body of existing research substantiates the potency of the Frequency Ratio model in gauging landslide hazard potential [1-3]. This model hinges on discerning spatial correlations between the occurrence of landslides and individual contributing factors [1]. When the spatial relationship is robust, the ratio value equals or exceeds one, whereas a weaker relationship yields a ratio value below one. Measurable, the Frequency Ratio denotes the probability ratio between the presence and absence of landslide incidents [1, 5-8]. The outcome of the Frequency Ratio assessments manifests in the formulation of the Landslide Hazard Index [1] or the Landslide Susceptibility Index [2, 3], amalgamating individual factors' Frequency Ratio values. Elevated index values signify an augmented landslide hazard potential [1, 2].
The merits of the Frequency Ratio model are manifold, prominently its streamlined data processing. Noted for its simplicity, comprehensibility, and expeditiousness [1], this model thrives in the Geographic Information System (GIS) environment, deftly managing the copious Frequency Ratio data and simplifying analysis [3-7]. The outcomes yielded by this model are readily intelligible and amenable to efficient management [3-7].
The research terrain has often focused on landslides in developed locales like Kuala Lumpur and Penang, leaving a void in understanding landslides in areas undergoing active development [9]. Because of this, our chosen field, Kundasang in Sabah, assumes prominence owing to its recurrent brushes with landslides triggered by natural forces and human interventions [7]. As part of the systematic expedition, the foremost step involved the creation of a semi-quantitative database, fashioned through extensive desk, field, and laboratory studies, coupled with the compilation of secondary data [5, 6].
1.1 Study area
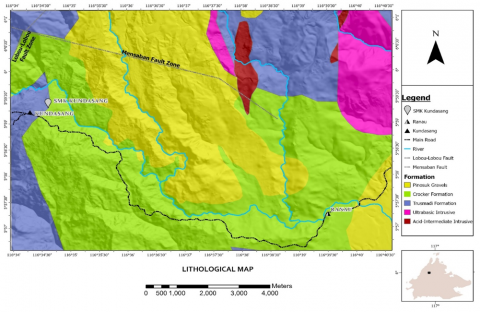
SMK Kundasang is located in the Kundasang zone of Sabah. According to the geological map of the Geological Survey of Malaysia, the study area reveals five types of lithological units. Sequencing from the youngest to the oldest formation marked down the deposition age of Quaternary to Paleocene; the formations are the Pinosuk Gravels; acid-intermediate intrusive; ultrabasic intrusive; Crocker Formation; and lastly, the Trusmadi Formation. Pinosuk Gravels is slightly different from most lithological types; it is comprised of boulders and gravels of sandstone and siltstone as well as granodiorite and ultrabasic rock that was derived from the meltdown of a glacier [9]. Trusmadi Formation predominates argillaceous rock, thin beds of regularly alternating siltstone and mudstone, and occasional tuff [10]. Meanwhile, Crocker Formation comprises massive grey sandstone, closely-bedded grey sandstone and siltstone, and variously coloured mudstone and shale.
1.2 Landslide causative factors
Instead of scrutinizing on what is the causing factor of a landslide occurrence, this study focuses on building a dependent relationship between the landslide occurrence and the landslide causative factors. There is no specific reference on selecting landslide causative factors for an area [11, 12]; it relies on the natural environment of that area and the availability of data. In response, we adopted 10 causative factors to analyze the landslide hazard level in the study area. These factors include lithology, soil series, distance from lineament, drainage and road, slope angle, slope aspect, elevation, precipitation rate, and land use.
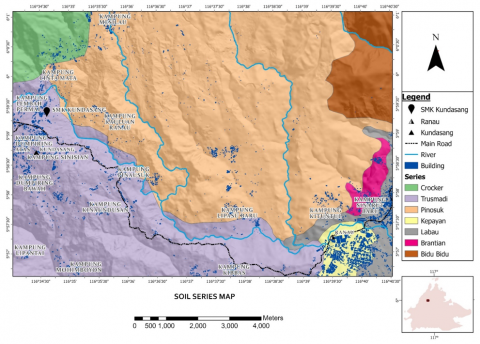
Lithology greatly controls how the rock mass weakens and weathers, bedrock abrasion, soil properties in terms of grain-size distribution and porosity, and how the microstructures and macrostructures in an outcrop behave [13]. Younger deposition of lithology has a bigger impact on landslides than older lithology deposition [4]. The lithology is highly deformed in the study area due to active fault zones such as the Mensaban and Lobou-labour Fault Zone. Soil series is another factor affecting landslide occurrence in the study area. Different soil types have different total stress values and pore pressure. Total stress value is the total force per unit area in the soil mass; pore pressure is groundwater pressure. Total stress value and pore pressure will inevitably increase when the rainfall rate increases. However, the ability of soil to tolerate the increasing of both pressures will determine the level of landslide hazard in that soil mass area – and this ability varies depending on the type of soil.
Figure 1. The lithological map of the study area
Figure 2. The soil series map of the study area
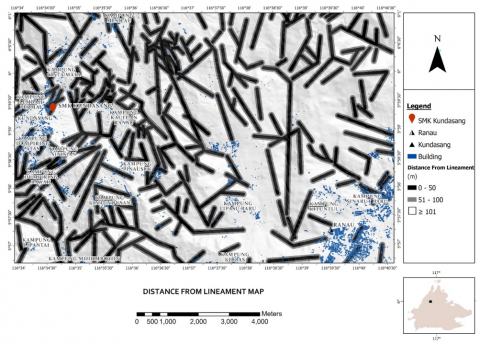
Figure 3. The distance from lineament map of the study area
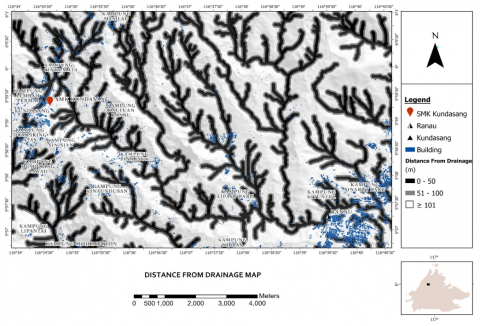
Figure 4. The distance from drainage map of the study area
Figure 5. The drainage from road map of the study area
Figure 6. The slope angle map of the study area
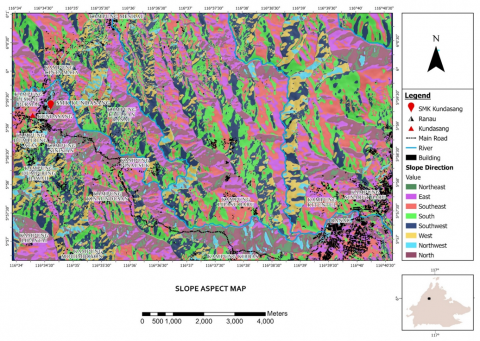
Figure 7. The slope aspect map of the study area
Figure 8. The elevation map of the study area
Figure 9. The precipitation map of the study area
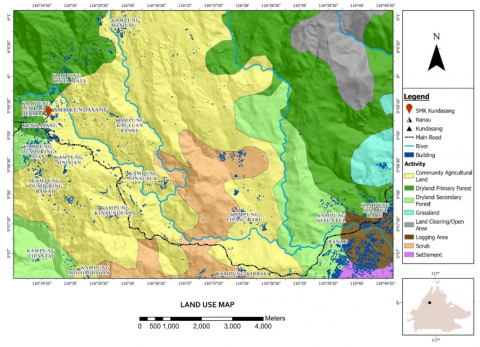
Figure 10. The land use map of the study area
Lineament study is a significant topic in the analysis of landslide occurrence. Many researchers have successfully correlated the relationship between lineaments and landslide occurrence globally [14-16]. The lineament synonymously highlights a vulnerable plane that initiates numerous slope instabilities due to weakened soil strength in the affected areas [15, 17, 18]. In this study, a lineament buffer mapping was completed to understand, to a greater extent, the effect of proximity to contour on the landslide occurrence in the study area. Landslide is more prone to decreasing distance from drainage. This is attributed to the fact that drainage has the potential to induce erosion and saturate the lower portion of a slope [19]. The possibility of a landslide to occur also significantly elevates as the distance from the road decreases [20]. Landslide scars were spotted, whether treated or not, along the main and minor roads in the study area.
An increase in slope angle also leads to more possibilities of landslide occurrence in the affected area [21]. The reason to justify this lies in the increment of shear stress but the reduction of a safety factor when the slope angle is elevated [22]. The influence of aspect toward slope failure is delivered regarding precipitation rate, discontinuities and sunlight exposure [23]. Studies also show that highlands and mountainous zones have more landslide occurrences [24, 25]. Intensified and long period of precipitation rate affects the slope stability in a way that increases the pore pressure and shear stress. This condition will reduce the safety factor and exaggerate slope failure [26]. Land use practices that disrupt the land frequently result in slope instability. Figure 1 to Figure 10 show the landslide causative factors incorporated in this study.
2.1 Material source
The source of materials is summarized in Table 1.
Table 1. The groups, input layers and data sources of materials used in the study
|
Groups |
Input Layers |
Data Sources |
|
Slopes |
Slope angle |
IfSAR-derived DEM |
|
Slope height |
IfSAR-derived DEM |
|
|
Slope aspect |
IfSAR-derived DEM |
|
|
Geology |
Lithology |
Geological Survey of Malaysia, fieldwork |
|
Soil material |
Land Resources Division, fieldwork, laboratory test |
|
|
Structure |
IfSAR-derived DEM, satellite image |
|
|
Land use |
Land use |
Department of Town and Country Planning |
|
Infrastructure |
Satellite image, World Street Map |
|
|
Hydrology |
Drainage |
Topography map |
|
|
Rainfall |
Sabah Metrological Department |
2.2 Application of frequency ratio
Generating a landslide hazard map based on Frequency Ratio relied on the landslide distribution map. The main data sources to identify landslide occurrence are field surveys, IfSAR-derived Digital Elevation Model (DEM), periodical satellite images, local news and existing landslide distribution database within the study area. A high resolution of DEM, i.e. the resolution used in this study is 2.5 m × 2.5 m - enables us to discern distinguishing features of a landslide, such as crown cracks, main scarp, and head and toe parts. Preceding studies proved that satellite image analysis is among the most popular platform for studying the occurrence of landslides [27, 28]. Firstly, the landslide distribution map, consisting of 191 landslides in total, was divided into two types of subdivisions; training dataset and testing dataset. The training dataset contained 70%, equivalent to 134 of the total landslides.
Meanwhile, the testing dataset accommodated 30%, equivalent to 57% of the total landslide. The training dataset became the key point in generating the landslide hazard map, executing it by overlapping each data layer with the landslide distribution map containing 134 landslides. A testing dataset validated the landslide hazard map by manifesting the Area Under the Curve (AUC).
During the process of overlapping between the landslide causative layers and landslide distribution map, the Frequency Ratio was calculated by dividing the area of the landslide by the area of data layers in the format of pixels, the smallest unit in spatial data. The landslide hazard map was created by summing up the value of the Frequency Ratio for all data layers as per Eq. (1).
$L H I=F R_1+F R_2+F R_3 \ldots \ldots F R_n$ (1)
3.1 Landslide hazard map
Table 2 shows the Frequency Ratio for each of the factors obtained from the calculation. Based on the tabulated data, ultrabasic intrusive shows the highest frequency ratio value. A major part of the ultrabasic rock in the study area is made up of serpentinite. Serpentinite has one distinctive characteristic, namely the weak bonding along planes that leads to a low coefficient of friction [29]. This behaviour causes that particular area to have less tolerance toward slope instability. In the case of soil series, the Bidu series tops the list suggesting that the northeastern part of the study area is prone to landslide occurrence. Based on the result from laboratory analysis, the Bidu Bidu series performs high moisture content and an extremely elevated groundwater table. Both of these conditions saturate the soil mass, increase the pore pressure, reduce the shear strength of the soil and finally lead to slope failure.
The elements of distance from lineament, drainage and road agree on the significance of 0 m to 50 m intervals contributing to the highest Frequency Ratio value. This is justified by Arbanas and Dugonjic [30] and Roslee and Krishnan [20]. More landslide occurrence can be observed closer to lineament, drainage and road. A slope with more than 35° inclination performs a very prominent control on the landslide occurrence compared to other gentler slope angle intervals in the study area. This proves that the steeper the slope is, the stronger the parallel component of the gravity pull. Thus, the weaker the resistance towards downward movement, and more landslides will be triggered. In the case of the slope aspect, slopes facing northeast have the highest impact on the landslide occurrence in the study area. The slope aspect determines which direction of azimuth a slope is facing. Hence, from the analysis, we know that the northeast generally received more rainfall, stronger wind flow and probably less sun exposure causing the ground to contain more moisture than other slope aspects.
More landslides occurred at the elevation of 1001 m to 1500m. The trend line of this elevation is NE – SW, which is extended from the Mamut Copper Mine area down to Kundasang and then broadens up to Kampung Lipasu. More landslides were also observed in the area, with an intense precipitation rate of 2462 mm/year. In the precipitation rate map of the study area, the range of precipitation rate at 2462 mm/year is dominantly spread in the northwest, including Kampung Mesilau. A more intense precipitation rate is sighted in the Ranau Town area with a lower frequency ratio value.
Nevertheless, the variance in the precipitation rate within the study area is delicate and unable to produce a solid deduction on the rate difference because the study area received relatively intense rainfall throughout the year. In the case of land use, open area and land clearing play a big part in inducing the occurrence of landslides in the study area. The destruction of vegetation reduces the shear strength and cohesion of soil and shortens the return time of landslides [31].
Table 2. The Frequency Ratio value for each of the layer expressed as ratio between the percentage of landslide pixels (b) and percentage of class pixels (a)
|
Factor |
Sub-fac. |
Class Pixels (CP) |
% of CP (a) |
Land. Pixels (LP) |
% of LP (b) |
FR (b/a) |
|
Litho- logy |
AI |
98383 |
2.01 |
295 |
2.31 |
1.15 |
|
UI |
401628 |
8.23 |
2422 |
19.00 |
2.31 |
|
|
CF |
1951116 |
39.96 |
2723 |
21.36 |
0.53 |
|
|
PG |
1563660 |
32.02 |
3382 |
26.53 |
0.83 |
|
|
TF |
868123 |
17.78 |
3924 |
30.79 |
1.73 |
|
|
Soil series |
Crs |
231212 |
4.74 |
32 |
0.25 |
0.05 |
|
Brs |
79072 |
1.62 |
58 |
0.46 |
0.28 |
|
|
Lbs |
204272 |
4.18 |
315 |
2.47 |
0.59 |
|
|
Pns |
2489639 |
50.99 |
3720 |
29.19 |
0.57 |
|
|
Bbs |
299724 |
6.14 |
2266 |
17.78 |
2.90 |
|
|
Trs |
1446187 |
29.62 |
6242 |
48.97 |
1.65 |
|
|
Kps |
132804 |
2.72 |
113 |
0.89 |
0.33 |
|
|
Dis. from lineament (m) |
≥ 101 |
2845670 |
58.28 |
5144 |
40.36 |
0.69 |
|
51-100 |
985640 |
20.19 |
3324 |
26.08 |
1.29 |
|
|
0-50 |
1051600 |
21.54 |
4278 |
33.56 |
1.56 |
|
|
Dis. from drainage (m) |
≥ 101 |
2773024 |
56.79 |
6302 |
49.44 |
0.87 |
|
51-100 |
1186302 |
24.29 |
3345 |
26.24 |
1.08 |
|
|
0-50 |
923584 |
18.91 |
3099 |
24.31 |
1.29 |
|
|
Dis. from road (m) |
≥ 101 |
4049657 |
82.94 |
9727 |
76.31 |
0.92 |
|
51-100 |
393084 |
8.05 |
1326 |
10.40 |
1.29 |
|
|
0-50 |
440169 |
9.01 |
1693 |
13.28 |
1.47 |
|
|
Slope angle (°) |
˂ 15 |
1855040 |
37.99 |
1624 |
12.74 |
0.34 |
|
15-25 |
1883430 |
38.57 |
3975 |
31.19 |
0.81 |
|
|
26-35 |
965564 |
19.77 |
3445 |
27.03 |
1.37 |
|
|
˃ 35 |
178876 |
3.66 |
3702 |
29.04 |
7.93 |
|
|
Slope aspect |
NW |
152371 |
3.12 |
614 |
4.82 |
1.54 |
|
N |
259553 |
5.32 |
727 |
5.70 |
1.07 |
|
|
NE |
524369 |
10.74 |
2184 |
17.13 |
1.60 |
|
|
W |
413778 |
8.47 |
1337 |
10.49 |
1.24 |
|
|
E |
760842 |
15.58 |
2049 |
16.08 |
1.03 |
|
|
SW |
812273 |
16.64 |
2879 |
22.59 |
1.36 |
|
|
S |
978793 |
20.05 |
1540 |
12.08 |
0.60 |
|
|
SE |
980931 |
20.09 |
1416 |
11.11 |
0.55 |
|
|
Ele. (m) |
0-500 |
35726 |
0.73 |
0 |
0.00 |
0.00 |
|
501 - 1000 |
1975917 |
40.47 |
5051 |
39.63 |
0.98 |
|
|
1001 - 1500 |
2565288 |
52.54 |
7361 |
57.75 |
1.10 |
|
|
1501 - 2000 |
303569 |
6.22 |
334 |
2.62 |
0.42 |
|
|
≥ 2001 |
2410 |
0.05 |
0 |
0.00 |
0.00 |
|
|
Pre. rate (mm/ year) |
˂ 2462 |
1010128 |
20.65 |
4902 |
38.42 |
1.86 |
|
2462 - 2472 |
943536 |
19.29 |
1168 |
9.16 |
0.47 |
|
|
2473 - 2482 |
954841 |
19.52 |
1341 |
10.51 |
0.54 |
|
|
2483 - 2492 |
988008 |
20.19 |
4060 |
31.82 |
1.58 |
|
|
≥ 2493 |
995962 |
20.36 |
1287 |
10.09 |
0.50 |
|
|
Land use |
Dpf |
1178843 |
24.14 |
2829 |
22.20 |
0.92 |
|
Dsf |
622154 |
12.74 |
2374 |
18.63 |
1.46 |
|
|
Sc |
445063 |
9.11 |
334 |
2.62 |
0.29 |
|
|
Gr |
101737 |
2.08 |
222 |
1.74 |
0.84 |
|
|
Caf |
2125065 |
43.52 |
5440 |
42.68 |
0.98 |
|
|
St |
42609 |
0.87 |
0 |
0.00 |
0.00 |
|
|
La |
123402 |
2.53 |
50 |
0.39 |
0.16 |
|
|
Ocl |
244037 |
5.00 |
1497 |
11.74 |
2.35 |
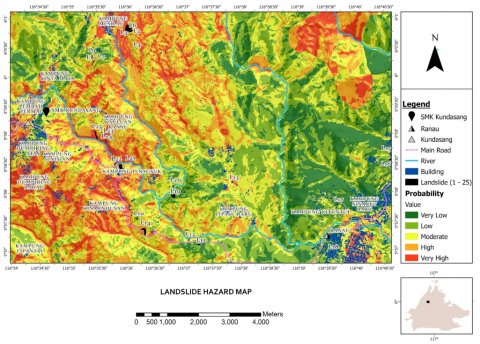
Figure 11. The landslide hazard map of the study area
Figure 11 shows the landslide hazard map of the study area. The hazard map indicated that 12% of the study area falls within the very low hazard level, 23% within the low hazard level, 29% within the moderate hazard level, 25% within the high hazard level, and 12% within the very high hazard level. These findings are consistent with other studies conducted in similar environments. For instance, in a study by Lee and Pradhan [1] in Selangor, Malaysia, similar hazard levels were observed with a comparable distribution of hazard zones. This consistency validates the reliability of the Frequency Ratio model used in our study. Additionally, areas identified as high and very high hazard zones are primarily located near lineaments, drainage systems, and roads, corroborating findings from other regions where such features significantly influence landslide occurrences. Based on this map, 12%, equivalent to 12.51 km2 of total area, is constituted by very low landslide levels. This zone is observed in the eastern part of the study area, in Kampung Sinarut Baru and Kampung Kituntul. These two villages are located in the northern part of Ranau town. Following is the zone of low landslide hazard level. According to the analysis, 23%, equivalent to 24.21 km2, of the study area encompasses the eastern part of the study area intermingled with a zone of very low landslide hazard level, the southern part of Kundasang and the upper part of Kampung Cinta Mata.
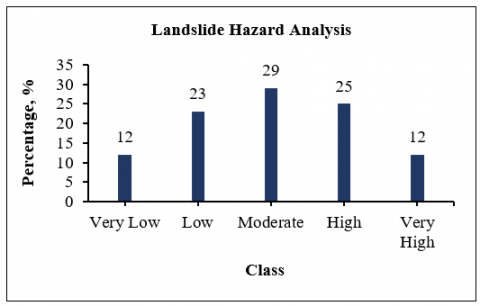
Figure 12. Comparison of area percentage with intervals by classes of landslide hazard level
Moderate hazard level class constitutes the largest coverage
Zone with a moderate landslide hazard level comprised 29% or 24.21 km2 of the study area. Kampung Lipasu Baru, Kampung Lipantai, Kampung Kibbas as well as SMK Kundasang sit on this zone. Generally, this zone is scattered throughout the study area. This is followed by a zone with a high landslide hazard level, which is incorporated by 25% or 25.74 km2 of the study area. Kampung Kauluan Ranau, Kampung Lembah Permai and the lower part of Kampung Cinta Mata are localities in this zone. Succeeding is the zone with a very high landslide hazard level. With a coverage of 12%, equivalent to 12.03 km2 of total area, this zone is inclusive of Kampung Dumpiring Atas, Kampung Dumpiring Bawah, Kampung Kinaundusan, Kampung Pinausuk, Kampung Mesilau at the south and Mamut Copper Mine in the northeast of the study area. There is a patch of this zone neighbouring SMK Kundasang. The most distinguishable characteristic shared among them is their locations proximately to lineament, drainage and road cuts. That is why we can see that this zone is also quite prominent in the riverbanks area and certain road cuts along Jalan Tamparuli-Ranau. They also ordained steep slopes of more than 35° that caused instability in the affected areas. Figure 12 shows the comparison of the percentage obtained by each class of the hazard level in the generated map.
3.2 Map validation
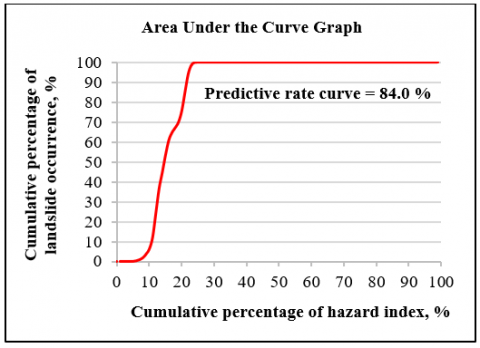
The landslide hazard index was reclassified into five classes, from very low to very high hazard levels. However, instead of five classes, the landslide hazard index was reclassified in the AUC process into 100 new output classes. Each of these output classes was equivalent to 1% of the interval. Thus, the total of output classes corresponded to 100%. The next value to quantify was the cumulative percentage of landslide occurrence based on the testing dataset. Both of these parameters were plotted on the graph, exhibiting the relationship between the cumulative percentage of landslide occurrence on the y-axis and the cumulative percentage of hazard index on the x-axis. Both the y-axis and the x-axis are bounded by 0 to 100 values. To generate the prediction accuracy on the landslide hazard map, a simple trapezoidal method to calculate the area under the curve was employed [32-34].
Based on Figure 13, the relationship of the two manipulators is simplified as a direct proportional system, where the cumulative percentage of hazard index increases as the cumulative percentage of landslide occurrence increases until both axes reach maximum bounds. The trend line of the graph is quite slow in the starting but then spikes enormously and attains the maximum bound of the y-axis. The line keeps its flat trend until the maximum bound of the x-axis is achieved.
The area ratio is 0.840, and the prediction accuracy is 84.0 %. Based on the classification by Landis and Koch [35], the prediction accuracy of this model is fairly satisfactory.
Figure 13. The illustration of relationship between cumulative percentage of landslide occurrence in y-axis and cumulative area percentage of hazard index in x-axis
The approach of Frequency Ratio was employed to study the landslide probability in the study area harvesting a prediction accuracy of 84.0%. The landslide hazard map shows that SMK Kundasang is at a moderately high hazard level. Any development planning should abide by the standard of procedure based on the hazard level in those areas. A landslide hazard map provides significant information that can help people to perceive the hazard of landslide occurrence as natural disasters. The approach of this study is justified and acceptable to be used not only in development planning but also in other sectors which finally aims to improve the socio-economic status in SMK Kundasang and its surrounding areas.
Future research could build on the findings of this study by exploring long-term monitoring of landslide-prone areas using advanced remote sensing technologies such as LiDAR and InSAR. Additionally, integrating new data sources like real-time rainfall data and soil moisture sensors could enhance the predictive accuracy of landslide models. Investigating the socio-economic impacts of landslides on local communities and developing mitigation strategies tailored to specific hazard levels would also be valuable. Finally, expanding the study area to include other parts of Sabah with similar geological conditions could provide a more comprehensive understanding of landslide dynamics in the region.
This work is supported by the Ministry of Higher Education of Malaysia (GUG0544-2/2020).
|
Subscripts |
|
|
SMK |
Sekolah Menengah Kebangsaan |
|
SMKA |
Sekolah Menengah Kebangsaan Agama |
|
AUC |
Area Under the Curve |
|
GIS |
Geographical Infromation System |
|
Fac. |
factor |
|
Land. |
landslide |
|
AI |
acid-intermediate intrusive |
|
UI |
ultrabasic intrusive |
|
CF |
Crocker Formation |
|
PG |
Pinosuk Gravels |
|
TF |
Trusmadi Formation |
|
Crs |
Crocker series |
|
Brs |
Brantian series |
|
Lbs |
Labau series |
|
Pns |
Pinosuk series |
|
Bbs |
Bidu Bidu series |
|
Trs |
Trusmadi series |
|
Kps |
Kepayan series |
|
Dis. |
Distance |
|
NW |
northwest |
|
N |
north |
|
NE |
northeast |
|
W |
west |
|
E |
east |
|
SW |
southwest |
|
S |
south |
|
SE |
southeast |
|
Ele. |
elevation |
|
Pre. |
precipitation |
|
Dpf |
dryland primary forest |
|
Dsf |
dryland secondary forest |
|
Sc |
scrub |
|
Gr |
grassland |
|
Caf |
community agriculture farm |
|
St |
settlement |
|
La |
logging area |
|
Ocl |
open area/land clearing |
[1] Lee, S., Pradhan, B. (2007). Landslide hazard mapping at selangor, malaysia using frequency ratio and logistic regression models. Landslides, 4: 33-41. https://doi.org/10.1007/s10346-006-0047-y
[2] Fayez, L., Pham, B.T., Solanski, H.A., Pazhman, D., Dholakia, M.B., Khalid, M. Prakash, I. (2018). Application of frequency ratio model for the development of landslide susceptibility mapping at part of Uttarakhand, India. International Journal of Applied Engineering, 13(9): 6846-6854. https://www.researchgate.net/publication/324835919
[3] Gholami, M., Ghachkanlu, E.N., Khosravi, K. Pirasteh, S. (2019). Landslide prediction capability by comparison of frequency ratio, fuzzy gamma and landslide index method. Journal of Earth System and Sciences, 128(42): 100-105. https://doi.org/10.1007/s12040-018-1047-8
[4] Sharir, K., Roslee, R. (2022). Flood susceptibility assessment (FSA) using GIS-based frequency ratio (FR) model in Kota Belud, Sabah, Malaysia. International Journal of Design and Nature and Ecodynamics, 17(2): 203-208. https://doi.org/10.18280/ijdne.170206
[5] Roslee, R., Sharir, K., Lai, G.T., Simon, N., Ern, L.K., Madran, E., Saidin, A.S. (2022). Application of Analytical Hierarchy Process (AHP) for Landslide Hazard Analysis (LHA) in Kota Kinabalu area, Sabah, Malaysia. IOP Conference Series: Earth and Environmental Science, 1103(1): 012031. https://doi.org/10.1088/1755-1315/1103/1/012031
[6] Simon, N., Crozier, M., de Roiste, M., Rafek, A.G., Roslee, R. (2015). Time series assessment on landslide occurrences in an area undergoing development. Singapore Journal of Tropical Geography, 36(1): 98-111. https://doi.org/10.1111/sjtg.12096
[7] Rodeano, R., Jamaluddin, T.A., Talip, M.A. (2011). Aplication of GIS in landslide risk assessment (LRA): A case study of the Kota Kinabalu area, Sabah, Malaysia. Bulletin of the Geological Society of Malaysia, 57: 69-83. https://doi.org/10.7186/bgsm57201109
[8] Yilmaz, I. (2009). Landslide susceptibility mapping using frequency ratio, logistic regression, artificial neural network and their comparison: A case study from Kat landslide (Tokat - Turkey). Computers and Geosciences, 35(6): 1125-1138. https://doi.org/10.1016/j.cageo.2008.08.007
[9] Runyan, C.W., D'Odorico, P., Lawrence, D. (2012). Physical and biological feedbacks of deforestation. Reviews of Geophysics, 50(4). https://doi.org/10.1029/2012RG000394
[10] Collenette, P. (1958). The Geology and Mineral Resources of the Jesselton-Kinabalu Area, North Borneo. Geological Survey Department British Territory in Borneo, Kuching, Sarawak.
[11] Yalcin, A. (2008). GIS-based landslide susceptibility mapping using analytical hierarchy process and bivariate statistics in Ardesen (Turkey): Comparisons of results and confirmations. Catena, 72: 1-12. https://doi.org/10.1016/j.catena.2007.01.003
[12] Roslee, R. (2018). Risk evaluation triangle (RET) for landslide risk management (LRM): A case study from Kota Kinabalu, Sabah, Malaysia. ASM Science Journal, 11(3): 206-214. https://search.app.goo.gl/CeA9Lv6
[13] Simon, N., Azlan, N.N.N., Roslee, R., Hussein, A., Ern, L.K., Sharir, K. (2017). Physical soil characterization on stable and failed slopes of the Ranau-Tambunan Road, Sabah, Malaysia. Nature Environment and Pollution Technology, 16(2): 659-665.
[14] Sharir K., Lai G.T., Simon N., Ern L.K., Madran E., Roslee R. (2022). Debris flow susceptibility analysis using a bivariate statistical analysis in the Panataran River, Kg Melangkap, Sabah, Malaysia. IOP Conference Series: Earth and Environmental Science, 1103(1): 012038. https://doi.org/10.1088/1755-1315/1103/1/012038
[15] Yusof, N., Ramli, M.F., Pirasteh, S., Shafri, H.Z. (2011). Landslides and lineament mapping along the simpang pulai to Kg Rajahighway, Malaysia. International Journal of Remote Sensing, 32(14): 4089-4105. https://doi.org/10.1080/01431161.2010.484434
[16] Pathak, D. (2016). Knowledge based landslide susceptibility mapping in the Himalayas. Geoenvironmental Disasters, 3: 1-11. https://doi.org/10.1186/s40677-016-0042-0
[17] Andreas, M., Allan, A. (2007). Incorporating geology and geomorphology in land management desicions in developing countries: A case study in Southern Costa Rica. Geomorphology, 87(1-2): 68-89. https://doi.org/10.1016/j.geomorph.2006.06.043
[18] Singh, K., Arya, A.K., Agarwal, K.K. (2020). Landslide occurences along lineaments on NH-154A, Chamba, Himachal Pradesh; Extracted from Satellite Data Landsat 8, India. Journal of the Indian Society of Remote Sensing, 48: 791-803. https://doi.org/10.1016/j.geomorph.2006.06.043
[19] Çellek, S. (2020). Effect of the slope angle and its classification on landslide. Natural Hazards and Earth System Sciences Discussions, 1-23. https://doi.org/10.5194/nhess-2020-87
[20] Roslee, R., Krishnan, R.B. (2023). Landslide susceptibility assessment in Sabah, Malaysia: A bivariate frequency ratio approach. Science, Engineering and Health Studies, 17: 23020004. https://doi.org/10.69598/sehs.17.23020004
[21] Tasoglu, I., Keskin, K., Citiroglu, H., Mekik, C. (2016). GIS-based landslide susceptibility assessment: A case study in Kelemen Valley (Yenice—Karabuk, NW Turkey). Environmental Earth Sciences, 75: 1291. https://doi.org/10.1007/s12665-016-6098-z
[22] Nourani, V., Pradhan, B., Ghaffari, H., Sharifi, S.S. (2014). Landslide susceptibility mapping at Zonouz Plain, Iran using genetic programming and comparison with frequency ratio, logistic regression, and artificial neural network models. Natural Hazards, 71(1): 523-547. https://doi.org/10.1007/s11069-013-0932-3
[23] Dai, F.C., Lee, C.F., Nhai, Y.Y. (2002). Landslide risk assessment and management: An overview. Engineering Geology, 64: 65-87. https://doi.org/10.1016/S0013-7952(01)00093-X
[24] Mwaniki, M.W., Agutu, N.O., Mbaka, J.G., Ngigi, T.G. Waithaka, E.H. (2015). Landslide scar/soil erodibility mapping using landsat TM/ETMþ bands 7 and 3 normalised difference index: A case study of central region of Kenya. Application of Geography, 64: 108-120. https://doi.org/10.1016/j.apgeog.2015.09.009
[25] Mertens, K., Jacobs, L., Maes, J., Kabaseke, C., Maertens, M., Poesen, J., Kervyn, M., Vranken, L. (2016). The direct impact of landslides on household income in tropical regions: A case study from the Rwenzori Mountains in Uganda. Science of The Total Environment, 550: 1032-1043. https://doi.org/10.1016/j.scitotenv.2016.01.171
[26] Nazrien Ng, J., Mohd Taib, A., Razali, I.H., Abd Rahman, N., Wan Mohtar, W.H.M., Karim, O.A., Desa, S.M., Awang, S., Mohd, M.S.F. (2022). The effect of extreme rainfall events on riverbank slope behaviour. Frontier Environment Science, 10. https://doi.org/10.3389/fenvs.2022.859427
[27] Rabby, Y.W., Li, Y. (2019). An integrated approach to map landslides in Chittagong hilly areas, Bangladesh, using Google Earth and Field Mapping. Landslides, 16: 633-645. https://doi.org/10.1007/s10346-018-1107-9
[28] Roslee, R., Felix, T., Norbert, S. (2018). A comparative evaluation of Normal Polygon Geotechnical Deterministic Analysis (NPGDA) and GEOStatistical INterpolation Techniques (Kriging) (GEOSTAINT-K): A case study from Kota Kinabalu area, Sabah, Malaysia. ASM Science Journal, 11(2): 1-18. https://search.app.goo.gl/V1i8X9R
[29] Alberti, S., Crosta, G.B., Wang, G., Dattola, G., Bertolo, D. (2017). Influence of graphite and serpentine minerals along landslide failure surfaces. Geophysical Research Abstracts, 19.
[30] Arbanas, Z., Dugonjic, S. (2010). Landslide risk increasing caused by highway construction. Risk Analysis, 333-342. https://api.semanticscholar.org/CorpusID:135016487
[31] Johanson, G. (2010). General Principles. Comprehensive Toxilogy, Elsevier Science.
[32] Schrag, M., Regal, K. (2013). Pharmacokinetics and Toxicokinetics. A Comprehensive Guide to Toxilogy in Nonclinical Drug Development, pp. 939-971. https://doi.org/10.1016/B978-0-12-803620-4.00004-9
[33] Jawien, W. (2014). Searching for an optimal AUC estimation method: A never-ending task? Journal of Pharmacokinetics and Pharmacodynamics, 41(6): 655-673. https://doi.org/10.1007/s10928-014-9392-y
[34] Saha, N. (2018). Clinical pharmacokinetics and drug interactions. Pharmaceutical Medicine and Translational Clinical Research, 473-497. https://doi.org/10.1016/B978-0-12-802103-3.00006-7
[35] Landis, J.R., Koch, G.G. (1977). The measurement of observer agreement for categorical data. Biometrics, 33(1): 159-174. https://doi.org/10.2307/2529310