Teuku Ferijal*![]() | Amir Fauzi
| Amir Fauzi![]()
© 2024 The authors. This article is published by IIETA and is licensed under the CC BY 4.0 license (http://creativecommons.org/licenses/by/4.0/).
OPEN ACCESS
This study aimed to determine the onset and effects of local climate change on rainfall patterns and dry spells in Banda Aceh and Aceh Besar. The onset of local climate change was determined by investigating an absurd change in minimum (Tn) and maximum (Tx) temperatures. The impacts of the change were analyzed by comparing the characteristics of rainfall and dry days in the pre- and post-onset periods. The results show that the onset of local climate change was in 2001, which is defined by a notable rise in both Tn and Tx. Shifting towards a wetter condition, characterized by an increase in total rainfall (Rtot) by 14% and a decrease in the dry day fraction by 5.5% in the post-onset period, was observed on an annual basis. However, seasonally, an increase of 5% in Rtot was found during the SON-DJF period, which was mainly contributed by the increase of 3% in the hard rain fraction. The results suggested an increase in the possibility of flooding during the rainy season and drought during the dry season. Meanwhile, Rtot decreased by 13% during MAM-JJA, with a slight increase in the dry day fraction in MAM. Local climate change has elevated the risk of water-related natural disasters such as droughts, floods, and landslides.
local climate change, change point detection, rainfall, hard rain, dry spells, Banda Aceh, Aceh Besar
The world's ecosystems are currently under serious threat of global warming, which is caused by human activities primarily through urbanization, deforestation, and industrialization. The activities, either directly or indirectly, continue to increase the amount of greenhouse gases emitted into the atmosphere, warming the earth by preserving heat. The increase in air temperatures changes the distribution of heat and moisture, thereby affecting the dynamics of the atmospheric circulation system that lead to the changes in rainfall patterns [1]. Increases in intensity and decreases in duration, which have been seen in many places of the world, are typically indicative of changes in rainfall patterns [2-5]. These modifications lead to the increases in extreme weather events, such as droughts, severe storms, flooding and dry spells.
Local climate change can be defined as changes in local meteorological features that are essentially the result of smaller-scale community activities, such as deforestation, agriculture, and changes in land use. These activities modify the natural environment and contribute to changes in climate patterns locally. For instance, extensive deforestation affects local weather patterns by altering surface albedo and reducing transpiration, which in turn affects temperature and rainfall [6-9]. Localized changes in temperature and rainfall patterns would have distinct and significant impacts on humans and environments. Therefore, it's important to understand the onset of local climate change and how it has affected the variations in temperature and rainfall patterns.
Previous studies have quantified the impact of climate change not only on rainfall patterns but also on dry spells [10-13]. Most of those studies utilized past, current, and also projected future climate data. Meanwhile, although still rarely conducted, it is essential to quantify the impacts of local climate change by comparing the rainfall patterns before and after changes in climate occurred. Such information is critically needed in an effort to prepare effective and regional-specific mitigation actions against the potential impacts of climate change [14, 15].
Rising global temperatures are a sign of climate change that has been going on since the industrial revolution in 1850. The shift happens unevenly because of numerous local and regional factors. Topography, location, and the kinds of greenhouse gases generated by main community activities are among the determining factors [16]. Since air temperature varies in direct proportion to the amount of greenhouse gases in the atmosphere, it is one of the most important indicators of climate change. Therefore, by looking into a notable increase in air temperature, it is feasible to determine the onset of local climate change.
Banda Aceh City and Aceh Besar District experienced very significant land use and land cover changes. The main catalyst for the changes is believed to be the tsunami restoration and reconstruction projects. A drawback of the rehabilitation effort was the growing demand for construction resources like wood and timber. According to Eye on Aceh [17], Aceh had a sharp rise in deforestation following the tsunami. Between 2007 and 2020, the Banda Aceh and Aceh Besar regions lost their primary forest for approximately 500 hectares annually [18]. The rapid growth rate of the built-up area threatens the presence of green spaces in the area, particularly because development is concentrated in areas that are distant from the coast [19].
The frequency of flood and drought disasters in the Banda Aceh and Aceh Besar areas has shown a significant increase. Data from the National Disaster Management Authority (gis.bnpb.go.id) indicates that floods have been the most prominent disaster, with at least one flood incident documented in the areas per year since 2017. Over 500 families had to be evacuated as a result of Aceh Besar's heavily populated districts being affected by the most recent flood catastrophe in 2021 [20]. Despite the fact that drought is difficult to measure, a growing threat of drought has also been observed in the area with the increased frequency of crop failures [21]. In 2020, this region experienced the worst rice crop failure reaching nearly 2,500 ha [22].
The increased flood and drought events in the area are a sign of changes in rainfall patterns. Flooding risk increase with the increase in hard rain occurrence. Numerous researches conducted worldwide in the past utilized consecutive dry days (dry spells) for the assessment of drought severity [23-25]. Therefore, this study aims to analyze the impact of local climate change on rainfall patterns and dry spells in Banda Aceh and Aceh Besar. The potential risks of flooding and drought were analyzed using the characteristics of hard rain and dry spells. The onset of local climate change is determined based on the abrupt change in temperature detected using the change detection method.
2.1 Study area and data
The study area is located in the province of Aceh, Indonesia, in the southernmost region of Sumatera Island. It comprises the cities of Banda Aceh and Aceh Besar. This area has two rainy seasons: September–November and March–May, and a dry season: July-August [26]. The area is fed by a main river, the Krueng Aceh River, that begins in the mountainous area of Aceh Besar and ends on the coast of Banda Aceh, with an area of ±1,780 km2. The river has a very important role, especially as a major source of water for the surrounding communities and irrigation water for the 7.384 ha irrigation area [27]. Lowland paddy cultivation predominates, and typically farming begins in October for the first round and in March for the second round. In some locations, farmers cultivating secondary crops required less water, such as corn, soybeans, and peanuts, during the second round due to limited access to irrigation water.
Figure 1. Study area
Climatological data obtained from the meteorological station Sultan Iskandar Muda (WMO ID: 96011), located in the District of Aceh Besar, approximately 12 km from Banda Aceh’s shoreline (Figure 1). The station is considered a representation of the climate of Banda Aceh City and the northern Aceh Besar District because of its location close to the border of Banda Aceh and Aceh Besar. The station has the longest recorded climatological data in the province. This study used daily rainfall, maximum and minimum temperatures recorded from January 1, 1982, to December 31, 2022. Then, the average of daily maximum (minimum) temperature over the year is noted as Tx (Tn). The data is available for download on the website of Indonesian Agency for Meteorology, Climatology, and Geophysics (BMKG, https://dataonline.bmkg.go.id/home).
2.2 Local climate change detection
Local climate change is defined as the year in which both Tx and Tn exhibit abrupt change. The location of change is determined using a non-parametric Pettitt’s test at 5% significance level. The test is designed to identify the location of the most abrupt shift in time series data. The null hypothesis of the test is that the data is homogenous, meaning there is no abrupt change in the data series. The hypothesis is tested by splitting the data into two segments, x1, x2, ... xt, and xt+1, ... xT; if the mean of each segment remains constant, then the data is considered homogeneous throughout the observation period [28]. The statistical test U(t,T) is given as follow:
$U_{t, T}=U_{t-1, T}+\sum_{j=1}^T \operatorname{sgn}\left(x_t-x_j\right)$ for $t=2, \ldots, T$
and
$\operatorname{sgn}\left(x_t-x_j\right)=\left\{\begin{array}{cc}1 & \text { if } x_t>x_j \\ 0 & \text { if } x_t=x_j \\ -1 & \text { if } x_t<x_j\end{array}\right.$
The location of the most significant shift in the dataset and its significance probability are given by Kτ and p.
$\begin{gathered}K_\tau=\max \left|U_{t, T}\right| \\ p=2 \exp \left(\frac{-6 K_\tau^2}{T^2+T^3}\right)\end{gathered}$
The null hypothesis is rejected if p is less than the level of significance, meaning that there is a significant change in series at xτ. Due to its simplicity, resilience to outliers, and ability to handle single or multiple change points, the test has been applied in a wide range of fields, including hydrology such as precipitation, temperature, and runoff [28-30]. Previous studies even demonstrated that the test's capabilities are equivalent to those of other more sophisticated parametric tests that needed population parameter information [31, 32].
2.3 Rainfall patterns and dry spells
Total rainfall (Rtot), is defined as the amount of rain that falls on a wet day for a certain period of time. A threshold of 2.5 mm of rainfall per day is chosen to differentiate between wet and dry days. The threshold is chosen to account for measurement errors and losses from evapotranspiration [33]. Additionally, the threshold complies with the recommendations for tropical regions suggested by Marjuki et al. [34]. Consequently, a day is considered wet if it has precipitation of 2.5 mm or more.
Rtot is composed by light and hard rains. A daily rainfall of 50 mm was chosen to account for both light and hard rains, and this also aligns with the BMKG criteria for daily rainfall intensities. Consequently, rain falling on a wet day that is equivalent to or more than 50 mm is referred to as a hard rain. Annual Rtot is the accumulated rainfall that occurs on wet days in a year. The hard (light) rain fraction is the percentage of accumulated hard (light) rains in the annual Rtot.
The duration of a dry spell is the number of dry days within a dry spell, and the frequency of a dry spell is the number of occurrences of a certain duration of a dry spell. Both the rainfall and dry spell characteristics for the periods of pre- and post-onset were analyzed on an annual and seasonal basis. Four seasons were taken into account: December-February (DJF); March-May (MAM); June-August (JJA); and September-November (SON). SON and MAM represent the first and second rainy seasons, DJF is the transition period from the first to the second rainy season, and JJA is the peak dry season.
3.1 Local climate change onset
Figure 2 shows that Tx and Tn tend to increase over the studied period (1982-2022). The variations are more likely influenced by the ENSO modulation in which Tx increased (decreased) during El Nino (La Nina) years. Significant raises in Tx are found in 1987, 1998, 2016 and 2019; which strongly correlate with occurrences of very strong El Nino year in 1986/1987, 1997/1998 and 2015/2016. Tx was very low in 1996 and 2000 which can be explained by the occurrences of moderate and strong La Nina years in 1995/1996 and 1999/2000, respectively. After 2001, Tx grows dramatically, resulting in a higher average of Tx during that time period than before 2001. Tn also progressively increases from 22.2℃ to 23.8℃ in the period 2002-2020. The impact of El Nino on Tn can also be seen in a significant spike in 1998. The growth in Tn and the significant jump in Tx are compelling evidence of a consistent increase in air temperature.
Figure 2. Tx (empty circles) and Tn (filled circles) for the 1982-2022 period
The solid (dashed) lines represent temperature average prior (after) change points.
The change point test indicates the presence of abrupt change in both Tx and Tn. The change point of Tx is 2001, with a clear difference in the average of the pre- and post-change point periods. Meanwhile, the significant change point of Tn is detected at 2011, and the gap between the average of pre- and post-change point periods is nearly 1℃. The location of the abrupt change differs between Tx and Tn, suggesting that the increase in Tn happens less abruptly than in Tx. Tn, which stands for the situations in the morning/night time, changes more gradually yet steadily. These findings are consistent with other studies that discovered the expansion and development of urban areas had a significant impact on the gradual rise in Tn [34].
Figure 2 reveals a strong indication of the change starting at 2001, as Tn increases by around 0.7℃ per decade following 2001. Therefore, 2001 is selected as the onset of local climate change for the study area. The observation period is then split into pre- (1982–2000) and post-onset (2001–2022) periods. The averages of both Tx and Tn in the post-onset period are 0.6℃ higher than in the pre-onset period.
A consistent increase in maximum temperature indicates a warming trend, which impacts on the environment, agriculture, as well as human health. In tropical areas, increased air temperatures are expected to alter both hydrology and agriculture, causing changes in rainfall patterns, modifying growth seasons, and increasing evapotranspiration [35-37]. Crops that are sensitive to the availability and quality of water, such as paddy, may suffer greatly from these consequences. Therefore, it is crucial to have effective strategies to mitigate the impacts, such as crop diversification, enhanced water management, and climate-resilient agriculture [38].
3.2 Rainfall characteristics
Figure 3 depicts variations in the annual Rtot and hard rain fraction. Long-term mean annual Rtot was nearly 1,560 mm, and there is an indication of an increasing trend in which mean annual Rtot in the post-onset period is 14% higher than in the pre-onset period. Rtot increased at a very significant rate, especially in the last ten years, when it increased by almost 170 mm per year. Since annual rainfall variations are influenced by ENSO circulation [39], the correlation between Rtot and Oceanic Nino Index (ONI) was analyzed. ONI is the main indicator used to measure and monitor the La Nina and El Nino events. The index, averaged over a three-month period, is available online (https://www.cpc.ncep.noaa.gov/ data/indices/oni.ascii.txt).
Figure 3. Light and hard rain fractions in annual rainfall
Seasonal and annual ONI indices were evaluated for their linear correlation with Rtot using Spearman’s correlation coefficient. The Spearman correlation is a nonparametric measure of the strength of the monotonic relationship between two paired datasets. The test does not require the assumption that both datasets are normally distributed. The correlation was computed with the help of the Scipy public Python package. The results suggested that Rtot has a negative (positive) correlation with DJF and MAM (JJA and SON) indices in the pre-onset period. Meanwhile, Rtot negatively correlates with all seasonal ONI indices except DJF in the post-onset period. Only the JJA and SON indices in the post-onset, however, showed a significant correlation with Rtot at 95% confidence. The findings indicate the increased ENSO influence on Rtot in the post-onset period, particularly during the JJA and SON. The outcome is consistent with the earlier research, which discovered that ENSO will affect rainfall in this region more in the future (2006–2035) than it did in the past (1981–2010) [40].
In general, the average hard rain fraction in annual Rtot increases from approximately 19% during pre-onset to 24% in the post-onset period. There are some years without hard rain events (1987, 2003, and 2005), as well as some years with hard rain fractions greater than 50% (2018 and 2021). The pre-onset period had a minor 10% rise in the hard rain fraction. After the onset, the fraction exhibited a tendency to decline until it started to grow strongly again in 2016. Consequently, when the data concluded in 2012, previous studies [41] revealed a decline in the hard rainfall fraction. The average total hard rain annually in the period 2016-2002 increased nearly 550% compared to the average in the period 1982-2015.
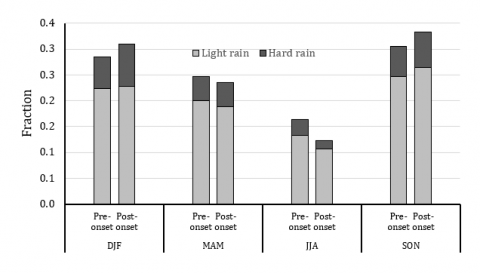
Figure 4 shows that approximately 60% of Rtot is distributed in SON-DJF and increases approximately 5% in the post-onset period. The increases are mainly contributed by the increases in hard rain fraction, particularly in DJF. Conversely, due to the decreases in both light and hard rains, seasonal Rtot decreases in both MAM and JJA by 13%. In the post-onset period, hard rain events in JJA are only found in the last 7 years. Similarly, during the post-onset, hard rain events in MAM concentrated within the last decade. The condition caused MAM-JJA to become very dry within the last decade. Overall, the highest increase (decrease) in hard rain fraction is found in DJF (JJA) by 33% (49%). These results are in compliance with an earlier study that used corrected satellite data and discovered a trend toward increased seasonal rainfall in DJF and SON and decreasing seasonal rainfall in MAM [35].
Figure 4. Seasonal light and hard rain fraction during pre- and post-onset
The impact of local climate change caused more hard rain events to occur during the SON and DJF. This condition caused the period of SON-DJF to become wetter and the period MAM, as second rainy season, and JJA to become drier.
Supari et al. [41] claimed that the impacts of increased ENSO influence in this region were responsible for similar regional tendencies. A significantly increased hard rain fraction, particularly in the last 7 years (2016–2022), caused the increase in Rtot meaning more water is available, which somehow benefits the community and agriculture of the area. However, a higher percentage of hard rain can have serious and far-reaching impacts on agriculture and the community. It has been established that agriculture is impacted by hard rain, including crop development, soil quality, and overall productivity [42, 43].
An increase in hard rain events has been documented to exaggerate water-related disasters such as flooding and landslides across the country [44]. Increased hard rain events during the initial (SON) or late (DJF) planting periods have been documented to be the main factor in crop failure in the area that caused flooding due to poor drainage [45, 46]. Meanwhile, a drier condition during MAM increases the threat of drought for secondary crops planted in areas where irrigation water is scarce. This is also one of the reasons why many farmers do not cultivate their agricultural land. Therefore, it is important to have effective strategies to minimize the impact of increased hard rain events such as effective soil management, efficient irrigation and water management, and flood control and drainage infrastructure [42]. These measures reduce soil erosion, improve soil structure, and prevent flooding, while also enhancing water drainage and preventing flooding through the use of rainwater harvesting systems.
3.3 Dry spell characteristics
Figure 5 shows annual dry day fraction and annual maximum duration of dry spell (mxDS). The fraction varied from 58.4% to nearly 80%, with an average of 71% or equals to 256 days. The average annual fraction in the pre-onset period is 73.6% and then decreases to 68.14% in the post-onset period. The figure also depicts that more years with a dry day fraction of less than 70% are found in the post-onset period, indicating an increase in variation of the annual dry day fraction. The highest and lowest fractions for both pre- and post-onset periods are found in the JJA and SON, respectively.
Figure 5. Annual seasonal dry day fractions (%) and maximum dry spell duration (days)
Annual mxDS reveals that extremely long dry spells are found in some years including 1985, 1998, 2002, and 2015. Nonetheless, the longest mean dry spell duration is detected in JJA, extending 7.2 and 6.9 days for the pre- and post-onset periods, respectively. Overall, the annual mxDS decrease by 2 days per decade, although there is a significantly high mxDS in 2015. The coefficient variation mxDS increased from 0.3 in the pre-onset to 0.45 in the post-onset. Correlation tests between two dry spell indices (the annual dry day fraction and mxDS) and the ONI index indicated that the two indices had no meaningful correlation with the ONI index during the pre-onset period. However, the mxDS showed a strong positive correlation with the JJA (0.53) and SON (0.49) indices during the post-onset period. This result complies with earlier research that indicated that ENSO had a stronger impact on mxDS in this area [15, 47].
Figure 6 shows the fraction of dry spells for each duration in the pre- and post-onset periods. The largest fraction is discovered to have originated from a 2-day spell in the pre-onset period, which then changes to a 3-day spell in the post-onset period. The findings are consistent with previous studies demonstrating that short durations, such two or three days of dry spells, typically have the largest fraction in total dry day [47, 48]. The shift to a longer duration explains a strong association with rising temperatures in the post-onset period. Increased dry spell durations associate with the increased air temperature was also observed in previous study [49] indicated that higher temperature is always associated with the increase in dry spells duration.
Figure 6. Duration and fraction of DS pre- and post-onset
The accumulative dry day fraction drops from 78.5% in the pre-onset period to 73.6% in the post-onset period. The fractions from short dry spells (up to 11 days) are very similar in both periods. Similarly, the fractions from long dry spells (longer than 45 days) in both periods are also identical, despite an increase in mxDS in the post-onset period. Therefore, the decreased total dry day fraction in the post-onset period is due to the decreased intermediate dry spell fraction (12-45 day). The results agree with study by Li et al. [47] who found the decreases in total duration and frequency of dry spell over Singapore. However, there are regional variations in how climate change affects dry spells. Ye and Fetzer [49] discovered that between 1966 and 2010, the length of dry spells increased. Meanwhile, Yang et al. [15] compared data from the period 1979-1998 with that from the period 1999-2018 and discovered distinct changes in the frequency and duration of dry spells across Canada. Overall, our findings support previous research that concluded the short dry season fraction predominates in humid regions [50]. Studies, however, indicated shorter and more frequent dry spells can still have significant impacts on ecosystems, water supplies, and agriculture [13, 50].
The decrease in total dry day fraction during post-onset is observed in all seasons, except in MAM (Table 1). All extreme dry spells during the post-onset period occurred in MAM, leading to an increase in the fraction of long dry spell (>45 days) and also in total dry day fraction. The long dry spell events that take place during the initial planting period (DJF and MAM) may affect rice growth at the early stage, such as germination, root growth, and leaf development, which are temperature-sensitive. This is because the long dry spell events are strongly linked to high temperatures.
Table 1. Changes in the dry spell’s fraction during the pre- and post-onset of local climate change
|
Duration |
Unit |
Annual |
DJF |
MAM |
JJA |
SON |
|
All |
% |
-5.4 |
-2.8 |
0.3 |
-1.7 |
-1.2 |
|
1-11-days |
% |
0.07 |
-0.18 |
-0.84 |
2.46 |
-1.37 |
|
12-20 -days |
% |
-2.03 |
-0.48 |
0.17 |
-1.71 |
-0.01 |
|
21-45 -days |
% |
-3.40 |
-1.48 |
-0.40 |
-1.75 |
0.23 |
|
>45-days |
% |
-0.02 |
-0.67 |
1.39 |
-0.74 |
0 |
JJA contributes the most to the decrease in the intermediate dry spell fraction (-3.46%) and has increased short dry spell fraction, indicating an increase in the number of wet days that break the series of dry days, causing the decrease in the longer dry spell fraction. The reduction in Rtot during JJA suggested a shift to drier conditions, despite a reduction in the total DS fraction. The increased drought during JJA was attributed to the prominent impacts of ENSO in the region [51]. Because rice and secondary crops have a high risk of crop failure from drought, particularly during the generative stages of the plant [52], many farmers are hesitant to plant them during the second round of planting as the potential drought worsens during MAM and JJA.
Air temperature is one of the climate parameters that is sensitive to global warming due to increasing levels of greenhouse gases in the air. Characterized by a significant increase in Tx and a gradual increase in Tn, the change point test indicates that 2001 is the onset of local climate change in the Banda Aceh and Aceh Besar areas. Annual Rtot increases in the post-onset period as a result of the strengthening influence of ENSO. The increase is largely due to an increase in the volume of hard rain in rainy and transition seasons (SON-DJF), especially in the last 7 years since 2016. In the meantime, the dry day fraction decreases in all seasons except MAM during the post-onset period, which contributes 5.4% of the total decrease. A shift to wetter conditions appears to be reflected in the annual increase in total rainfall and decrease in the number of dry days. The local community and agriculture, of which the majority consists of lowland rice farmers, will benefit from this.
However, because of their possible effects on the ecosystem, there are a few points about local climate change in the Banda Aceh and Aceh Besar districts that are crucial to take into account and require careful consideration.
The impacts of local climate change in this study are similar to those seen in most other parts of the world [53]. Therefore, it is important to have holistic and adaptive approaches to dealing with climate change impacts, including sustainable water harvesting and enhanced infrastructure resilience [54]. To maintain a stable and safe water supply, it is also important to put forth integrated efforts within sectors, supported by strong regulations and governance [55, 56].
The limited number of meteorological stations with long data records in the studied area makes it difficult to carry out analysis at a broader stage. Since the local climate of one region can be different from other regions, the onset of local climate change in other regions might also be different. However, the approach used in this study is quite relevant and can be applied across distinct regions, even when other climate parameters are taken into account.
This research is supported by the Ministry of Education, Culture, Research, and Technology of Indonesia through the Research and Community Service Institution (LPPM) Universitas Syiah Kuala (Grant number: 253/UN11.2.1/PT.01.03/PNBP/2023).
[1] Climate Change and Land: An IPCC Special Report on Climate Change Desertification, Land Degradation, Sustainable Land Management, Food Security, and Greenhouse Gas Fluxes in Terrestrial Ecosystems. https://www.ipcc.ch/srccl/, accessed on Apr. 3, 2024.
[2] Trenberth, K.E., Dai, A., Rasmussen, R.M., Parsons, D.B. (2003). The changing character of precipitation. Bulletin of the American Meteorological Society, 84(9): 1205-1218. https://doi.org/10.1175/BAMS-84-9-1205
[3] Groisman, P.Y., Knight, R.W., Easterling, D.R., Karl, T.R., Hegerl, G.C., Razuvaev, V.N. (2005). Trends in intense precipitation in the climate record. Journal of Climate, 18(9): 1326-1350. https://doi.org/10.1175/JCLI3339.1
[4] Qian, W., Fu, J., Yan, Z. (2007). Decrease of light rain events in summer associated with a warming environment in China during 1961–2005. Geophysical Research Letters, 34(11). https://doi.org/10.1029/2007gl029631
[5] Allan, R.P., Soden, B.J., John, V.O., Ingram, W., Good, P. (2010). Current changes in tropical precipitation. Environmental Research Letters, 5(2): 025205. https://doi.org/10.1088/1748-9326/5/2/025205
[6] Alkama, R., Cescatti, A.J.S. (2016). Biophysical climate impacts of recent changes in global forest cover. Science, 351(6273): 600-604. https://doi.org/10.1126/science.aac8083
[7] Li, Y., Zhao, M., Mildrexler, D. J., Motesharrei, S., Mu, Q., Kalnay, E., Zhao, F., Li, S.C., Wang, K. (2016). Potential and actual impacts of deforestation and afforestation on land surface temperature. Journal of Geophysical Research: Atmospheres, 121(24): 14,372-14,386. https://doi.org/10.1002/2016JD024969
[8] Tölle, M.H., Engler, S., Panitz, H.J. (2017). Impact of abrupt land cover changes by tropical deforestation on Southeast Asian climate and agriculture. Journal of Climate, 30(7): 2587-2600. https://doi.org/10.1175/JCLI-D-16-0131.1
[9] Prevedello, J.A., Winck, G.R., Weber, M.M., Nichols, E., Sinervo, B. (2019). Impacts of forestation and deforestation on local temperature across the globe. PloS One, 14(3): e0213368. https://doi.org/10.1371/journal.pone.0213368
[10] Hosseinzadehtalaei, P., Tabari, H., Willems, P. (2020). Climate change impact on short-duration extreme precipitation and intensity–duration–frequency curves over Europe. Journal of Hydrology, 590: 125249. https://doi.org/10.1016/j.jhydrol.2020.125249
[11] Ostad-Ali-Askari, K., Kharazi, H.G., Shayannejad, M., and Zareian, M.J. (2020). Effect of climate change on precipitation patterns in an arid region using GCM models: Case study of Isfahan-Borkhar Plain. Natural Hazards Review, 21(2), 04020006. https://doi.org/10.1061/(ASCE)NH.1527-6996.0000367
[12] Marinović, I., Cindrić Kalin, K., Güttler, I., Pasarić, Z. (2021). Dry spells in Croatia: Observed climate change and climate projections. Atmosphere-Basel, 12(5): 652. https://doi.org/10.3390/atmos12050652
[13] Hettiarachchi, S., Wasko, C., Sharma, A. (2022). Do longer dry spells associated with warmer years compound the stress on global water resources? Earth's Future, 10(2): e2021EF002392. https://doi.org/10.1029/2021EF002392
[14] Donat, M.G., Lowry, A.L., Alexander, L.V., O’Gorman, P.A., Maher, N. (2016). More extreme precipitation in the world’s dry and wet regions. Nature Climate Change, 6(5): 508-513. https://doi.org/10.1038/nclimate2941
[15] Yang, Y., Gan, T.Y., Tan, X. (2021). Recent changing characteristics of dry and wet spells in Canada. Climatic Change, 165(3): 42. https://doi.org/10.1007/s10584-021-03046-8
[16] Hansen, J., Sato, M. (2016). Regional climate change and national responsibilities. Environmental Research Letters, 11(3): 034009. https://doi.org/10.1088/1748-9326/11/3/034009
[17] Indonesia: Challenges of forest governance in Aceh. https://reliefweb.int/report/indonesia/indonesia-challenges-forest-governance-aceh, accessed on Apr. 22, 2024.
[18] Syahputra, Y.A., Saleh, M.B., Puspaningsih, N. (2021). Land cover change prediction using Markov Chain and ANN-Markov Model in Krueng Aceh Watershed. Journal of Watershed Management Research, 5(2): 185-206. https://doi.org/10.20886/jppdas.2021.5.2.185-206
[19] Achmad, A., Hasyim, S., Dahlan, B., Aulia, D. N. J. A. g. (2015). Modeling of urban growth in tsunami-prone city using logistic regression: Analysis of Banda Aceh, Indonesia. Applied Geography, 62: 237-246. https://doi.org/10.1016/j.apgeog.2015.05.001
[20] Ratusan Rumah di Aceh Besar Terendam Banjir. https://aceh.tribunnews.com/2021/07/11/ratusan-rumah-di-aceh-besar-terendam-banjir, accessed on Apr. 12, 2024.
[21] Pemkab Aceh Besar Berikan Ganti Rugi Untuk Petani Yang Gagal Panen Tahun 2019. https://suaraaceh.net/2020/11/06/pemkab-aceh-besar-berikan-ganti-rugi-untuk-petani-yang-gagal-panen-tahun-2019/, accessed on May 12, 2024.
[22] Indra, I., Ula, N., Nugroho, A. (2023). Implementation of agricultural insurance for sustainable food crop in Mutiara Timur and Suka Makmur Sub Districts. IOP Conference Series: Earth and Environmental Science, 1183(1): 012095. https://doi.org/10.1088/1755-1315/1183/1/012095
[23] Mupangwa, W., Walker, S., Twomlow, S. (2011). Start, end and dry spells of the growing season in semi-arid southern Zimbabwe. Journal of Arid Environments, 75(11): 1097-1104. https://doi.org/10.1016/j.jaridenv.2011.05.011
[24] Li, Z., Li, Y., Shi, X., Li, J. (2017). The characteristics of wet and dry spells for the diverse climate in China. Global and Planetary Change, 149: 14-19. https://doi.org/10.1016/j.gloplacha.2016.12.015
[25] Byakatonda, J., Parida, B.P., Kenabatho, P.K., Moalafhi, D.B. (2018). Prediction of onset and cessation of austral summer rainfall and dry spell frequency analysis in semiarid Botswana. Theoretical and Applied Climatology, 135(1): 101-117. https://doi.org/10.1007/s00704-017-2358-4
[26] Aldrian, E., Dwi Susanto, R. (2003). Identification of three dominant rainfall regions within Indonesia and their relationship to sea surface temperature. International Journal of Climatology, 23(12): 1435-1452. https://doi.org/10.1002/joc.950
[27] Ferijal, T., Mustafril, Jayanti, D.S. (2016). Dampak perubahan iklim terhadap debit andalan sungai krueng Aceh. Rona Teknik Pertanian, 9(1): 50-61. https://doi.org/10.17969/rtp.v9i1.4407
[28] Xie, H., Li, D., Xiong, L. (2013). Exploring the ability of the Pettitt method for detecting change point by Monte Carlo simulation. Stochastic Environmental Research and Risk Assessment, 28: 1643-1655. https://doi.org/10.1007/s00477-013-0814-y
[29] Li, D., Xie, H., Xiong, L. (2014). Temporal change analysis based on data characteristics and nonparametric Test. Water Resour Manage, 28(1): 227-240. https://doi.org/10.1007/s11269-013-0481-2
[30] Conte, L.C., Bayer, D.M., Bayer, F.M. (2019). Bootstrap Pettitt test for detecting change points in hydroclimatological data: Case study of Itaipu Hydroelectric Plant, Brazil. Hydrological Sciences Journal, 64(11): 1312-1326. https://doi.org/10.1080/02626667.2019.1632461
[31] Bickici Arikan, B., Kahya, E. (2019). Homogeneity revisited: Analysis of updated precipitation series in Turkey. Theoretical and Applied Climatology, 135(1): 211-220. https://doi.org/10.1007/s00704-018-2368-x
[32] Bates, B.C., Chandler, R.E., Bowman, A.W. (2012). Trend estimation and change point detection in individual climatic series using flexible regression methods. Journal of Geophysical Research: Atmospheres, 117(D16). https://doi.org/10.1029/2011JD017077
[33] Rivoire, P., Tramblay, Y., Neppel, L., Hertig, E., Vicente-Serrano, S.M. (2019). Impact of the dry-day definition on Mediterranean extreme dry-spell analysis. Natural Hazards and Earth System Sciences, 19(8): 1629-1638. https://doi.org/10.5194/nhess-19-1629-2019
[34] Marjuki, van der Schrier, G., Klein Tank, A.M., van den Besselaar, E.J., Nurhayati, Swarinoto, Y.S. (2016). Observed trends and variability in climate indices relevant for crop yields in Southeast Asia. Journal of Climate, 29(7): 2651-2669. https://doi.org/10.1175/jcli-d-14-00574.1
[35] Irwandi, H., Rosid, M.S., Mart, T. (2023). Effects of Climate change on temperature and precipitation in the Lake Toba region, Indonesia, based on ERA5-land data with quantile mapping bias correction. Scientific Reports, 13(1): 2542. https://doi.org/10.1038/s41598-023-29592-y
[36] Talebmorad, H., Eslamian, S., Mousavi, S., Akhavan, S., Ostad-Ali-Askari, K., Singh, V. (2020). Evaluation of the impact of climate change on reference crop evapotranspiration in Hamedan-Bahar plain. International Journal of Hydrology Science and Technology, 11(3): 333-347. https://doi.org/10.1504/IJHST.2021.114554
[37] Loo, Y.Y., Billa, L., Singh, A. (2015). Effect of climate change on seasonal monsoon in Asia and its impact on the variability of monsoon rainfall in Southeast Asia. Geoscience Frontiers, 6(6): 817-823. https://doi.org/10.1016/j.gsf.2014.02.009
[38] Malhi, G.S., Kaur, M., Kaushik, P. (2021). Impact of climate change on agriculture and its mitigation strategies: A review. Sustainability, 13(3): 1318. https://doi.org/10.3390/su13031318
[39] Zhao, M., Guo, S., Wang, R. (2021). Diverse soil respiration responses to extreme precipitation patterns in arid and semiarid ecosystems. Applied Soil Ecology, 163: 103928. https://doi.org/10.1016/j.apsoil.2021.103928
[40] Qalbi, H.B., Faqih, A., Hidayat, R. (2017). Future rainfall variability in Indonesia under different ENSO and IOD composites based on decadal predictions of CMIP5 datasets. IOP Conference Series: Earth and Environmental Science, 54(1): 012043. https://doi.org/10.1088/1755-1315/54/1/012043
[41] Supari, Tangang, F., Juneng, L., Aldrian, E. (2017). Observed changes in extreme temperature and precipitation over Indonesia. International Journal of Climatology, 37(4): 1979-1997. https://doi.org/10.1002/joc.4829
[42] Iizumi, T., Iseki, K., Ikazaki, K., Sakai, T., Shiogama, H., Imada, Y., Batieno, B.J. (2024). Increasing heavy rainfall events and associated excessive soil water threaten a protein-source legume in dry environments of West Africa. Agricultural and Forest Meteorology, 344: 109783. https://doi.org/10.1016/j.agrformet.2023.109783
[43] Schmitt, J., Offermann, F., Söder, M., Frühauf, C., Finger, R. (2022). Extreme weather events cause significant crop yield losses at the farm level in German agriculture. Food Policy, 112: 102359. https://doi.org/10.1016/j.foodpol.2022.102359
[44] Ramadhan, R., Marzuki, M., Yusnaini, H., Muharsyah, R., Suryanto, W., Sholihun, S., Vonnisa, M., Battaglia, A., Hashiguchi, H. (2022). Capability of GPM IMERG products for extreme precipitation analysis over the Indonesian Maritime Continent. Remote Sensing, 14(2): 412. https://doi.org/10.3390/rs14020412
[45] Kita, L. (2024). Suka duka petani padi di Aceh Besar. https://www.lensakita.com/2024/02/07/suka-duka-petani-padi-di-aceh-besar/, accessed on May 10, 2024.
[46] Petani Simpang Tiga Pasrah Alami Dua Kali Bencana Banjir, 170 Hektar Sawah Terendam. https://acehbesarkab.go.id/berita/kategori/pertanian/petani-simpang-tiga-pasrah-alami-dua-kali-bencana-banjir-170-hektar-sawah-terendam, accessed on May 5, 2024.
[47] Li, X., Meshgi, A., Babovic, V. (2016). Spatio-temporal variation of wet and dry spell characteristics of tropical precipitation in Singapore and its association with ENSO. International Journal of Climatology, 36(15): 4831-4846. https://doi.org/10.1002/joc.4672
[48] Mandapaka, P.V., Qin, X., Lo, E.Y.M. (2017). Analysis of spatial patterns of daily precipitation and wet spell extremes in Southeast Asia. International Journal of Climatology, 37: 1161-1179. https://doi.org/10.1002/joc.5073
[49] Ye, H., Fetzer, E.J. (2019). Asymmetrical shift toward longer dry spells associated with warming temperatures during Russian summers. Geophysical Research Letters, 46(20): 11455-11462. https://doi.org/10.1029/2019gl084748
[50] Huang, L., Du, H., Dang, Y., He, H. S., Wang, L., Na, R., Li, N., Wu, Z. (2023). Observed and projected changes in wet and dry spells for the major river basins in East Asia. International Journal of Climatology, 43(12): 5369-5386. https://doi.org/10.1002/joc.8151
[51] Supari, Tangang, F., Salimun, E., Aldrian, E., Sopaheluwakan, A., Juneng, L. (2018). ENSO modulation of seasonal rainfall and extremes in Indonesia. Climate Dynamics, 51(7): 2559-2580. https://doi.org/10.1007/s00382-017-4028-8
[52] Molla, T., Tesfaye, K., Mekbib, F., Tana, T., Taddesse, T. (2021). Supplementary irrigation for managing the impact of terminal dry spells on the productivity of rainfed rice (Oryza sativa L.) in Fogera Plain, Ethiopia. Heliyon, 7(2021): e06703. https://doi.org/10.1016/j.heliyon.2021.e06703
[53] Ovchynnykova, O., Martinkienė, J., Navickas, V. (2024). Enhancing global sustainability: The role of the blue economy in preserving natural capital. Challenges in Sustainability, 12(1): 65-79. https://doi.org/10.56578/cis120105
[54] Diaz, P., Yeh, D. (2014). 2 - Adaptation to climate change for water utilities. Water Reclamation and Sustainability, 19-56. https://doi.org/10.1016/B978-0-12-411645-0.00002-X
[55] Iglesias, A., Garrote, L. (2015). Adaptation strategies for agricultural water management under climate change in Europe. Agricultural Water Management, 155: 113-124. https://doi.org/10.1016/j.agwat.2015.03.014
[56] Nti, E.K., Wongnaa, C.A., Edusah, N.S.E., Awunyo-vitor, D., Kyei, V.B. (2021). Towards financial sustainability: Beneficiaries’ perception and performance of community water supply services in Ghana. Challenges in Sustainability, 9(1): 45-58. https://doi.org/10.12924/cis2021.09010045