Mokhamad Tirono*![]() | Farid Samsu Hananto
| Farid Samsu Hananto![]()
© 2024 The authors. This article is published by IIETA and is licensed under the CC BY 4.0 license (http://creativecommons.org/licenses/by/4.0/).
OPEN ACCESS
The public needs curcumin because it has strong anti-inflammatory and antioxidant effects. As the human population increases, agricultural land decreases. Increasing the curcumin content in red turmeric is necessary to maintain its availability. This research aims to optimize production results and red turmeric's curcumin, magnesium, iron, and oxalic acid content. This research uses a magnetic field (MF) whose magnetic flux density (MFD) changes over time; the exposure time was 20 minutes and repeated every day for five days. The results showed that exposure to 0.2 mT MFD increased production by 42.96% and iron content by 13.20%. Exposure to 0.3 mT MFD increased curcumin content by 85.95% and magnesium by 33.39%. Exposure to 0.7 mT MFD increased the oxalic acid content by 4.04%. Not all essential substances contained in turmeric change due to MF processing. Using MF with an MFD that changes over time requires a low value.
curcumin, exposure, magnetic flux, oxalate, turmeric
Turmeric (Curcuma longa), the most important source of curcuminoids, which consist of curcumin and two related compounds, namely demethoxycurcumin and bisdemethoxycurcumin [1]. Currently, in several countries, curcumin is a food supplement and primary ingredient for pharmaceutical applications to prevent disease [2]. Curcumin has very strong anti-inflammatory and antioxidant effects. In general, people consume turmeric without processing it, so it requires a large amount to fulfill the dose. Besides curcumin, turmeric contains oxalic acid, which, if it interacts with calcium, can cause kidney problems [3]. The curcumin content in turmeric is not too high, namely around 0.26-8.9% [4, 5] and oxalate is around 0.252% [6, 7]. As the human population increases and agricultural land decreases, increasing the quality of food is urgently needed so that quantity requirements can be reduced.
Various efforts have been made to improve the quality of food products, both during food processing and agricultural processes. Handling when processing food products is carried out using non-thermal processing techniques. Handling during product processing is carried out to prevent a decrease in product quality. Handling during the agricultural process is carried out to improve food quality. Therefore, processing processes in the agricultural system are very necessary. Several methods have been used in agricultural processing systems to produce quality food products, including biostimulants or rhizosphere microbiomes [8] and organic and inorganic fertilizers that contain nitrogen, potassium, and phosphorus [9]. Using biostimulants often shows that different microorganisms can provide different results on the same plant species [10], and the same microorganisms can show different effectiveness on the same plant species [11]. Using biostimulants requires much money, and food for biofortification is generally limited [12]. Using inorganic fertilizers can reduce the soil's functioning ability [13]. The use of organic fertilizer generally requires large quantities [14], while the availability of raw materials is limited. Therefore, environmentally friendly and low-cost agricultural management methods are needed. One environmentally friendly handling technique that continues to be developed is using MF exposure.
It has previously been reported that exposure of MFs to seeds affects the diffusion of biological particles by inducing Lorentz forces [15]. The Lorentz force will affect the diffusion of charged particles from various ions, including plasma proteins [15]. MF exposure increases plant seed vigor by influencing biochemical processes involving free radicals by stimulating protein and enzyme activity [16]. It has also been reported that an increase in germination, growth and protein content in canola seeds occurred as a result of exposure to MF 1.0 mT for 1 hour [17]. Shibghatallah et al. [18] showed that MF increased the activity of antioxidant enzymes in tobacco cell suspensions. In general, MF exposure is carried out using a stationary field, requiring a large MFD and a long time. Meanwhile, the MF gradient influences the magnitude of the interaction force between the MF and the internal electric field of the biological system [19]. Therefore, the research used a MF whose MFD changes with time. The research aimed to determine the MFD that makes the content of curcumin, iron, magnesium, and oxalic acid in red turmeric optimal.
2.1 Sample preparation
The research sample used red turmeric. The seeds are taken from fresh turmeric cobs and cut into cob twigs of almost the same size, weighing 7 grams each. Size and weight are homogeneous to obtain more precise fresh weight data. The sample consisted of 7 treatment groups and one control group. Each group consists of 10 samples. Before being exposed to MF, the seeds are first moistened and placed in kapok.
2.2 Magnetic field generation and exposure
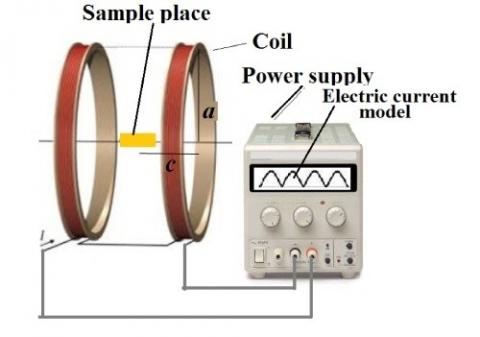
This research uses MF with an MFD that changes over time. MF generation is carried out by connecting the Helmholtz coil with a direct current power supply with a current strength that changes with time, as in Figure 1. The current flow in the Helmholtz coil generates MF around the coil. The amount of MF produced is directly proportional to the strength of the flowing electric current; that is, it fulfills the equation:
$B=\frac{\mu N I a^2}{\left(a^2+c^2\right)^{3 / 2}}$ (1)
where, B = magnetic field, µ = permittivity, N = number of turns, I = current strength, a = radius of the coil, and c = distance between the sample and the coil.
The Helmholtz coil used has 1000 turns with a coil radius of 200 mm. The coils are made of copper wire with a radius of 0.5 mm. The distance between one coil and another is 20 cm. The size of the resulting MFD was measured using a Kanetec Brand Fieldmeter type TM801. Red turmeric rhizome samples were exposed using an MFD of 0.1-0.7 mT, and one group was exposed without exposure. Each exposure was carried out for 20 minutes and repeated daily for up to 5 days.
Figure 1. Arrangement of MF generating equipment to provide exposure to turmeric rhizomes
2.3 Planting in polybags
Watering is carried out regularly to maintain the pH and humidity of the kapok where the rhizomes grow. When the seeds are 15 days old from the start of exposure, the seeds are transferred to polybags with a diameter of 30 cm and a height of 20 cm. Each polybag contains one red turmeric seed that has grown. The polybag is first filled with a mixture of pure soil and organic fertilizer in a ratio of 3:1 and moistened. Soil pH is maintained at around 7.0, while the environmental temperature of the planting area is 21-30℃ with air humidity of 70-85%. The plants are watered with 200 mL of water every day, which is done in the morning. When the plants were 15, 30, 45, and 60 days after being transferred to polybags, they were fertilized using NPK fertilizer at 3 grams, 5 grams, 6 grams, and 6 grams, respectively. At the age of 75 days, the plants were removed to measure the weight and content of curcumin, magnesium, iron, and oxalic acid.
2.4 Determination of curcumin content
The curcumin content was determined using a UV-VIS Spectrophotometer [20, 21]. Take 10 mg of curcumin and put it in a 100 mL volumetric flask to make a stock solution. The curcumin in the volumetric flask was treated with methanol up to the limit mark to obtain a stock with a concentration of 100 μg/mL. To prepare the standard solution, stock solutions were taken in amounts of 1 mL, 2 mL, 3 mL, 4 mL, 5 mL, 6 mL, and 7 mL, respectively. Each solution was then diluted with methanol until the total volume was 10 mL, thus obtaining a solution with a concentration of 1, 2, 3, 4, 5, 6, 7 μg/mL. Search for the maximum absorbance wavelength using a concentration of 5.0 μg/mL. Absorbance spectrum measurements were carried out with a wavelength of 200-800 nm. As a measurement blank, methanol is used. The results of spectrum measurements show that the maximum absorption is at a wavelength of 424 nm. Next, a standard curve was created using a curcumin solution with a concentration of 1–7 μg/mL, and the absorbance was measured using a wavelength of 424 nm. After plotting the measurement results, Eq. (2) is obtained.
y= 0.1691x - 0.0052 (2)
where, y is the absorption coefficient, while x is the concentration of curcumin, with a value of R² = 0.9974.
The curcumin content of the sample was measured from turmeric rhizomes, which had been extracted using the maceration method. 1.0 mg was taken and then put into a 100 mL measuring flask. Next, add methanol to the volumetric flask until the limit mark. The absorbance of the solution was determined using a UV-VIS spectrometer at a wavelength of 424 nm. The concentration in μg/mL units is calculated using Eq. (2). Concentration in percent is calculated using Eq. (3):
Curcumin $(\%)=\frac{\text { curcumin concentration }}{\text { solution concentration }} \times 100 \%$ (3)
2.5 Determination of magnesium content
Magnesium content was determined using Atomic Absorption Spectrophotometry (AAS) [22, 23]. The stock solution is made from 1000 mg/mL magnesium chloride, taken in 10 mL, and put into a 100 mL volumetric flask. The solution in the volumetric flask was diluted using distilled water to the limit mark. From the dilution, a stock solution with a concentration of 100 mg/mL was obtained. Standard solutions were prepared by taking 0.0, 0.2, 0.4, 0.6, 1.0 and 1.4 mL of each stock solution and diluting with distilled water in a volumetric flask to when the volume reached 100 mL. Therefore, standard solutions were obtained with concentrations of 0.0, 0.2, 0.4, 0.6, 1.0, and 1.4 mg/mL, respectively. The absorbance of each solution was measured using AAS at a wavelength of 285.2 nm. Using linear regression, plotting the measurement data obtained an equation:
y = 0.5774x + 0.0386 (4)
where, x is magnesium concentration, and y is absorption, while with a value of R² = 0.995.
Sample measurements used planted turmeric powder. Take 0.50 grams of turmeric in powder form, then dissolve it using HNO3 and HCl in a ratio of 1:3. Next, it was heated at 100℃ for 10 minutes using a hotplate. After cooling, the filtrate formed is separated and filtered using filter paper. The filtrate that has been filtered is diluted with distilled water with a volume of 50 mL. Magnesium content was determined using AAS at a wavelength of 285.2 nm. Magnesium concentration is determined using Eq. (4).
2.6 Determination of iron content
Determination of iron content was carried out using AAS [24, 25]. The stock solution contains iron at 1000 mg/mL of ammonium ferrous sulfate [26]. 10 mL of the stock solution was taken and put into a 100 mL measuring flask and diluted using distilled water to the mark so that the stock solution had a concentration of 100 mg/mL. Standard solutions were made by taking 0.0, 0.1, 0.2, 0.3, 0.4, and 0.5 mL of the stock solution, then diluting it with distilled water until the volume became 100 mL. By dilution, successive standard solutions were obtained with concentrations of 0.0, 0.1, 0.2, 0.3, 0.4 and 0.5 mg/100mL. The absorbance of each solution was measured using AAS at a wavelength of 248.3 nm [27]. The measurement results are plotted, and a regression equation is obtained.
y = 0.1044x + 0.0047 (5)
where, y is absorbance and x is iron concentration with R² = 0.9989.
Samples were taken from the turmeric powder produced in 0.50 grams, then dissolved in HNO3 and HCl in a ratio of 1:3 in an acid cupboard. It was then heated at 100℃ for 10 minutes using a hotplate. After cooling, the filtrate formed is separated and filtered using filter paper. The filtered filtrate was diluted with 50 mL distilled water. Solution absorbance measurements were carried out using AAS at a wavelength of 248.3 nm. Iron content was calculated using Eq. (5).
2.7 Determination of oxalic acid contens
The oxalic acid content of red turmeric was determined using UV-VIS Spectroscopy [28, 29]. The stock solution was made from an oxalate solution with a 100 mg/L concentration. A total of 10 mL of standard solution was put into the flask, then 1.0 mL of acetate buffer solution (pH 5), 1.0 mL of Ammonium iron (II) sulfate, 0.5 mL potassium iodide 0.12 mol/L, and 1.0 mL of potassium bromate was added. The mixed solution is put into a 100 mL measuring flask, and distilled water is added to the mark to be diluted until the solution becomes homogeneous. The resulting solution with a 100 mg/mL concentration was taken in 0, 2, 3, 4, 5, and 6 mL respectively. Each volume was diluted with 10 mL of distilled water to obtain standard solutions with concentrations of 0, 2, 3, 4, 5, and 6 mg/mL. Determination of the wavelength with maximum absorption was carried out using a concentration of 4 mg/mL. Measurements were carried out in the wavelength range of 280-375 nm. The measurement results show that the maximum absorption wavelength is 345 nm. Next, absorbance measurements were carried out at oxalic acid concentrations of 0, 2, 3, 4, 5, and 6 mg/mL. From the measurement results, a linear regression graph was created, and an equation was obtained.
y = 0.0364x + 0.0712 (6)
where, y is absorbance and x is oxalic acid concentration with R² = 0.9564.
The oxalic acid content in turmeric rhizomes was measured from the turmeric extract, obtained by placing 1.0 mg of the extract in a 100 mL graduated flask. In a volumetric flask, 1.0 mL of acetate buffer solution (pH 5), 1.0 mL of Ammonium iron (II) sulfate, 0.5 mL of 0.12 mol/L potassium iodide, and 1.0 mL of potassium bromate were added. The mixture formed is added with distilled water up to the mark and stirred until homogeneous. The solution absorption was measured with UV-VIS Spectrometers with wavelengths of 345 nm. The concentration in μg/100mL units is calculated using Eq. (6). Concentration in percent is calculated using Eq. (7):
Oxalic $(\%)=\frac{\text { oxalic concentration. }}{\text { solution concentration }} \times 100 \%$ (7)
2.8 Statistical analysis
The research data was tested for homogeneity, and if it was homogeneous, it was then tested using Analysis of Variance statistics. If significant differences are obtained, testing is then carried out using the Duncan Multiple Range Test (DMRT) to determine the significance of the differences between treatment groups.
3.1 Fresh weight
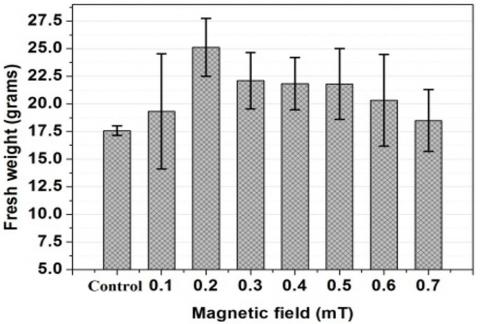
Figure 2. Fresh weight of red turmeric rhizomes produced by exposure using 0.1-0.7 mT MF
Measurement of the weight of turmeric production was carried out after 75 days. Measurements are carried out with fresh turmeric clean from other adhering materials. Measured weight is the total weight without deducting the weight of the seeds at the time of seeding, namely 7 grams. The results of measuring the weight of production results show that exposure to MFs affects production results. Figure 2 shows that the lightest weight was obtained from plants that were not exposed with a MF, namely 17.58 ± 0.438 grams, while the most optimum was obtained from plants exposed with a MFD of 0.2 mT, namely 25.13 ± 2.61 grams or an increase of 42.96%. In exposure with a MFD of 0.3-0.7 mT, the increase was smaller, and the lowest occurred in exposure to a MFD of 0.7 mT, namely 5.23% or 18.49 ± 2.79 gram. The statistics analysis showed that exposure to a MFD of 0.1-0.5 mT significantly affected $(\mathrm{p} \leq 0.05)$ the fresh weight of red turmeric.
3.2 Curcumin content
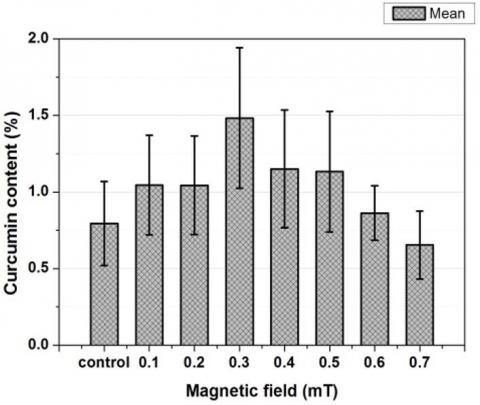
Curcumin is an antioxidant that has anti-inflammatory effects. Curcumin is a natural compound that gives turmeric its bright yellow color. Curcumin content was measured when the turmeric plants were 75 days old. The content of curcumin was affected by exposure to MF, as revealed by the measurement results. Without exposure to MF, the curcumin content was 0.79 ± 0.27% (Figure 3). When exposed to a MF with a MFD of 0.1-0.6 mT, the curcumin content increased. In comparison, when exposed to a MFD of 0.7 mT, the content decreased compared to without exposure. The optimum curcumin content was obtained from plants exposed to a MF with a MFD of 0.3 mT, namely 1.48±0.46% or an increase of 85.95% compared to those without a MF. The statistical analysis results of exposure with a MFD of 0.3-0.4 mT gave a significant effect $(p\leq0.05)$ on curcumin content. In contrast, exposure with a MFD of 0.1-0.2 mT and 0.5-0.7 mT gave unreal influence.
Figure 3. The amount of curcumin in red turmeric rhizomes that were exposed using MF 0.1-0.7 mT
3.3 Magnesium content
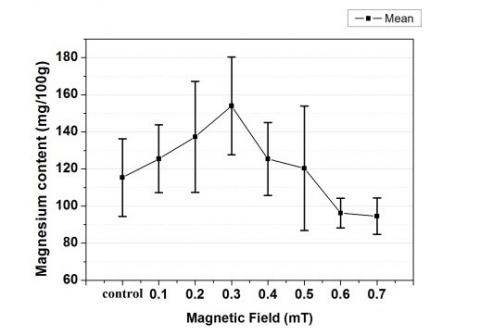
Magnesium is a vital nutrient that the body cannot produce naturally. Magnesium has been shown to be beneficial in maintaining the body's metabolism, producing enzymes, maintaining healthy bones, muscles, and hearts, and reducing the risk of diabetes and heart disease. Turmeric rhizome has a relatively high magnesium content. Increasing the magnesium content in red turmeric rhizomes can be exposed using a MF at the beginning of growth. Figure 4 shows the magnesium content of turmeric rhizomes exposed with a MF with a MFD of 0.1-7.0 mT. Magnesium content was higher when exposed with a MFD of 0.1-0.5 mT, while magnesium content was lower when exposed with a MFD of 0.6-0.7 mT. The optimum magnesium content was found in turmeric rhizomes exposed with a MFD of 0.3 mT, namely 153.93 ± 26.36 mg/100g, or an increase of 33.39% compared to without exposure, namely 115.40±20.90 mg/100g. The statistics analysis showed that treatment with a MFD of 0.3 mT significantly $(\mathrm{p} \leq 0.05)$ increased magnesium content, while other MFDs were insignificant.
Figure 4. Magnesium content of red turmeric rhizomes that have been exposed using MF 0.1-0.7 mT
3.4 Iron content
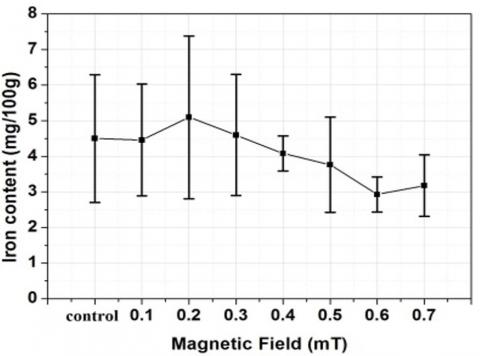
Iron is a mineral that plays a significant role in forming hemoglobin in red blood cells. Iron needs in humans depend on gender and body weight. Turmeric rhizomes contain iron, although in limited quantities. Exposure to a MF can increase or decrease the iron content in turmeric, as shown in Figure 5. Exposure with a MFD of 0.2 mT and 0.3 mT increased the iron content, while exposure with a MFD of 0.1, 0.4, 0.5, 0.6, and 0.7 mT decreased iron content. The highest iron content was obtained in plant exposure with a MFD of 0.3 mT, namely 5,10 ± 2.29 mg/100g, or an increase of 13.2% compared to those without exposure, namely 4.50 ± 1.79 mg/100g. Test results using statistics showed no significant effect of MF exposure on iron content.
Figure 5. Iron content of red turmeric rhizome after exposure using MF 0.1-0.7 mT
3.5 Oxalic acid content
Oxalic acid is a chemical compound with the formula H2C2O4 with the systematic name ethanedioic acid. Many metal ions form insoluble precipitates with oxalic acid, one of which is calcium oxalate. Excessive consumption of oxalic acid can cause stone formation in the urinary tract. Turmeric rhizome is a food ingredient that contains oxalic acid. Exposure using a MF when growing turmeric affects the oxalic acid content. Figure 6 shows the oxalic acid content in turmeric rhizomes exposed with a MFD of 0.1-0.7 mT. The lowest oxalic acid content was obtained from turmeric exposed with a MF of 0.4 mT, 0.33 ± 0.01%, or a decrease of 2.18% compared to without exposure, 0.34 ± 0.00%. Optimum oxalate levels were obtained from plants exposed with a MF of 0.7 mT, 0.36 ± 0.00%, or an increase of 4.04% compared to those without exposure. The test results using exposure statistics of 0.4-0.7 mT had a significant effect $(\mathrm{p} \leq 0.05)$ on the oxalate content in turmeric rhizomes.
Figure 6. Ovalic acid content of red turmeric rhizomes exposed using MF 0.1-0.7 mT
3.6 Discussion
The use of MF in the agricultural sector is worthy of development because it can have a positive influence. Exposure to MF during seeding affects agricultural product growth, productivity, and quality. The magnitude of the effect depends on the MFD, frequency, exposure time, and type of MF. Exposure using a MF with a MFD of 0.2 mT increased red turmeric's production yield and iron content. Exposure with a MFD of 0.3 mT increased the curcumin and magnesium content. Exposure with a MFD of 0.4 mT reduced the oxalic acid content, but it increased at a density of 0.7 mT. The percentage increase and decrease in production and content of red turmeric can be seen in Table 1. Similar conditions have been reported that exposure using a static MF of 4 mT for one hour increased the total phenolic content by 93.89%, flavonoids by 36.43%, and reduced the IC50 value amounting to 43.01% [30]. Another study reported that 50 mT MF exposure for 45 minutes had higher vitamin E concentrations than the control group [31]. Static MF exposure of 0.44 T, 0.77 T, and 1 T for 1-3 hours was proven to increase the bioactive content of lettuce [32]. The magnitude of changes in mineral content differs depending on the type of mineral and the magnetic field used. Using MF with a Time-changing MFD requires lower exposure times and MFD compared to static MF.
Turmeric seeds contain water and living cells. Water and living tissue are diamagnetic materials [33] and have a weak magnetic moment when subjected to an external magnetic field. Therefore, exposure to external MF does not make the electron spins of the material undergo rearrangement [34] but makes the water experience molecular polarization and its distribution changes. Therefore, exposure of MF to seeds containing water can reduce surface tension [35], the self-diffusion coefficient of water molecules, change viscosity [36], and result in increased hydrogen bonding [36] in water. A further consequence of MF exposure to seeds is influencing plant physiological processes, which can have additional effects on their growth and development. It has been reported that exposure to MF during seeding results in increased changes in water and mineral metabolism [37].
Table 1. Changes in fresh weight and curcumin, magnesium, iron, and oxalic acid content due to exposure to a MF of 0.1-0.7 mT
|
MF (mT) |
Increased (%) |
||||
|
Fresh Weight |
Curcumin |
Magnesium |
Iron |
Oxalic Acid |
|
|
0.1 |
10.01 |
31.64 |
8.75 |
-0.93 |
-0.65 |
|
0.2 |
42.96 |
31.41 |
18.99 |
13.20 |
-1.11 |
|
0.3 |
25.73 |
85.95 |
33.39 |
2.13 |
-1.11 |
|
0.4 |
24.24 |
44.89 |
8.69 |
-9.33 |
-2.18 |
|
0.5 |
24.04 |
41.77 |
4.35 |
-16.40 |
2.31 |
|
0.6 |
15.68 |
8.56 |
-16.61 |
-34.93 |
2.31 |
|
0.7 |
5.23 |
-17.62 |
-18.07 |
-29.42 |
4.04 |
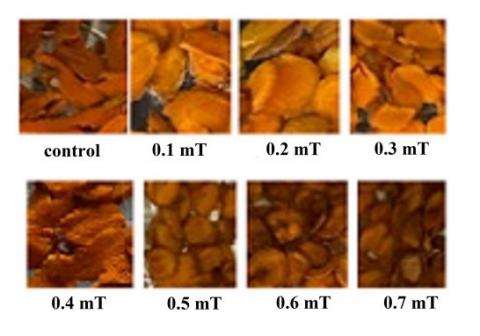
Figure 7. Physical form of turmeric rhizomes exposed to a magnetic field of 0.1-0.7 mT
Exposure to MF seeds also increases enzyme activity in embryos [38], thereby affecting plant growth and physiology and even the final stages of seed processing, such as harvesting mature plants [39]. Shine et al. [40] stated that the increase in germination of soybean seeds treated with MF was possible due to reactive oxygen species (ROS). The increase in ROS production in these seeds was facilitated by the oxidative peroxidase reaction [41], while the antioxidants promote the removal of excess free radicals [42]. The balance between ROS production and its scavenging has a better effect on the germination of seeds treated with a MF [43]. In addition, MF influences cell membrane structure by increasing permeability and ion transport through ion channels [44] and influencing several metabolic activities [45]. Vashisth and Nagarajan [46] reported that exposure to a static MF of 50 mT - 250 mT on sunflower seeds strengthened membrane integrity while reducing cell filtering and electrical conductivity. Therefore, exposure to an electric field with a MFD of 0.1-0.5 mT causes the production content of iron, curcumin, and magnesium to increase, while the iron content increases at a MFD of 0.2-0.3 mT and acid oxalate at 0.5-0.7 mT. The physical form of turmeric rhizomes due to exposure to magnetic fields can be seen in Figure 7. The color of the rhizomes appears yellower when exposed to 0.1-0.5 mT MF. The curcumin in turmeric rhizomes is a yellow pigment [47], which is also proven by the measurement results that the highest curcumin content was obtained with exposure to an MF of 0.3 mT.
MF with MFD changes over time to handle the seed growing process, requiring low electrical energy, cheap equipment manufacturing costs, and is easy to develop for a larger scale. Handling seeds using MF has very low side effects on the environment and users because MF is more concentrated in the area between the two coils. The low electrical energy required makes the seed-handling process cheaper. Meanwhile, exposure to turmeric seeds with an MFD of 0.2 mT increased production yields by up to 42.96%. Therefore, the application of MF in the agricultural sector is very possible. Exposure to MF was also proven to increase the curcumin content of red turmeric by up to 85.95% and the magnesium content by up to 33.39% at an MFD of 0.3 mT. In other cases, it has also been reported that exposure using alternating MF with an MFD of 0.4 mT for 15 minutes and a frequency of 100 Hz was able to increase the anthocyanin content by up to 22.5%, vitamin C up to 40.70%, and flavonoids up to 32.50% [48]. Therefore, the application of MF to handle seed growth has the potential to support the development of the pharmaceutical sector.
Increasing production content of curcumin, magnesium, iron, and oxalic acid can be done by treating it using a MF with the MFD changing with time. The magnitude of the MFD used plays a role in the magnitude of the increase. The required MFD is relatively low, so it is economically more economical. Exposure using a low MFD makes this method environmentally friendly.
Funding was obtained from the Maulana Malik Ibrahim State Islamic University of Malang with Chancellor's Decree No. 671 of 2023. Thank you to the Maulana Malik Ibrahim State Islamic University of Malang.
[1] Heffernan, C., Ukrainczyk, M., Gamidi, R.K., Hodnett, B.K., Rasmuson, Å.C. (2017). Extraction and purification of curcuminoids from crude curcumin by a combination of crystallization and chromatography. Organic Process Research & Development, 21(6): 821-826. https://doi.org/10.1021/acs.oprd.6b00347
[2] Gupta, S.C., Kismali, G., Aggarwal, B.B. (2013). Curcumin, a component of turmeric: From farm to pharmacy. International Union of Biochemistry and Molecular Biology, 39(1): 2-13. https://doi.org/10.1002/biof.1079
[3] Coello, I., Sanchis, P., Pieras, E.C., Grases, F. (2023). Diet in different calcium oxalate kidney stones. Nutrients, 15(11): 2607. https://doi.org/10.3390/nu15112607
[4] Magar, S.G., Chowdhury, V.K. (2021). Evaluation of curcumin content of turmeric accessions collected from north. Biological Forum – An International Journal, 13(4): 439-443.
[5] Tayyem, R.F., Heath, D.D., Al-delaimy, W.K., Rock, C.L. (2006). Curcumin content of turmeric and curry powders curcumin content of turmeric and curry powders. Nutrition and Cancer, 55(2): 126-131. https://doi.org/10.1207/s15327914nc5502_2
[6] Amel, B. (2019). Microscopic analysis of Curcuma longa L. using multivariate test. International Journal of Pharmacognosy, 2(4): 173-177. http://doi.org/10.13040/IJPSR.0975-8232.IJP.2(4).173-77
[7] Khan, S.R., Glenton, P.A., Byer, K.J. (2007). Dietary oxalate and calcium oxalate nephrolithiasis. The Journal of Urology, 178(5): 2191-2196. https://doi.org/10.1016/j.juro.2007.06.046
[8] Goicoechea, N., Antolin, M.C. (2017). Increased nutritional value in food crops. Microbial Biotechnology, 10(5): 1004-1007. https://doi.org/10.1111/1751-7915.12764
[9] Malika, M., Islam, M.R., Karimm, M.R., Huda, A., Jahiruddin, M. (2015). Organic and inorganic fertilizers influence the nutrient use efficiency and yield of a rice variety BINA dhan7. Academic Research Journal of Agricultural Science and Research, 3(7): 192-200. https://doi.org/10.14662/ARJASR2015.046
[10] Novello, G., Cesaro, P., Bona, E., Massa, N., Gosetti, F., Scarafoni, A., Todeschini, V., Berta, G., Lingua, G., Gamalero, E. (2021). The effects of plant growth-promoting bacteria with biostimulant features on the growth of a local onion cultivar and a commercial zucchini variety. Agronomy, 11(5): 888. https://doi.org/10.3390/agronomy11050888
[11] Baslam, M., Garmendia, I., Goicoechea, N. (2013). The arbuscular mycorrhizal symbiosis can overcome reductions in yield and nutritional quality in greenhouse-lettuces cultivated at inappropriate growing seasons. Scientia Horticulturae, 164: 145-154. http://doi.org/10.1016/j.scienta.2013.09.021
[12] Prisa, D., Spagnuolo, D. (2023). Plant production with microalgal biostimulants. Horticulturae, 9(7): 829. https://doi.org/10.3390/horticulturae9070829
[13] Krasilnikov, P., Taboada, M.A., Amanullah. (2022). Fertilizer use, soil health and agricultural sustainability. Agriculture, 12(4): 462. https://doi.org/10.3390/agriculture12040462
[14] Gao, F.C., Li, H.J., Mu, X.G., Gao, H., Zhang, Y., Li, R.M., Cao, K., Ye, L. (2023). Effects of organic fertilizer application on tomato yield and quality: A meta-analysis. Applied Sciences, 13(4): 2184. https://doi.org/10.3390/app13042184
[15] Zablotskii, V., Polyakova, T., Dejneka, A. (2022). Effects of high magnetic fields on the diffusion of biologically active molecules. Cells, 11(1): 81. https://doi.org/10.3390/cells11010081
[16] Saletnik, B., Zaguła, G., Saletnik, A., Bajcar, M., Słysz, E., Puchalski, C. (2022). Effect of magnetic and electrical fields on yield, shelf life and quality of fruits. Applied Sciences, 12(6): 3183. https://doi.org/10.3390/app12063183
[17] Shabrangi, A., Hassanpour, H., Majd, A., Sheida, M. (2015). Induction of genetic variation by electromagnetic fields in Zea mays L. and Brassica napus L. Caryologia: International Journal of Cytology, Cytosystematics and Cytogenetics, 68(4): 272-279. http://doi.org/10.1080/00087114.2015.1109920
[18] Shibghatallah, M.A.H., Khotimah, S.N., Suhandono, S., Viridi, S., Kesuma, T. (2013). Measuring leaf chlorophyll concentration from its color: A way in monitoring environment change to plantations. AIP Conference Proceedings, 1554: 210-213. http://doi.org/10.1063/1.4820322
[19] Tao, Q.P., Zhang, L., Han, X.Y., Chen, H.X., Ji, X.M., Zhang, X. (2020). Magnetic susceptibility difference-induced nucleus positioning in gradient ultrahigh magnetic field. Biophysical Journal, 118(3): 578-585. https://doi.org/10.1016/j.bpj.2019.12.020
[20] Singh, A., Avupati, V.R. (2017). Development and validation of uv-spectrophotometric method for the estimation of curcumin in standardised polyherbal formulations. Journal of Young Pharmacists, 9(4): 491-495. http://doi.org/10.5530/jyp.2017.9.96
[21] Hazra, K., Kumar, R., Sarkar, B.K., Chowdary, D.Y.A., Devgan, M., Ramaiah, M., Educational, I.R.P. (2015). Uv-visible spectrophotometric estimation of curcumin in nanoformulation. International Journal of Pharmacognosy, 2(3): 127-130. http://doi.org/10.13040/IJPSR.0975-8232.IJP.2(3).127-30
[22] Dewi, R., Stevani, H., Asyhari, N., Abdullah, T., Karim, D., Mulyadi, M. (2021). Comparison of iron (Fe), calcium (Ca) and magnesium (Mg) qualitative test on yellow and black raisins nutrition-rich snacks as alternative blood enhancement. International Conference on Urban Health, 3(1): 238-243. https://doi.org/10.32382/uh.v3i1.2500
[23] Sbahi, A., Abdelwahed, W., Sakur, A.A. (2020). A new flame AAS application for magnesium determination in solid pharmaceutical preparations as an active ingredient and an excipient. International Research Journal of Pure & Applied Chemistry, 21(23): 89-95. https://doi.org/10.9734/IRJPAC/2020/v21i2330305
[24] Nasution, M., Masfria, A., Putra, E.D.L. (2022), Determination of iron content, potassium, calcium, and sodium in Chinese date fruit (Ziziphus jujuba miller.) fresh and boiled in atomic adsorption spectrophotometry. Asian Journal of Pharmaceutical Research and Development, 10(2): 1-5. http://doi.org/10.22270/ajprd.v10i2.1110
[25] Dara, F., Ridwan, Y.S. (2011). Determination of Iron (Fe) and Calcium (Ca) in NIST SRM 1566b (Oyster tissue) using Flame Atomic Absorption Spectrometry (F-AAS) by Standard Addition Method. Valensi, 2(2): 405-408. https://doi.org/10.15408/jkv.v2i2.205
[26] Eldin, I.E.H., Ishak, C.Y. (2015). Determination of iron content of three common acacias of sudan. American Journal of Analytical Chemistry, 6(12): 933-938. https://doi.org/10.4236/ajac.2015.612089
[27] Haryanti, S.D., Dzawinnuha, H., Adika, V. (2017). Determination of iron (Fe) species in samples of canned packaging beef. Indonesian Journal of Chemistry and Environment, 1(1): 15-20. https://doi.org/10.21831/ijce.v1i1.20785
[28] Mohamad, A.A., Al-Zehouri, J. (2020). Development of a spectrophotometric method for the determination of oxalic acid. World Journal of Pharmaceutical Research, 9(15): 14-21. https://doi.org/10.20959/wjpr202015-19264
[29] Kassie, W., Washe, A.P., Etsay, H. (2019). Spectrophotometric determination of oxalic acid in dietary sources through catalytic titration with hexavalent chromium. Food Science and Quality Management, 83: 30-38. https://doi.org/10.7176/FSQM
[30] Mansourkhaki, M., Hassanpour, H., Hekmati, M. (2019). Effect of static magnetic field on growth factors, antioxidant activity and anatomical responses of Silybum marianum seedlings. Journal of Plant Process and Function, 7(28): 9-15.
[31] Bukhari, S.A., Tanveer, M., Mustafa, G., Zia-ud-den, N. (2021). Magnetic field stimulation effect on germination and antioxidant activities of presown hybrid seeds of sunflower and its seedlings. Journal of Food Quality, 2021: 5594183. https://doi.org/10.1155/2021/5594183
[32] Latef, A.A.H.A., Dawood, M.F.A., Hassanpour, H., Rezayian, M., Younes, N.A. (2020). Impact of the static magnetic field on growth, pigments, osmolytes, nitric oxide, hydrogen sulfide, phenylalanine ammonia-lyase activity, antioxidant defense system, and yield in lettuce. Biology, 9(7): 172. https://doi.org/10.3390/biology9070172
[33] Schenck, J.F. (2005). Physical interactions of static magnetic fields with living tissues. Progress in Biophysics and Molecular Biology, 87(2-3): 185-204. https://doi.org/10.1016/j.pbiomolbio.2004.08.009
[34] Fuseya, Y., Ogata, M., Fukuyama, H. (2012). Spin-hall effect and diamagnetism of dirac electrons. Journal of the Physical Society of Japan, 81(9): 093704. https://doi.org/10.1143/JPSJ.81.093704
[35] Al-Douri, Y., Hassan, S.M., Batoo, K.M., Raslan, E.H. (2021). Surface tension under magnetic field effect for nanoscaled water Surface tension under magnetic field effect for nanoscaled water. The European Physical Journal Plus, 136: 295. https://doi.org/10.1140/epjp/s13360-021-01287-1
[36] Chang, K.T., Weng, C.I. (2006). The effect of an external magnetic field on the structure of liquid water using molecular dynamics simulation. Journal of Applied Physics, 100(4): 043917. https://doi.org/100:1-7.10.1063/1.2335971
[37] Tirono, M. (2022). The use of a time-changing magnetic field to increase soybean (Glycine Max) growth and productivity. International Journal of Design & Nature and Ecodynamics, 17(5): 737-743. https://doi.org/10.18280/ijdne.170511
[38] Júnior, R.A.B., Azevedo, R.L.D., Guimarães, R.M., Reis, L.V. (2020). Magnetic field in coffee seed germination. Cience Agrotecnologia, 44(2): 1-10. https://doi.org/10.1590/1413-7054202044003920
[39] El-Gizawy, A.M., Ragab, M.E., Helal, N.A.S., El.-Satar, A., Osman, I.H. (2016). Effect of magnetic field treatments on germination of true potato seeds, seedlings growth and potato tubers characteristics. Middle East Journal of Agriculture Research, 5(1): 74-81.
[40] Shine, M.B., Guruprasad, K.N., Anand, A. (2011). Enhancement of germination, growth, and photosynthesis in soybean by pre-treatment of seeds with magnetic field. Bioelectromagnetics, 32(6): 474-484. http://doi.org/10.1002/bem.20656
[41] Sachdev, S., Ansarim S.A., Ansari, M.I., Fujita, M. (2021). Abiotic stress and reactive oxygen species: generation, signaling, and defense mechanisms. Antioxidants, 10(2): 277. https://doi.org/10.3390/antiox10020277
[42] Martemucci, G., Costagliola, C., Mariano, M., Luca, D., Napolitano, P., Alessandro, A.G.D. (2022). Free radical properties, source and targets, antioxidant consumption and health. Oxygen, 2(2): 48-78. https://doi.org/10.3390/oxygen2020006
[43] Synowiec-Wojtarowicz, A., Krawczyk, A., Kimsa-Dudek, M. (2023). The effect of resveratrol and static magnetic field interactions on the oxidation – reduction parameters of melanoma malignant cells. Applied Sciences, 13(14): 8042. https://doi.org/10.3390/app13148042
[44] Koch, C.L.M.B., Sommarin, M., Persson, B.R.R., Salford, L.G., Eberhardt, J.L. (2003). Interaction between weak low frequency magnetic fields and cell membranes. Bioelctromagnetics, 24(6): 395-402. https://doi.org/10.1002/bem.10136
[45] Zhang, X., Yarema, K., Xu, A. (2017). Biological effects of static magnetic fields. Springer Nature Singapore Pte Ltd. https://doi.org/10.1007/978-981-10-3579-1
[46] Vashisth, A., Nagarajan, S. (2010). Effect on germination and early growth characteristics in sunflower (Helianthus annuus) seeds exposed to static magnetic field. Journal of Plant Physiology, 167(2): 149-156. http://doi.org/10.1016/j.jplph.2009.08.011
[47] Abdeldaiem, M.H. (2013). Use of yellow pigment extracted from turmeric (Curcuma longa) rhizomes powder as natural food preservative and colorant. Food Science and Quality Management, 22: 56-69. https://www.iiste.org/Journals/index.php/FSQM/article/view/9594.
[48] Tirono, M., Mulyono, A. (2023). Increase of anthocyanin, vitamin c, and flavonoid content in red lettuce (lLctuca sativa L.) using alternating magnetic field exposure. Current Research in Nutrition and Food Science, 11(3): 1143-1152. http://doi.org/10.12944/CRNFSJ.11.3.19