I Ketut Suamba*![]() | I Wayan Tika
| I Wayan Tika![]() | Sumiyati
| Sumiyati![]() | Ni Nyoman Sulastri
| Ni Nyoman Sulastri![]() | Gede Mekse Korri Arisena
| Gede Mekse Korri Arisena![]() | Putu Perdana Kusuma Wiguna
| Putu Perdana Kusuma Wiguna![]() | Widhianthini
| Widhianthini![]()
© 2024 The authors. This article is published by IIETA and is licensed under the CC BY 4.0 license (http://creativecommons.org/licenses/by/4.0/).
OPEN ACCESS
Soil erosion causes an irreversible loss of soil fertility. The land use which is most affected by erosion is rice fields. This research aims to determine the rate of erosion in Subak in Tabanan Regency and analyse the environmental services provided by Subak. Environmental services are defined as services provided by ecosystem functions whose value and benefits are felt by humans. Subak is a traditional farming organization which is owned by the farming community in Bali Province, Indonesia, and specifically regulates the management and irrigation systems for every rice field in Bali. The research case studies were Subak Kedampal, Subak Sigaran and Subak Bongan. The method used in this research was to take soil samples from each Subak rice field, then calculate the erosion hazard using the Universal Soil Loss Equation (USLE). The Geographic Information System (GIS) was used to intersect the erosion parameters; namely, the rain erosivity factor, soil erodibility factor, slope factor, ground cover vegetation, plant management and conservation action factors, in order to create a soil erosion map. The results show that these three Subak rice fields had very low erosion rates. Subak Bongan has an erosion rate of 0.967 tonnes/ha/yr, Subak Sigaran one of 3,415 tonnes/ha/yr and Subak Kedampal one of 7,714 tonnes/ha/yr. These conditions were benefitted the Subak rice fields as a food supplier, a groundwater recharge area, a provider of environmental education, a recreation and agrotourism area, and as a way to control air pollution and preserve the ecosystem. Compared to rice fields outside Bali which are not managed by Subak, the erosion rate that occurs is higher because irrigation management and specific sloping land management carried out by Subak are able to reduce the level of erosion.
environmental service, Geographic Information System, Subak, sustainable agriculture, soil erosion
Soil is a natural resource that is very important for human life in terms of social, economic, political and cultural aspects. Soil is also the main resource needed for agriculture. Soil that is used for agriculture has the main function of providing nutrients for plants. Soil can undergo many changes, both naturally and as a result of human behavior [1, 2].
One of the problems related to soil is erosion. Erosion is the loss or transport of soil material or parts of soil from one place to another via natural media, such as water and wind [3, 4]. Naturally, the soil maintains equilibrium if the erosion speed is slower or the same speed as the soil formation. Soil conservation is needed to reduce the rate of erosion, so that it is comparable to the rate of soil formation and so maintain soil productivity. Soil management both upstream and downstream influences the erosion rate.
The movement of soil layers due to erosion can have various negative impacts, such as a loss of the nutrients needed by plants because most of these nutrients are in the top soil which has been eroded [5, 6]. The impact of erosion causes an irreversible loss of soil fertility. The land use which is most affected by erosion is rice fields. The loss of nutrients in Subak paddy fields due to erosion causes a decrease in the soil’s fertility, so the soil becomes unable to support plant growth, resulting in low soil productivity. Thus, there exists a direct relationship between soil loss, soil quality and plant productivity.
Rice fields in Bali have a unique traditional irrigation organization called Subak. Subak is a traditional organization owned by the farming community in Bali, which specifically regulates the management of or irrigation systems for rice fields [7-9]. The existence of Subak is further confirmed through Regional Regulation No. 02/PD/DPRD/1972 concerning the Regional Irrigation of Bali Province. At the national level, Law No. 11 of 1974 concerned Irrigation, Government Regulation No. 22 of 1982 concerned Water Regulations and Government Regulation No. 23 of 1982 concerned Irrigation [10, 11]. These regulations further clarify the management of water resources and farmer institutions, and recognize the existence of Subak institutions. In 2012, the United Nations Educational, Scientific and Cultural Organization (UNESCO) recognized Subak in Bali as a world cultural heritage [12].
Subak rice fields have the benefit of being a cultivation medium that produces the main food ingredient in Bali. Subak rice fields have economic and cultural importance within the field of agriculture. Socio-economically, fertile Subak rice fields provide opportunities to famers to sell their agricultural products as well as maintain their number, quality and sales value. Culturally, Subak ricefields are one of the manifestations of Tri Hita Karana, which is the Balinese Hindu philosophy of maintaining a balance between humans, humans and nature, and humans and God. Keeping Subak rife fields fertile without erosion is certainly proof of a good relationship between humans and nature. Moreover, Subak rice fields also protect the environment in a practical sense and bring benefits to the environment [13]. Environmental benefit means utilizing the potential of the environment without damaging it [6]. Environmental services protect the environment, for example, by promoting soil fertility through controlling erosion.
Tabanan Regency has a Subak rice field area of 20,197 ha, out of a total of 74,723 ha of rice fields in Bali Province, or 27% of the total rice field area [14]. Tabanan Regency is the main rice supplier in Bali Province. This study aims to determine the level of erosion in Subak in Tabanan Regency and assess the environmental services provided by Subak in protecting soil fertility from soil erosion. An analysis of the environmental services provided by the Subak rice fields to protect soil fertility from erosion has not been widely studied in Bali. The previous research placed more emphasis on studying soil fertility, mapping and the socio-demographics conditions of Subak [15-23].
2.1 Research area
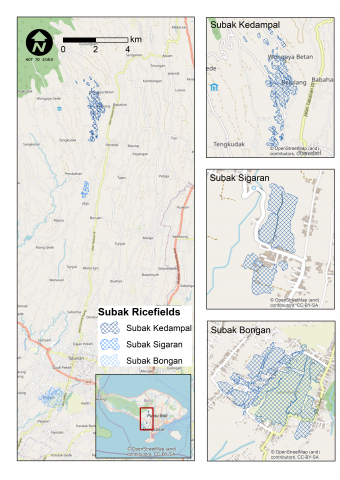
The research was carried out in three Subak rice fields in Tabanan Regency, Bali Province, Indonesia; namely, Subak Kedampal, Subak Sigaran and Subak Bongan. The research area was classified based on a consideration of the slope conditions. The research location was classified as an upstream area, whose land condition is hilly to mountainous (a more than 30% slope), a middle area with wavy to hilly conditions (a 15-30% slope), and a downstream area where the land conditions are flat to undulating (a less than 15% slope). Figure 1 shows the research location.
Subak Kedampal is a Subak located in Mangesta Village, Penebel District, Tabanan Regency. Subak Kedampal is located at coordinates 115.144° - 115.127° East Longitude and 8.382° - 8.418° South Latitude. Subak Kedampal is located in a hilly, mountainous area at the upper reaches of the Yeh Ho watershed. Subak Sigaran is a Subak located in Jegu Village, Penebel District, Tabanan Regency. Subak Sigaran is located at coordinates 115.134° - 115.131° East Longitude and 8.440° - 8.448° South Latitude. Subak Sigaran is located in a hilly area in the middle of the Yeh Ho watershed. Subak Bongan, meanwhile, is a Subak located in Bongan Village, Tabanan District, Tabanan Regency. Subak Bongan is located at coordinates 115.113° - 115.089° East Longitude and 8.563° - 8.579° South Latitude. Subak Bongan is located in the downstream area of the Yeh Empas watershed.
Figure 1. The research location
2.2 Data collection
This research uses two types of data; namely, primary data and secondary data. The primary data, which were obtained from soil samples, consisted of data on the soil’s physical and chemical properties. The secondary data, including instantional data, consist of land-use data from the Agriculture Agency of Tabanan Rgency, Google Satellite from the ArcGIS database, the Digital Elevation Model (DEMNAS) from the Geospasal Information Agency of Indonesia and rainfall data from the Meteorology, Climatology and Geophysics Agency. The soil’s physical properties, namely, the soil’s structure, were obtained from field observations. The soil’s texture was analyzed using the pipette method. The soil’s permeability was measured in the laboratory using De Booth's method based on Darcy's law, C-organic content using the Walkley and Black method. The secondary data are shown in Table 1.
Table 1. The secondary data
|
No. |
Data |
Data Type |
Usability |
|
1 |
Rainfall Data |
Tabular |
Rainfall erosivity factor |
|
2 |
Land-Use |
Vector - Polygon |
Extent of Subak ricefield |
|
3 |
High Resolution Google Satellite Image |
Raster |
Extent of Subak ricefield |
|
4 |
DEMNAS |
Raster |
Geospasial information agency |
2.3 Method
The method used in this research was the field observation method. Soil samples were taken from each Subak rice field and then analyzed at the Soil and Environmental Science Laboratory, Faculty of Agriculture, Udayana University. The erosion calculation method used was the Universal Soil Loss Equation (USLE) method. This research is divided into four stages, namely, (1) the initial stage; (2) the field survey and soil sampling; (3) the soil analysis; and (4) the analysis of soil erosion and environmental services.
2.3.1 Initial stage
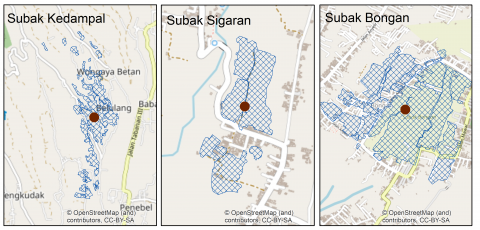
The initial stage began with the data collection, as shown in Table 1. Spatial data were used for the map layout process. High-resolution satellite imagery and land-use data were used to determine the current extent of the Subak rice fields. The Subak boundaries were mapped using a digitization process based on satellite imagery and land-use data. Then, a preliminary survey was carried out to determine the condition of the research location directly and the location for the soil sampling before the field survey was conducted. One sample was taken from the center of each Subak. Figure 2 shows the sample locations.
Figure 2. Sample locations
2.3.2 Field surveys and soil sampling
During this stage, the soil samples were taken at each sample point for laboratory observation, using a sample ring to obtain the primary data. A pipe was slowly pressed in to a depth of 50 cm, then lifted to the surface so that it was completely filled with soil, then wrapped in plastic to maintain the original water content. Apart from the sampling, observations were also taken of the parameters of the field, as shown in Table 2.
Table 2. Field observation parameters
|
No. |
Parameter |
Methodology |
|
1 |
Slope length (L) |
DEMNAS analysis |
|
2 |
Slope (S) |
DEMNAS analysis |
|
3 |
Soil structure |
Visually observed based on the shape and type of the soil structure |
|
4 |
Effective depth |
Measured using a Belgian Drill |
|
5 |
Vegetation type and density (C) |
Visually observed |
|
6 |
Land management (P) |
Visually observed |
2.3.3 Soil analysis
The soil samples that had been taken at the field survey stage were then analyzed in the Soil and Environmental Science Laboratory, Faculty of Agriculture, Udayana University, by observing several parameters to determine the soil erodibility value; namely, the soil’s texture, the soil’s organic matter, the soil’s permeability and the bulk density. Table 3 shows the laboratory test parameters for the soil erodibility analysis.
Table 3. Laboratory test parameters for soil erodibility
|
No. |
Parameter |
Methodology |
|
1 |
Soil texture |
Pipette method |
|
2 |
Soil structure |
Microscope and field mesasuement |
|
3 |
Organic matter |
The Walkey and Black method |
|
4 |
Permeability |
The De Booth's method based on Darcy's law |
2.3.4 Analysis of the soil erosion rates
The method for determining the amount of soil lost due to erosion was the Universal Soil Loss Equation (USLE) proposed by Smith and Wischmeier (1978) with Eq. (1) [24].
A = R × K × LS × C × P (1)
where,
A = Weight of soil lost (tons/ha/year).
R = Rain erosivity factor (kj/ha/cm).
K = Soil erodibility factor (ton/kj).
LS = Slope length and slope factor.
C = Ground cover vegetation and plant management factors.
P = Conservation Action Factor.
1. The Rain Erosivity Factor (R)
The rain erosivity factor, or R value, was analyzed using data on the monthly rainfall the monthly maximum rainfall, and rainy days. The observation period was the decade from 2013 to 2022. Rain erosivity is the ability of rain water to cause erosion. The erosivity value of rain can be calculated using the Bols equation (1978) with Eq. (2) [25, 26].
EI30 = 6,119(RAIN)1,21(DAYS)-0,47(MAXP)0,53 (2)
where,
EI30 = monthly rainfall erosivity factor (kj/ha/cm).
RAIN = average monthly rainfall (cm).
DAYS = average rainy days in a month.
MAXP = maximum number of rainy days in the relevant month (cm).
2. The Soil Erodibility Factor (K)
Soil erodibility demonstrates the resistance of soil particles to exfoliation and the transport of these soil particles via the kinetic energy of rainwater. The value of the erodibility factor, which is symbolized by "K", is a measure of the ability of the rain and surface flow to release and transport soil particles [27, 28].
Soil erodibility is determined by the interaction of four components; namely, soil texture, soil structure, organic matter and permeability [29]. Soil texture determines whether or not the soil is easily transported by surface flows. Soil structure is related to the binding force between soil particles which determines how easily soil particles can be carried by water.
The organic material content plays a role in strengthening the soil aggregates so that they cannot be easily eroded. Permeability is related to the soil's ability to transmit water, as more water entering the soil will reduce the degree of erosion. The K value can be calculated using the following Smith and Wischmeier (1978) equation, as shown in Eq. (3) [30].
100K=1,292[2.1 M1,14 (10-4)(12-a)+3,25(b-2)+2.5(c-3)] (3)
where,
K = soil erodibility factor (ton/kj).
M = (% Dust + % Very fine sand) × (100 - % Clay)
a = percentage of organic matter.
b = soil structure
c = soil permeability
Table 4. Soil structure class
|
No. |
Soil Structure (mm) |
Class |
|
1 |
Very fine granular (< 1 mm) |
1 |
|
2 |
Fine granular (1 to 2 mm) |
2 |
|
3 |
Medium to coarse granular (2-10 mm) |
3 |
|
4 |
Block-shaped, blocky, plate, massive |
4 |
Table 5. Soil permeability class
|
No. |
Permeability |
Rate (cm/hrs) |
Class |
|
1 |
Very slow |
< 0.5 sampai |
6 |
|
2 |
Slow |
0.5-2.0 sampai |
5 |
|
3 |
Slow to moderate |
2.0-6.3 sampai |
4 |
|
4 |
Moderate |
6.3-12.7 sampai |
3 |
|
5 |
Moderate to fast |
12.7-25.4 sampai |
2 |
|
6 |
Fast |
>25.4 sampai |
1 |
Table 6. Category of soil erodibility value
|
Class |
K Value |
Category |
|
1 |
0.00-0.10 |
Very Low |
|
2 |
0.11-0.21 |
Low |
|
3 |
0.22-0.32 |
Moderate |
|
4 |
0.33-0.44 |
Moderately High |
|
5 |
0.45-0.55 |
High |
|
6 |
0.56-0.64 |
Very High |
Tables 4 and 5 display the soil structure and soil permeability classes. Meanwhile, Table 6 shows the category of soil erodibility factor (K).
3. Slope Length and Slope Factors (LS)
LS is the ratio between the amount of erosion from a piece of land with a slope length and a certain steepness and the amount of erosion from an identical piece of land that is located on a slope with a length of 22 m and a steepness of 9%. The LS value can be calculated using Eq. (4) [31].
$\mathrm{LS}=\sqrt{\mathrm{x}\left(0,0138+0,00965 \mathrm{~s}+0,00138 \mathrm{~s}^2\right)}$ (4)
where,
x= Slope length (m);
s= Steepness (%).
4. Ground Cover Vegetation Factors and Plant Management (C)
The C factor value in USLE is the ratio between the amount of erosion from planted land with a certain level of management and the amount of erosion from land that is unplanted and not cultivated [32]. The value of factor C is largely influenced by changes which can be grouped into natural changes, such as the climate and plant growth stage, and changes that are influenced by the management system, such as the plant canopy, mulch from plant residues, plant residues embedded in the soil, soil processing, and the residual effects of soil management, as well as the interactions between these changes. The value of the C factor for various crops and crop management are presented in Table A1.
Soil management and the conservation factor (P) is the ratio between the average soil eroded from the land that received certain conservation treatment and the eroded soil without conservation treatment, assuming that the other factors causing the erosion remain constant. The P value is determined and adjusted to the slope and the conservation efforts applied in the field [33]. This includes conservation actions, namely planting in strips, and soil management according to the contours, mounds and terraces. The P factor values for various specific soil conservation measures are presented in Table A2.
2.3.5 Erosion mapping
Table 7. Erosion rate class
|
Kelas |
Erosion (ton/ha/yr) |
Erosion Class |
|
1 |
< 15 |
Very Low |
|
2 |
15 – 60 |
Low |
|
3 |
60 – 180 |
Moderate |
|
4 |
180 – 480 |
High |
|
5 |
> 480 |
Very High |
Erosion maps were created using ArGIS, based on the facility to map the driving factors of erosion, such as a rainfall erosivity map, soil erodibility map, slope map and land cover map. These factors are then calculated by multiplying the erosion factors using the overlay method. Overlay is a GIS analysis technique that involves combining several data layers, which produces a new layer with a new shape and new attribute data. The multiplication of these factors results in the erosion rate data (tons/ha/year). The erosion rate is then classified into five classes; namely, very light, light, medium, heavy and very heavy. After that, the area that experienced erosion was calculated. Table 7 shows the erosion rate class. The research diagram is presented in Figure 3 [34].
Figure 3. Research diagram
3.1 Erosion rate
The monthly rainfall erosivity value in January was the highest, with a value of 11,118.72 tons/ha/cm, followed by March, at 3,078.77 tons/ha/cm, then February, at 6,873.00 tons/ha/cm. The lowest monthly rain erosion occurred in August, with a value of 3.84 tonnes/ha/cm, followed by July, at 64.88 tonnes/ha/cm, then September-October, with a value of 95.94 tonnes/ha/cm. The temporal conditions for the monthly rainfall erosivity follow the parameters of the monthly rainfall data, monthly maximum rainfall, and rainy days. Table 8 presents the rainfall erosivity value at the research location.
Table 8. The rainfall erosivity value
|
Month |
Rainfall Erosivity (tons/ha/cm) |
|
January |
11,118.72 |
|
February |
3,078.77 |
|
March |
6,873.00 |
|
April |
4,098.61 |
|
May |
451.85 |
|
June |
246.26 |
|
July |
64.88 |
|
August |
3.84 |
|
September |
95.94 |
|
October |
95.94 |
|
November |
1,287.80 |
|
December |
1,545.47 |
|
Total |
28,961.08 |
The results show that the peak of the rainy season at the research location occurs in January-March, whereas the rainfall begins to increase in November and December. The sum of the monthly rainfall erosivity values shows that the annual rainfall erosivity in Tabanan Regency is 28,961.08 tons/ha/cm.
Rain that falls on land without ground cover vegetation will cause the soil to disperse, due to the kinetic energy of the rainwater. Dispersion results in the separation of the soil’s aggregates into smaller, finer particles. The resulting dispersion will be more easily transported by rainwater, which clogs the soil’s pores and so reduces soil infiltration and increases surface runoff. High rainfall intensity with long rain duration increases the potential for erosion.
Table 9. Soil erodibility values
|
Parameter |
Subak |
||
|
Bongan |
Sigaran |
Kedampal |
|
|
Sand (%) |
13.98 |
27.94 |
30.62 |
|
Dust (%) |
26.53 |
32.73 |
26.22 |
|
Clay (%) |
59.51 |
39.33 |
43.17 |
|
M |
1.640,25 |
3.680,97 |
3.230,03 |
|
Organic Matter (%) |
3.48 |
3.7 |
2.66 |
|
a |
3 |
3 |
2 |
|
Soil Structure |
lumpy soil |
lumpy soil |
lumpy soil |
|
b |
4 |
4 |
4 |
|
Permeability |
5.3 |
3.5 |
3.6 |
|
c |
4 |
4 |
4 |
|
K |
0.2 |
0.37 |
0.36 |
Note: M = (% Dust + % Very fine sand) × (100 - % Clay); a = percentage of organic matter; b = soil structure; c = soil permeability; K = soil erodibility factor (ton/kj).
The soil erodibility value at the research location is 0.2-0.37. Subak Bongan has an erodibility level of 0.2 which is relatively low; Subak Sigaran has an erodibility value of 0.37, which is moderately high; and Subak Kedampal has an erodibility value of 0.36, which is also moderately high. The soil erodibility values in the study area are presented in Table 9.
The differences in the erodibility levels at the research location are generally caused by differences in the clay percentage and soil permeability. A high clay percentage will make the soil stronger and therefore more capable of transmitting water. Thus, soil with a higher percentage of clay content is less sensitive to erosion than soil with a low percentage of clay content.
An increase in soil’s permeability values will be followed by a decrease in soil erodibility. This is because fast permeability will allow more water to pass into the soil, which may reduce the amount of surface runoff as a cause of erosion. Subak Bongan has a higher clay content and permeability, so its erodibility value is lower than that of the other Subaks.
The values for the slope length at the research location were between 6 m and 32 m. Meanwhile, the steepness ranged from 9-31%. These differences in the lengths and steepness of the slopes in the study area produced different LS values. Subak Kedampal, with its mountainous slope conditions, has the highest LS value, followed by Subak Sigaran and Subak Bongan. Table 10 shows the LS parameter values at the research location.
Table 10. The value of the LS parameter
|
Location (Subak) |
LS Index |
|
Bongan |
0.88 |
|
Sigaran |
1.68 |
|
Kedampal |
3.9 |
The length of the slope influences the occurrence of erosion since, the longer the slope, the greater the surface flow that occurs. This is because the flow of rainwater will wash away more soil particles. Meanwhile, the slope affects the speed of the surface runoff.
Table 11. The value of CP parameter
|
Subak |
Ground Cover |
Practice |
C Value |
P Value |
CP |
|
Bongan |
Ricefield |
Traditional Terrace |
0.01 |
0.4 |
0.004 |
|
Sigaran |
Ricefield |
Traditional Terrace |
0.01 |
0.4 |
0.004 |
|
Kedampal |
Ricefield |
Traditional Terrace |
0.01 |
0.4 |
0.004 |
Land management and soil conservation, as well as plant management factors, are interrelated in determining the erosion values. The CP value at the research location is 0.004, with land-use in the form of Subak rice fields and traditional terrace land management. The use of land in the form of Subak rice fields offers good land cover, supported by conservation measures in the form of traditional terraces. This low CP value causes a low level of erosion in the area. If the amount of erosion that occurs is defined based on the land management and vegetation, it can be concluded that, the smaller the CP value, the lower the possibility of erosion occurring. Table 11 shows the CP value of the research area.
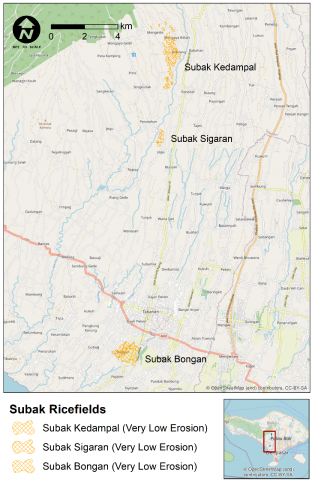
The erosion rate obtained from the Universal Soil Loss Equation (USLE) method shows that these three Subaks have very low erosion rates. Subak Bongan has an erosion rate of 0.967 tonnes/ha/yr, Subak Sigaran one of 3,415 tonnes/ha/yr and Subak Kedampal one of 7,714 tonnes/ha/yr. Table 12 shows the erosion rate at the research location based on the parameters of the USLE method. Figure 4 shows the erosion rate map of the research location.
Table 12. The erosion rate
|
Parameter |
Subak |
||
|
Bongan |
Sigaran |
Kedampal |
|
|
R |
1,373.59 |
1,373.59 |
1,373.59 |
|
K |
0.2 |
0.37 |
0.36 |
|
LS |
0.88 |
1.68 |
3.9 |
|
C |
0.01 |
0.01 |
0.01 |
|
P |
0.4 |
0.4 |
0.4 |
|
A (ton/ha/yr) |
0.967 |
3.415 |
7.714 |
|
Class |
Very Low |
Very Low |
Very Low |
The values that influence the differences in the erosion rates at the research location the most are soil erodibility (K) and the slope factor (LS). The clay content and high level of permeability and relatively flat slopes mean that Subak Bongan has the lowest erosion rate. Meanwhile, Subak Sigaran and Subak Kedampal, which are situated on steep slopes with a hilly and mountainous topography, have higher erosion rates due to their topographic conditions. The level of erosion that occurs in Subak Sigaran and Subak Kedampal is still considered very low, due the land conservation action and plant management.
The previous research on the soil erosion rate in the agro-tourism area of Bali [31] shows that this ranges from 0.32 tonnes/ha/yr (very low) to 1,535.34 tonnes/ha/yr (very heavy). Agro-tourism has a higher erosion rate because neither land conservation nor land management measures are not carried out in areas with steep slopes. This is because tourists want to enjoy the natural beauty without seeing any engineering work, so the steeply-sloping areas, that are prone to erosion, are left as they are, without any conservation measures being undertaken.
The erosion rates in the Gunggung Bali watershed, which is located in a hilly area with steep slopes, are high, due to the steep slope factor, which causes the land flow to be faster so that soil aggregates are quickly carried away by this land flow. The very high erosion rate is caused by the condition of the vegetation, which is mainly moorland, and very low density mixed vegetation and scrub. Less dense vegetation can cause the soil to be exposed directly to rainwater [35].
Figure 4. The erosion rate map of the research location
3.2 Environmental services
The Subak rice fields in the research location have very low erosion rates, due to the environmental services provided by the Subak organization, as they continuously control the erosion rate through their conservation-related activities. These activities make it possible to control erosion because of the ability of Subak rice fields to retain rainwater during and immediately after rainfall occurs, due to infiltration and percolation processes. Subak rice fields are able to hold back surface water, thereby reducing the rate of erosion. Subak rice fields’ conservation will increasingly bring environmental benefits to the areas that have steep slopes. The use of terraces at the research location has been proven to keep the erosion rate to a very low level. The very low rate of erosion naturally provides benefits to farmers and the community.
The benefits provided by Subak rice fields with regard to preventing erosion can be divided into two categories, namely, direct benefits and indirect benefits. Direct benefits can be marketable benefits; namely, various types of products whose value can be measured by their price, such as rice, secondary crops, vegetables and fruit. There are other benefits whose value cannot be measured but that can be enjoyed by land owners and the community, including the availability of food, agrotourism, and the local agricultural culture, including job opportunities. Meanwhile, indirect benefits that arise from the existence of agricultural land are related to environmental aspects, and can prove beneficial in terms of controlling erosion.
The benefits obtained from controlling erosion can maximize the function of the Subak rice fields, in terms of supplying food, offering a groundwater recharge area, providing environmental education, controling air pollution and preserving the ecosystem. The very low erosion rate, as a result of environmental services, also benefits the Subak rice fields, that can be used for agrotourism and as a tourist attraction for recreation and relaxation, because of the aesthetic views over the vast expanses of Subak rice fields.
The research results show that, in general, the research location has a very low level of erosion hazard so, in order to maintain the environmental services provided by the Subak rice fields, conservation measures must be taken. The very low erosion risk to the Subak rice fields in the research location is also due to the land cultivation practice of using terraces. Terraces can limit erosion by preventing water and soil from being carried away. In addition, the irrigation network in the Subak is poorly-preserved so that the supply and condition of the water is maintained. The terraces and irrigation networks are maintained by the Subak members independently. The land at the study site is also suitable for rice and paddy fields.
The very low level of erosion risk requires ground cover vegetation and mulch. In Subak Kedampal and Subak Sigaran, which have steep slopes, it is necessary to select and arrange the planting pattern, contour strip vegetation, and use bench terraces and bund terraces. The traditional terraces, as found in Subak Sigaran and Subak Kedampal, cannot be used to reduce the rate of erosion. Moreover, in Subaks with steep slopes, annual vegetation can be planted to prevent erosion, as these plants have a long lifespan. Perennial plants should be prioritized, that have an economic value arising from either the wood or by-products, such as fruit, sap, roots and oil; for example, candlenut trees and sandalwood trees.
The three Subak rice fields have very low erosion rates. Subak Bongan has an erosion rate of 0.967 tonnes/ha/yr, Subak Sigaran one of 3,415 tonnes/ha/yr and Subak Kedampal one of 7,714 tonnes/ha/yr. This very low erosion rate is a result of the environmental services of Subak. Subak practices land management to reduce erosion. The selection and arrangement of the planting patterns, contour strip vegetation, and the use of bench terraces and bund terraces are applied to the steep slopes.
The very low erosion rate was beneficial for the Subak rice fields, namely, by enabling them to supply food, serve as a groundwater recharge, provide environmental education, represent a recreation and agrotourism area, control air pollution and preserve the ecosystem. The research on other agroecosystems must pay attention to how environmental services are carried out in this region, through land management, technical engineering or agricultural technology, while still paying attention to the socio-economic conditions of the community and local wisdom. Future research on the management and conservation of the Subak rice fields might focus on policy-making and offering specific recommendations to promote the sustainable development of the traditional agricultural heritage.
This research was funded by Udayana University PNBP Fund No. B/96-272/UN.14.4.A/PT.01.05/2021.
Table A1. The value of the C factor for various crops and crop management
|
Landuse Type |
C Factor Value |
|
Open land/no plants |
1 |
|
Ricefield |
0.01 |
|
The moor is not specified |
0.7 |
|
Cassava |
0.8 |
|
Corn |
0.7 |
|
Soya bean |
0.399 |
|
Potato |
0.4 |
|
Peanuts |
0.2 |
|
Paddy |
0.561 |
|
Sugarcane |
0.2 |
|
Banana |
0.6 |
|
Fragrant root (lemongrass) |
0.4 |
|
Bede grass (first year) |
0.287 |
|
Bede grass (second year) |
0.001 |
|
Coffee with poor ground cover |
0.2 |
|
Taro |
0.85 |
|
Mixed gardens: |
|
|
• High density |
0.1 |
|
• Medium density |
0.2 |
|
• Low density |
0.5 |
|
Farming |
0.4 |
|
Natural forest: |
|
|
• - Lots of litter |
0.001 |
|
• - Less litter |
0.005 |
|
Production forest: |
|
|
• - Clear cutting |
0.5 |
|
• - Selective logging |
0.2 |
|
Shrub/grassland |
0.3 |
|
Cassava + soybeans |
0.181 |
|
Cassava + peanuts |
0.195 |
|
Rice – sorghum |
0.345 |
|
Rice – soybeans |
0.417 |
|
Peanuts + pigeon pea |
0.495 |
|
Peanuts + cowpeas |
0.571 |
|
Peanuts + straw mulch 4 tons/ha |
0.049 |
|
Rice + straw mulch 4 tons/ha |
0.096 |
|
Peanuts + corn mulch 4 tonnes/ha |
0.128 |
|
Peanuts + crotalaria mulch 3 tons/ha |
0.136 |
|
Peanuts + cowpea mulch |
0.259 |
|
Peanuts + straw mulch 2 tons/ha |
0.377 |
|
Rice + mula crotalaria 3 tons/ha |
0.387 |
|
Rotary tumpeng planting pattern**) + straw mulch |
0.079 |
|
Sequential planting pattern***) + start of plant residues |
0.357 |
|
Pure fertile reeds |
0.001 |
Table A2. The P factor values for various specific soil conservation measures
|
Soil Conservation Measures |
P Value |
|
Terrace Bench: |
|
|
• Good construction |
0.04 |
|
• Medium construction |
0.15 |
|
• Poor construction |
0.35 |
|
• Traditional terrace |
0.4 |
|
Bahia grass plant strip |
0.4 |
|
Soil management and planting according to contour lines: |
|
|
• Slope 0-8% |
0.5 |
|
• Slope 9-20% |
0.75 |
|
• Slope more than 20% |
0.9 |
|
No conservation measures |
1 |
[1] Dazzi, C., Lo Papa, G. (2022). A new definition of soil to promote soil awareness, sustainability, security and governance. International Soil and Water Conservation Research, 10(1): 99-108. https://doi.org/10.1016/j.iswcr.2021.07.001
[2] El-Ramady, H.R., Brevik, E.C., Elsakhawy, T., Omara, A.E., Amer, M.M., Abowaly, M.E., El-Henawy, A.H. Prokisch, J. (2022). Soil and humans: A comparative and a pictorial mini-review. Egyptian Journal of Soil Science, 62(2). https://doi.org/10.21608/EJSS.2022.144794.1508
[3] Septianugraha, R., Harryanto, R., Sara, D.S. (2019). Remote sensing and GIS methode for assess erosion with satellite imagery at Citarik SubWatershed. IOP Conference Series: Earth and Environmental Science, 393: 012064. https://doi.org/10.1088/1755-1315/393/1/012064
[4] Ruksajai, N., Konyai, S., Sriboonlue, V. (2023). Forecasting soil erosion risk using GIS and remote sensing for the Nam Un Basin, Sakon Nakhon Province, Thailand. Polish Journal of Environmental Studies, 32(2): 1767-1780. https://doi.org/10.15244/pjoes/156791
[5] Ivica, K., Bogunovic, I., Zgorelec, Z., Bilandzija, D. (2018). Effects of soil erosion by water under different tillage treatments on distribution of soil chemical parameters. Soil and Water Research, 13(1): 1-8. https://doi.org/10.17221/25/2017-SWR
[6] Sunaedi, N., Hadi, S.P., Bambang A.N (2019). Community-based environmental management through the payments for environmental services program in Cidanau Watershed, Banten Province, Indonesia. IOP Conference Series: Earth and Environmental Science, 338. https://doi.org/10.1088/1755-1315/338/1/012002
[7] Candiasa, I.M., Santiyadnya, N., Sukajaya, N., Sunu, G.K.A. (2019). Contextualization of learning models in Subak system for vocational education. Journal of Physics: Conference Series, 1165. 012023. https://doi.org/10.1088/1742-6596/1165/1/012023
[8] Sedana, G., Yastini, N.N., Maulina, N.M.I. (2021). Roles of local farmers’ organization in supporting food security: Case of Subak in Bali, Indonesia. IOP Conference Series: Earth and Environmental Science, 911: 012083. https://doi.org/10.1088/1755-1315/911/1/012083
[9] Darmawan, D.P., Arisena, G.M.K., Djelantik, A.A.W.S., Krisnandika, A.A.K., Utari, N.K.S., Korri, N.T.L. (2023). Farmers’ independence level in the urban area of Subak Sembung Denpasar City, Bali Province, Indonesia. Journal of Agricultural Sciences – Sri Lanka, 18(1): 40-54. https://doi.org/10.4038/jas.v18i1.10097
[10] Norken, I.N. (2019). Efforts to preserve the sustainability of Subak irrigation system in Denpasar City, Bali Province, Indonesia. MATEC Web of Conferences, 276: 04002. https://doi.org/10.1051/matecconf/201927604002
[11] Sarna, K. (2021). The existence of subak in the legal politics of development program in Bali. Kertha Patrika, 43(3): 241-261. https://doi.org/10.24843/KP.2021.v43.i03.p02
[12] Yamashita, S. (2013). The Balinese Subak as world cultural heritage. Jurnal Kajian Bali, 3(2): 39-68.
[13] Sarjana, I.M. (2016). Market and stakeholders analyses on ecotourism in Subak Sembung, Peguyangan Village, Denpasar City. E-Journal of Tourism, 3(1): 45-57.
[14] Central Bureau of Statistics of Tabanan Regency. (2022). Tabanan Regency in Figures. Tabanan: Tabanan Regency Central Bureau of Statistics. https://tabanankab.bps.go.id/publication/2022/02/25/b37ba10a0e181b3eacd26497/kabupaten-tabanan-dalam-angka-2022.html, accessed on May 23, 2024.
[15] Sardiana, I.K., Wiguna, P.P.K. (2023.) Evaluating spatial data infrastructure for Subak management in Tabanan Regency, Bali, Indonesia. International Journal of Design & Nature and Ecodynamics, 18(5): 1033-1043. https://doi.org/10.18280/ijdne.180503
[16] Kartini, N.L., Wiguna, P.P.K., Fudholi, A. (2023). Analysis of organic waste decomposition and quality of organic fertilizer using earth worms and black soldier fly (BSF). International Journal of Design & Nature and Ecodynamics, 18(2): 465-471. https://doi.org/10.18280/ijdne.180226
[17] Trigunasih, N.M., Wiguna, P.P.K. (2022). Identification of soil fertility status of Subak rice fields based on soil chemical properties in Denpasar city, Bali, Indonesia. African Journal of Food, Agriculture, Nutrition and Development, 22(115): 21807-21824. https://doi.org/10.18697/ajfand.115.20880
[18] Suardi, I.D.P.O., Widhianthini, Arisena, G.M.K., Suyarto, R., Krisnandika, A.A.K. (2022). Management policies implication for the agricultural land conversion sustainable control strategy in Bali Province. Journal of Environmental Management and Tourism, 3(19): 721-731. https://doi.org/10.14505/jemt.v13.3(59).12
[19] Pudjiastuti, A.Q., Arisena, G.M.K., Krisnandika, A.A.K. (2021). Rice import development in Indonesia. SOCA: Jurnal Sosial Ekonomi Pertanian, 15(2): 387-402. https://doi.org/10.24843/SOCA.2021.v15.i02.p14
[20] Darmawan, D.P., Arisena, G.M.K., Utami, N.W.F., Faculty, A.A.K.K. (2021). The dynamics of the social network of urban farmers in Subak Sembung Denpasar. Agris On-Line Papers in Economics and Informatics, 13(2): 51-58. https://doi.org/10.22004/ag.econ.320257
[21] Trigunasih, N.M., Wiguna, P.P.K. (2020). Land suitability for rice field and conservation planning in Ho Watershed, Tabanan Regency, Bali Province, Indonesia. Georaphia Technica, 15(1): 124-131. https://doi.org/10.21163/GT_2020.151.11
[22] Arisena, G.M.K., Krisnandika, A.A.K., Darmawan, D.P. (2020). Social economy and digital mapping of Subak Sembung Ecotourism. Agriekonomika, 9(2): 231-240. https://doi.org/10.21107/agriekonomika.v9i2.8754
[23] Suamba, I.K., Sumiyati, Krisnandika, A.A.K., Tika, I.W., Sulastri, N.N., Arisena, G.M.K. (2023). The Subak-based agro-tourism management model in the world cultural heritage area of Catur Angga Batukaru Tabanan Regency, Bali Province, Indonesia. African Journal of Food, Agriculture, Nutrition and Development, 23(2): 22534-22547. https://doi.org/10.18697/ajfand.117.21970
[24] Khairunnisa, F., Tambunan, M.P., Marko, K. (2020). Estimation of soil erosion by USLE model using GIS technique (A case study of upper Citarum Watershed). IOP Conference Series: Earth and Environmental Science, 561: 012038. https://doi.org/10.1088/1755-1315/561/1/012038
[25] Mahendra Harjianto, M., Sinukaban, N., Tariga, S.D., Haridjaja, O. (2015). Erosion prediction and soil conservation planning in Lawo watershed Indonesia. Journal of Environment and Earth Science, 5(6): 40-50.
[26] Fadila, R., Aprisal. (2023). Characteristics and tendencies of the Gumanti Valley rainfall pattern towards erosivity as a mitigation effort in facing the threat of climate hazards. E3S Web of Conferences, 464: 11007. https://doi.org/10.1051/e3sconf/202346411007
[27] Aprisal, A., Bambang, I., Irwan, D., Mimin, H., Teguh, H.A.P. (2022). Study of soil erodibility under the potato farming system in the upstream lembang watershed. Teguh, 11(6): 209-213. https://doi.org/10.11648/j.aff.20221106.12
[28] Lestari, A., Simanjuntak, B.H. (2022). Evaluation of erosion potential and determination of the causes of erosion using a geographic information system. Jurnal Teknik Pertanian Lampung, 11(3): 466-482. https://doi.org/10.23960/jtep-l.v11i3.466-482
[29] Madubuike, C.N., Nwachukwu, P.I., Emerson, K.U., Asuzu, C.C. (2020). Comparative assessment of selected erodibility indices for erosion prediction of soils of Imo State, Southeast, Nigeria. International Journal of Agriculture, Environment and Bioresearch, 5(5): 198-209.
[30] Cassol, E., Silva, T., Eltz, F., Levien, R. (2018). Soil erodibility under natural rainfall conditions as the K factor of the universal soil loss equation and application of the nomograph for a subtropical ultisol. Revista Brasileira de Ciência do Solo, 42: 1-12. https://doi.org/10.1590/18069657rbcs20170262
[31] Trigunasih, N.M., Saifulloh, M. (2023). investigation of soil erosion in agro-tourism area: Guideline forenvironmental conservation planning. Geographia Technica, 18(1): 19-28. http://dx.doi.org/10.21163/GT_2023.181.02
[32] Muliastuty, W.O., Sitorus, S.R.P., Poerwanto, R., Hardjomidjojo, H. (2015). Conservation practice factor of red pepper crop under different ridge types. Journal of Environment and Earth Science, 5(20): 130-137.
[33] Fadhilla, S., Kusumandari, A., Senawi. (2021). Soil erosion prediction using USLE model in Cangkringan micro watershed model, Yogyakarta. IOP Conference Series: Earth and Environmental Science, 912: 012092. https://doi.org/10.1088/1755-1315/912/1/012092
[34] Belo, D.X.A., Ernawati, R., Cahyadi, T.A., Nurkhamim, AMRI, N.A. (2020). Analysis of land erosion due to mining of clay material in Sidorejo Village, Sleman District, Yogyakarta. Geographia Technica, 15: 33-41. https://doi.org/10.21163/GT_2020.151.20
[35] Trigunasih, N.M., Kusmawati, T., Lestari, N. (2018). Erosion prediction analysis and landuse planning in gunggung watershed, Bali, Indonesia. IOP Conference Series: Earth and Environmental Science, 123: 012025. https://doi.org/10.1088/1755-1315/123/1/012025