Paúl Carrión-Mero![]() | Joselyne Solórzano*
| Joselyne Solórzano*![]() | Jenifer Malavé-Hernández
| Jenifer Malavé-Hernández![]() | Jorge Martínez-Angulo
| Jorge Martínez-Angulo![]() | Montalván F. Javier
| Montalván F. Javier![]() | Fernando Morante-Carballo
| Fernando Morante-Carballo![]()
© 2024 The authors. This article is published by IIETA and is licensed under the CC BY 4.0 license (http://creativecommons.org/licenses/by/4.0/).
OPEN ACCESS
In semi-arid areas, groundwater plays a fundamental role in the agricultural development of rural communities. The Entre Ríos commune, southwest of Santa Elena, lacks surface water resources for the development of local agriculture, which is why the population seeks to delineate Groundwater Potential Zones (GWPZ) that allow agricultural reactivation. The focus of this study is to generate a map of the potential of the local hydrogeological resource through geological and geoelectrical campaigns (Transient Electromagnetic Sounding and Vertical Electrical Sounding), in addition to the multi-criteria decision method based on the Analytical Hierarchy Process (AHP) and its integration using Geographic Information Systems (GIS), for the establishment of rural sustainability strategies. The GWPZ demarcation used six thematic layers: lithology, resistivity, texture, slope, drainage density and precipitation. The study identified "very high" GWPZ in the area's northeastern (La Seca) and central-south (Santo Tomás) sectors. These areas have coastal aquifer thicknesses of 10 and 5 meters, respectively, and are mainly related to medium to coarse sand lithologies, with 20 to 80 Ωm resistivities. The strategic proposal aligns with SDGs 2, 6, 8, and 12. It includes water sowing and harvesting techniques, water monitoring, and wastewater management with green filters to benefit the agricultural sector.
coastal aquifer, geoelectrical campaigns, groundwater, groundwater potential zones, hydrogeology, transient electromagnetic sounding, vertical electrical sounding, water sowing and harvesting
Groundwater constitutes approximately 98% of the planet's total liquid freshwater [1, 2]. Its global management requires a monitoring system, which includes a sizeable hydrogeological database [3]. This situation is difficult due to many nations' lack of knowledge about their underground water resources, where the contribution of private companies in geophysical data and drilling is considered very useful [4, 5].
Globally, these underground resources represent 49% of domestic supply, and people use the 25% to 43% extracted for agricultural irrigation [5, 6]. Agriculture has increased its dependence on groundwater, especially in arid and semi-arid regions, where the constant presence of this resource at shallow depths has been essential for small farmers, and management plays a fundamental role in sustainability [5, 7-10]. The principal countries contributing to the study of water scarcity in semi-arid areas are the United States and China [11].
Groundwater management in the agricultural sector has as its primary focus improvements in efficiency and performance that guarantee sustainability by minimizing environmental impacts, using strategies such as agroecology and Water Sowing and Harvesting (WS&H) systems to address freshwater scarcity in arid and semi-arid areas [12, 13]. For example, one of the WS&H systems involves the construction of dams or tapes in strategic locations for the artificial recharge of aquifers (sowing) and their subsequent recovery through wells (harvesting), mitigating problems of water scarcity in agricultural use, maintaining the biodiversity and promoting the creation of a nature-based attraction [14].
Multi-criteria analysis that includes the analytical hierarchical process (AHP) allows the preparation of maps with Groundwater Potential Zones (GWPZ) from data collected or estimated as geological and geophysical information [15-19].
Vertical Electrical Soundings (VES) and Transient Electromagnetic Soundings (TEM or TDEM) are geophysical methods widely used in groundwater prospecting due to their effectiveness and profitability. These tests allow measuring the electrical resistivity of the subsoil as a function of depth, estimating lithology and water saturation zones [20]. Meanwhile, VES are used more on irregular surfaces or with abundant vegetation. TEMs are better on relatively flat surfaces with little or scarce vegetation and no electromagnetic interference. Both methods need subsequent validation with local geology [21, 22].
Semi-arid areas are supplied mainly with water from aquifers. In these zones, hydrogeological characterizations are vital because they help identify potential groundwater zones, locate optimal sites for constructing exploratory wells, know the water resource availability, and plan sustainable exploitation strategies [16]. On the coast of Ecuador, specifically, the communes of Manglaralto and Olón (province of Santa Elena) are supplied exclusively by coastal aquifers. In these places, academic-community research has been vital to understanding the aquifers' state and improving water resources management at the community level through geological-geophysical campaigns and wells monitoring [23]. Additionally, WS&H techniques have been applied through the design of dams or tapes, as documented by several studies [14, 24].
To the southwest of the province of Santa Elena is the Atahualpa parish, locally recognized as the capital of furniture due to its outstanding cabinetmaking work [25]. The Entre Ríos commune, belonging to this parish, seeks to boost its economy and improve its food security through agriculture because it has fertile lands. However, agricultural development faces limitations due to seasonal rivers, brackish water [25] and precipitation levels of less than 300mm/year [26].
Access to a new source of freshwater would help promote agriculture, reforestation, and restoration of green areas, benefiting at least three hundred families. Consequently, the following research questions arise: How would identifying groundwater potential zones help in the agricultural reactivation of the Entre Ríos commune? How can water resources be managed for sustainable rural development?
The objective of this study is to generate a map of the potential of the underground water resource in the Entre Ríos commune through correlation with geology, geoelectric prospecting (VES and TEM), multicriteria decision methods based on AHP and the integration of information in a GIS, for the formulation of water management and sustainable rural development strategies.
2.1 Geographical context
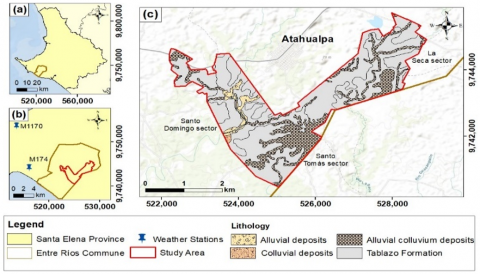
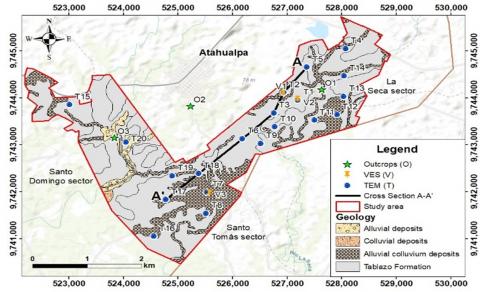
The study area covers 1120 ha of semi-arid land corresponding to the sectors of Santo Domingo, Santo Tomás and La Seca in the Entre Ríos commune, Atahualpa parish, province of Santa Elena (Figure 1(a), (b), (c)). The local climate has two seasons: rainy and dry. The rainy season extends from December to June and is cloudy and warm. On the other hand, the dry season occurs from July to November and is partially cloudy. The average annual temperature is between 25℃ and 26℃. According to records from the closest meteorological stations, M174-Ancón located 9km away and M1170-Universidad de Santa Elena 15km away (Figure 1(b)), the average annual precipitation in the study area varies between 200 and 300mm [26], with an average yearly evapotranspiration of 1197.6mm [27].
Figure 1. The study area map (a) Santa Elena province; (b) Entre Ríos commune, study area and meteorological stations; (c) Lithological map of the study area
Source: Adapted from studies [28, 29].
2.2 Geological context
The southwestern region of the Ecuadorian coast is an active margin area with a very complex structure, where oblique subduction phenomena occur and give rise to shear, reverse and normal faults [30, 31]. The province of Santa Elena has sedimentary materials from the Paleogene to the Quaternary period, with a basement of tholeiitic basaltic rocks that corresponds to the Piñón Formation (Piñón Fm.), of oceanic origin and Cretaceous period [30-32].
The study area lies in the Tablazo Formation (Tablazo Fm.) of Pleistocene age and shallow marine paleoenvironment, which covers almost the entire Ecuadorian coastal margin. Its composition includes fine sands, calcareous conglomeratic sands (coquinas) and calcareous sandstones, with fossils suggesting brackish facies. Tablazo Fm. is in discordance with the Cretaceous-Paleogene rocks of the Santa Elena Peninsula and has been influenced by Quaternary faults. Grey silty sediments cover the plateaus of this formation. The characteristics of this formation (porosity, permeability and transmissibility) allow it to store and transmit groundwater. Its power varies between 50 and 100 meters [33, 34].
The lithology of the study area (Figure 1(c)) mainly comprises the Tablazo Fm., made up of microconglomerates to breccia materials, with very compact white to grey calcareous cement and fine to medium grain calcareous sandstone. To the west, in the Santo Domingo sector, 33.2 hectares of alluvial deposits composed of fine gravel, medium fine sand and silt emerge. In the southwest of Santo Domingo, there are 3.1 ha of colluvial deposits composed of clays with angular clasts. The Santo Tomás and La Seca sectors (134.3 ha and 84.9 ha, respectively) have colluvial-alluvial deposits formed by silt, fine to coarse-grained sand and gravel [28].
2.3 Socioeconomic context
According to data from the National Institute of Statistics and Censuses (INEC, by its Spanish acronym), the population of the Atahualpa parish reaches 4,004 inhabitants [35]. The main economic activity of the parish is cabinetmaking, followed by commerce and transportation services, representing 53.39% of workers. On the other hand, farmers and skilled agropecuary and fishing workers only represent 3.18% [25, 35, 36]. 95.44% of inhabitants in the parish have a job, but only 27.65% have access to social benefits [37].
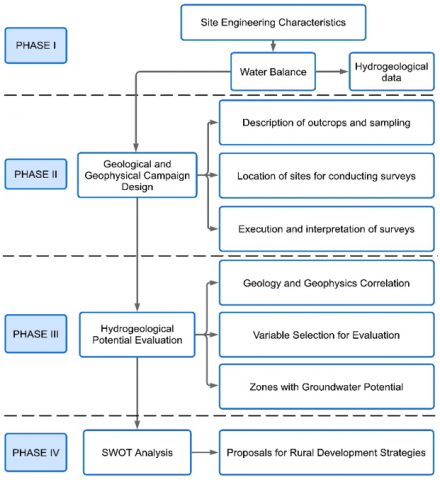
The method was based on generating thematic maps (lithology, resistivity, texture, slope, drainage density and precipitation), their reclassification and subsequently weighted overlay using AHP and GIS tools to prepare a GWPZ map [38]. In addition, strategies are established based on a SWOT analysis, focused on sustainable water management and WS&H techniques for rural agricultural development. The methodological approach had four phases: i) site engineering characteristics, ii) design of the geological and geophysical campaign, iii) evaluation of the hydrogeological potential, and iv) SWOT analysis and proposal of strategies for rural development (Figure 2).
Figure 2. Methodological scheme for the preparation of the GWPZ map and management strategies through four study phases
3.1 Phase I: Site engineering characteristics
3.1.1 Hydrogeological data sequence
The water balance was analysed for the period between 1981 and 2016, according to the rainfall data available from the meteorological stations closest to the study area (M174 and M1170) of the National Institute of Meteorology and Hydrology (INHAMI, for its acronym in Spanish) [29] (Figure 1(b)). De la estación M174 se extrajeron datos de 1981 a 2002, y de la estación M1170, del 2003 a 2016. This data was complemented by data from between 1981 and 2016 from the National Aeronautics and Space Administration (NASA) generated from models and satellite observations [39].
The data set from both sources (INHAMI and NASA) was statistically correlated using Pearson's Correlation Coefficient [40]. This coefficient is a value between 1 and -1 that measures the close relationship between two variables. Values between 0 and 1 maintain a positive correlation, and values between 0 and -1 have a negative correlation. The Excel linear correlation coefficient function (CORREL) was used to complete the precipitation data sequence. Values for January to July and November to December showed a solid correlation (between 0.5 and 1), and for August to October, a non-existent or very weak correlation (between -0.3 and 0.3).
3.1.2 Water balance
Field capacity was determined through Eq. (1) (Cc). The predominant texture of the soil was clay-sandy loam, indicating an apparent density (ρ) of 1,415kg/m3 according to data from the Military Geographic Institute [28] and a field capacity percentage (% Fc) of 19.65% [41]. According to in situ observations, the estimated height between the water table and the land surface (pl) was 4m.
$F c=(p l * \rho) *\left(\frac{\%\ F c}{100}\right)$ (1)
Potential evapotranspiration and actual evapotranspiration were calculated using the Thornthwaite [42] and Turc methods [43], Eqs. (2)-(5), respectively. The water deficit was calculated by subtracting actual evapotranspiration from potential evapotranspiration [16, 40].
$ETp=16{{\left( 10*\frac{t}{I} \right)}^{a}}*\frac{N}{12}*\frac{d}{30}$ (2)
where, $ETp$ is potential evapotranspiration, t is the average monthly temperature in ℃; I is the annual heat index, $a$ is a parameter calculated based on I, N is the maximum number of hours of sunshine, and $d$ is the maximum number of days in the month.
$I=\sum_{n=1}^{n=12} i_n=\sum_{n=1}^{n=12}\left(\frac{t}{5}\right)^{1.514}$ (3)
where, i is monthly heat index (℃).
$a=\left( 675\text{*}{{10}^{-9}}\text{*}{{I}^{3}} \right)-\left( 771\text{*}{{10}^{-7}}\text{*}{{I}^{2}} \right)+\left( 1792\text{*}{{10}^{-5}}\text{*I} \right)+0.49239$ (4)
$ETa=\frac{P}{\sqrt{0.9+\frac{{{P}^{2}}}{{{\left( 300+25t+0.05{{t}^{3}} \right)}^{2}}}}}$ (5)
where, $ETa$ is actual evapotranspiration (mm), and P is precipitation (mm/year).
3.2 Phase II: Design of the geological and geophysical survey
During this phase, shapefiles of rivers and access roads from the IGM were collected, and contour lines were generated from ALOS PALSAR 2010 satellite images with a precision of 12.5 meters for the design of the geological and geophysical campaign.
The geological campaign considered the survey of the study area's lithology by identifying outcrops and their description at macro and meso scales (stratigraphic columns). In addition, water outcrops were identified for in situ sampling and physicochemical analysis with the HANNA HI9829 multiparametric equipment.
The geophysical campaign included VES and TEM. Both methods allow the study of the subsoil through the variation of resistivities as a function of depth. VES works through the injection of direct current into the ground. Three VES were carried out using the Terrameter SAS 1000 equipment, considering a Schlumberger array with an AB/2 electrode configuration arranged over a length of 100 m, reaching depths of up to 30.7 m. The TEM test works through electrical impulses that travel through copper cables placed on the ground. Twenty TEM soundings were performed using the ABEM WalkTEM 2. The survey was performed with a 40x40 m transmit loop (TL-1K6) in a square arrangement and an RC-5 receiver coil in the centre. All measured data considered an error of less than 5%.
Criteria related to terrain irregularities, access, vegetation, sources of interference, and owner permits allowed the establishment of the sounding points. The data obtained were processed using the programs IPI2win for VES and Aarhus SPIA for TEM.
3.3 Phase III: Evaluation of the hydrogeological potential for the zoning of the territory
At this stage, the geological and geophysical data were correlated to obtain a lithological classification table based on resistivities, using as reference the resistivity margins established by Orellana [44] and previous research near the study area [45, 46] to improving the interpretation. Additionally, stratigraphic columns and a cross-section were generated using Strater 5 software.
The multicriteria analysis considered six parameters involved in the availability of groundwater: five intrinsic (Ip) to the terrain (lithology, resistivity, texture, slope, and drainage density) and one external (Ep) (precipitation).
In the AHP context, the criteria must be independent, without information redundancy. In this way, lithology and resistivity don't mean the same. The parameter lithology provides information about the type of rock or sediment, which can indicate an area's water storage capacity [15]. On the other hand, resistivity provides information about the presence of groundwater [44].
The weights of the intrinsic parameters were assigned using the Nominal Group Technique (NGT) [47], with the participation of experts in geology, geophysics and hydrogeology. Assigned weights consistency was validated using the AHP [18] through consistency ratio (Table 1) Eq. (6). Subsequently, both groups of parameters (Ip and Ep) were weighted according to their implication for the occurrence of GWPZ through the NGT, constructing Eq. (7).
Table 1. Criteria comparison matrix (AHP)
|
|
R |
S |
Dd |
L |
T |
Weights |
|
R |
1.00 |
5.00 |
5.00 |
1.00 |
3.00 |
0.35 |
|
S |
0.20 |
1.00 |
2.00 |
0.20 |
0.25 |
0.07 |
|
Dd |
0.20 |
0.20 |
1.00 |
0.20 |
0.25 |
0.05 |
|
L |
1.00 |
5.00 |
5.00 |
1.00 |
3.00 |
0.35 |
|
T |
0.33 |
4.00 |
4.00 |
0.33 |
1.00 |
0.18 |
|
SUM |
2.7 |
15.2 |
17.0 |
2.7 |
7.5 |
1 |
Note: R: resistivity, S: slope, Dd: drainage density, L: lithology, T: texture. The consistency ratio is equal to 0.02, less than 0.1. Therefore, the matrix is consistent [18].
$Ip=R*0.35+S*0.07+Dd*0.05+L*0.35+T*0.18$ (6)
$GWPz=Ip*0.60+Ep*0.40$ (7)
Thematic maps were generated for each parameter using ArcGIS, and reclassification was carried out into four classes according to the potential to store groundwater: low, medium, high and very high. Finally, the weighted overlay of the reclassified thematic maps in raster format was performed [48] through Eq. (7), obtaining the GWPZ map.
3.4 Phase IV: SWOT analysis and proposals for rural development strategies
This phase considered the results obtained in the previous phases and the preparation of a SWOT analysis (Strengths, Weaknesses, Opportunities and Threats) [49], for the proposal of strategies aligned with the sustainable development goals (SDG) 2, 6, 8 and 12, considering the limitations and needs of the agricultural sector mentioned previously.
4.1 Hydric balance
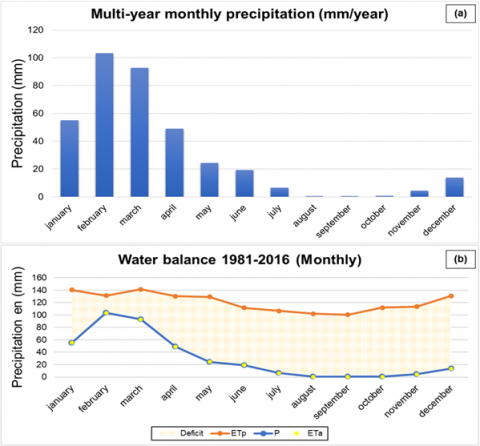
The water balance was carried out for the period from 1981 to 2016, based on the multi-temporal analysis of the average annual precipitation, multi-annual monthly rainfall, and the analysis of the potential and actual evapotranspiration for the mentioned period, obtaining 1079mm of water deficit (Figure 3).
The monthly average of multi-year precipitation (Figure 3(a)) allowed identify the months from January to May as those with the highest precipitation, with a peak of precipitation in February (103.27mm), and the months from June to December as those with the lowest precipitation, where the average rainfall for August, September and October is less than 1mm. As for the ETp, it showed values above the precipitation throughout the entire period. The monthly analysis indicated higher values of evapotranspiration related to the rainy season (December to May), with a maximum of 141mm in January and March, and lower values associated with the dry season (June to November), with a minimum of 101mm in September (Figure 3(b)).
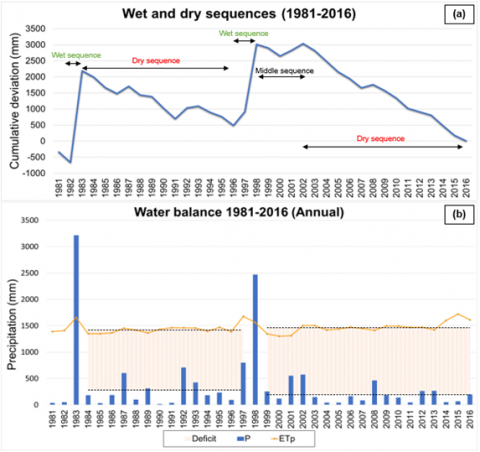
The accumulated standard deviation of precipitation allowed identify two wet sequences lasting a maximum of three years, two dry sequences lasting at least thirteen years, and an average sequence of four years, with the wet and average sequences being much shorter than the dry ones (Figure 4(a)).
According to the multitemporal analysis of the mean annual precipitation (Figure 4(b)), the average rainfall is 370.33mm. 1983 and 1998 were identified as the years with the highest rainfall, with 3,215mm and 2,472mm, respectively, associated with "El Niño" phenomenon.
The annual analysis showed an increase in ETp over time, with a value of 1,389.76mm in 1981 and 1,612.97mm in 2016, with an average of 1,458.02mm throughout the entire period (Figure 4(b)). The ETa did not present significant variation with precipitation, except in El Niño events of 1983 and 1998, where precipitation values exceeded 2,400mm (Figure 4(b)).
Evapotranspiration and average precipitation were analysed for two subperiods, 1984 to 1997 and 1999 to 2016. For the first subperiod, evapotranspiration, precipitation, and water deficit were 1,431.54mm, 279.11 and 1,152.43mm, respectively. The values for the second subperiod were 1,468.66mm, 202.83mm, and 1,265.84mm, respectively. These values demonstrated greater evapotranspiration, lower precipitation, and a more significant water deficit in the second subperiod (Figure 4(b)). The temperature variation calculated every ten years had an increase of 0.21℃ [50-54].
High precipitation and temperature values are related to El Niño phenomenon, while low rainfall and temperatures are related to La Niña phenomenon; there is also a neutral phase where neither El Niño nor La Niña occurs. These three phases alternate in time and are known as El Niño-Southern Oscillation cycle [50].
Figure 3. Multitemporal precipitation analysis 1981-2016 (a) Multi-year monthly precipitation (mm/year); (b) Water balance
Source: Adapted from studies [29, 38]
Figure 4. Annual analysis 1981-2016 (a) Wet and dry sequences; (b) Annual water balance
ETp: potential evapotranspiration, P: annual rainfall
Source: Adapted from [53, 54]
Figure 5. Location of outcrops, soundings and cross-section A-A'
Source: Adapted from IGM [28]
The National Oceanic and Atmospheric Administration (NOAA) bases its operational definitions for El Niño and La Niña on the Oceanic Niño Index (ONI) [51]. El Niño characterizes a positive ONI of +0.5℃ or greater, and La Niña depicts a negative ONI of -0.5℃ or less [52].
The literature has reported the occurrence of La Niña Phenomenon in the years 1983, 1984, 1985, 1988, 1989, 1995, 1996, 1998, 1999, 2000, 2001, 2005, 2006, 2007, 2008, 2009, 2010, 2011, and 2016 for the study period [53, 54]. La Niña phenomenon recorded the lowest values of evapotranspiration and precipitation in 1985 and 2000 (Figure 4(b)).
4.2 Geological and geophysical survey
4.2.1 Geological survey
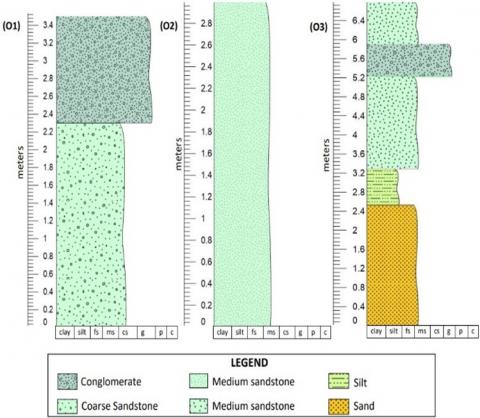
Three geological surveys were carried out on the outcrops identified within and near the study area: O1 (La Seca Sector), O2 (north of the Santo Tomás Sector), and O3 (Santo Domingo Sector) (Figure 5). Figure 6 shows the stratigraphic columns of the three outcrops. In general, the area's lithology includes sands, medium-to coarse-grained sandstones, conglomerates, and silts. Furthermore, during the geological campaign, the in situ physicochemical analysis of an outcropping water site near the O3 outcrop was carried out. The measured values (Table 2) indicated the presence of brackish water catalogued with severe restriction for use in agriculture, according to the Ecuadorian environmental regulation of the Unified Text of Secondary Legislation of the Environment Ministry (TULSMA, by its acronym in Spanish) [55].
Table 2. Physicochemical parameters measured in-situ in outcropping water near “O3” (Santo Domingo) and comparison with TULSMA irrigation water standards
|
Parameters |
Measured Value |
Irrigation Water Standards |
|
pH |
8.12 |
6-9 |
|
Conductivity (μS/cm) |
34,830 |
Degree of restriction: ≤700 none, 700 to 3,000 mild-moderate, >3,000 severe |
|
Total Dissolved Solids(ppm) |
17,420 |
Degree of restriction:450 none, 450 to 2000 mild-moderate, 2000 or greater severe |
|
Salinity (PSU) |
21.83 |
<0.5 freshwater, 0.5 to 30 brackish water, >30 saltwater |
|
Temperature (℃) |
27.74 |
25±3 |
|
Resistivity (Ω cm) |
0.003 |
- |
4.2.2 Geophysical survey
The geophysical survey included 20 TEMs and 3 VESs in the study area according to the configuration shown in Figure 5. The Santo Tomás and La Seca sectors were the principal interest sectors for geoelectric prospection because the first surveys in the Santo Domingo sector and brackish water presence indicated the absence of fresh groundwater in this area.
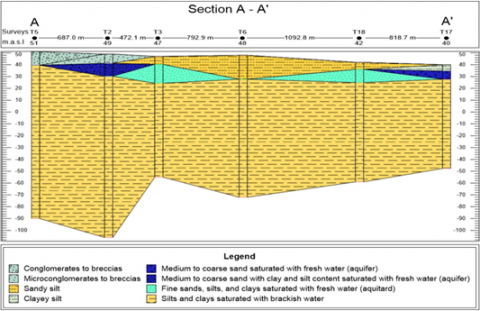
The interpretation contemplated several cross-sections, considering section A-A' (Figure 6) as the most representative by crossing the two sectors of hydrogeological interest. Figure 6 shows the lithological profile prepared from the resistivities correlation of soundings T5, T2, T3, T6, T18 and T17 (see Figure 4), interpreting eight lithologies: conglomerates to breccia, microconglomerates to breccia, silty sandstone, silty clay, medium to coarse sand, medium to coarse sand with clay and silt, fine sand with silt and clay, and silt with clay. The groundwater potential was estimated between 10 and 20 meters deep in La Seca sector and 5 and 10 meters deep in the Santo Tomás sector (Figure 7).
Figure 6. Stratigraphic columns: (O1) 1.2 m of conglomerates and 2.3m sandstones at the base, (O2) silty sandstones (3m), (O3) sandstones (0.9m), conglomerates (0.7m), sandstones (2m), siltstones (0.7m) and sands (2.5m), from the roof to the base
Note: fs: fine sand, ms: medium sand, cs: coarse sand, g: granules, p: pebbles, c: cobbles
Table 3 shows the lithological classification of the resistivity intervals according to their location above or below the estimated water table.
Table 3. Lithological classification based on resistivities
|
Location |
Res. (Ω·m) |
Description |
|
Above the water table |
> 85 |
Conglomerates to non-compact breccia, with coarse-grained calcareous sandstones |
|
35-85 |
Microconglomerates with fine to medium sandstones and calcareous material |
|
|
15-35 |
Silts, fine to coarse sands, gravel content |
|
|
4-15 |
Clayey silt |
|
|
Below the water table |
60-80 |
Medium to coarse sand saturated with freshwater |
|
20-60 |
Medium to coarse sand with a low percentage of clays, silts and gravels, saturated with freshwater |
|
|
7-20 |
Fine sands, silts and clays saturated with freshwater |
|
|
<7 |
Silts and clays saturated with brackish water |
Figure 7. Cross section A-A'
m.a.s.l. indicates meters above sea level
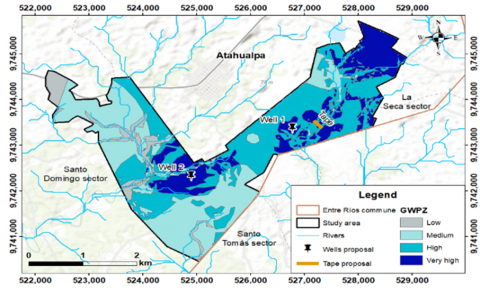
Figure 8. GWPZ map and proposal location of WS&H systems
4.3 Evaluation of hydrogeological potential
Figure 8 shows the GWPZ map of the study area, where variations in shades of blue indicate groundwater potential from Low to Very High. The High and Very High Potential zones occur in the Santo Tomás and La Seca sectors, with an approximate area of 72 and 125 ha for High Potential, respectively.
4.4 Rural development strategies
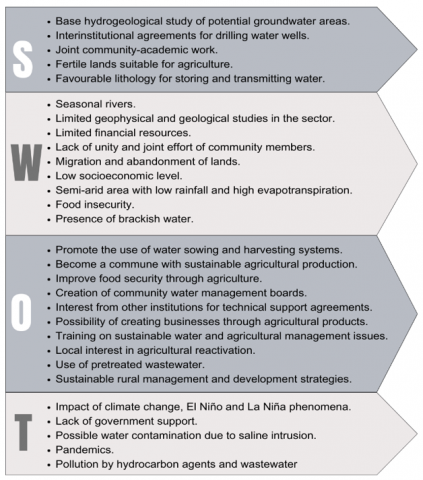
Figure 9 presents the SWOT analysis detail based on the study area's hydrological and hydrogeological results.
Based on the results of the previous sections and the SWOT analysis, strategies were configured for rural agricultural development. The proposal integrates five actions for the comprehensive management of local water resources, considering:
(1) Implementation of WS&H techniques, such as the construction of an exploratory well in the northeast of the study area (La Seca) or the central-southern region (Santo Tomás) and the construction of a dam or tape on the La Seca River (Figure 8), to promote aquifer recharge and ensure water freshwater supply (SDG 6.4). Water disponibility could benefit agricultural development, local food security (SDG 2.4) and the creation of economic development opportunities through the sale of farm products or their derivatives (SDG 8.4)
(2) Monthly monitoring of the phreatic levels and physicochemical parameters of the water wells, considering salinity, conductivity and total dissolved solids for the analysis of water quality, according to water standards for irrigation of the national regulations (TULSMA) [55]. Guaranteeing the availability of good quality water for use in agriculture and its sustainable management (SDG 6.4).
(3) Carry out pumping tests to better understand the aquifer's dynamic and optimize the resource's sustainable use (SDG 6.4).
(4) Evaluation and reuse of pretreated wastewater from waste stabilization ponds in agriculture and forestry [56] promoting water-safe reuse and sustainable production (SDG 12.5).
(5) Strengthen hydrogeological studies in areas with the highest groundwater potential, specifically in the extreme northeast of the La Seca sector, which, according to the GWPZ map, has a very high potential to store groundwater (SDG 6.4) (Figure 8).
Figure 9. Strengths, Weaknesses, Opportunities, and Threats (SWOT) analysis
In this work, groundwater potential zones were delimited through hydrological, geological, and geoelectrical studies and the use of the hierarchical analytical process to construct zoning maps, allowing the proposal of water management strategies and sustainable rural development.
The water balance indicates a deficit of 1,079mm for the period 1981-2016, where there are only reserves and surpluses in humid sequences corresponding to the events of El Niño in 1983 and 1998. On the other hand, low precipitation and evapotranspiration values between 1985 and 2000 were related to La Niña (Figure 4(b)). This phenomenon is best identified in monthly intervals since it does not always occur all year round, or El Niño and La Niña can even happen in the same year. The most prolonged La Niña period was 32 consecutive months between 1998 and 2001 [53, 54].
The calculated temperature increase per decade in the study area was 0.21℃, equivalent to 1.05℃ every 50 years, close to the global increase rate of 1.1℃, associated with climate change trends [57]. The record of the El Niño and La Niña phenomena denote variations in global temperature and evapotranspiration values, which affects semi-arid areas such as Entre Ríos in the province of Santa Elena. Climate change affects the coastal aquifer of the study area, where the primary source of recharge comes from seasonal rainfall and rivers. Furthermore, rising sea levels generate a threat related to saline intrusion [57, 58]. According to Slama et al. [58], climate change is expected to slow recharge levels from 10% to 30% by 2070. Therefore, it is necessary to identify appropriate management practices, such as WS&H and strategic policies, to ensure the sustainable use of natural resources [59, 60].
The study area corresponds mainly to the Fm. Tablazo, whose characteristics favour the storage and transmission of groundwater. The presence of calcareous sandstones with fossils that suggest a brackish face contributes to the salinity of the water due to its composition [33, 34]. Another factor that could be related to the increase in salinity is its proximity to the coastline (four to ten kilometres).
The measurement of physicochemical parameters recognized the presence of brackish water in the Santo Domingo sector (Figure 7) with 21.83 PSU, a value close to the salinity of seawater of 35 PSU, further corroborated with resistivity values less than 4 Ω·m obtained up to 75m depth.
The AHP in this research used the most common construction parameters of GWPZ models, such as lithology, texture, slope and drainage density, according to the literature [15, 17, 19]. However, resistivity was also adopted as an intrinsic criterion since it strongly indicates groundwater presence [44]. Regarding weightings assignment, lithology and resistivity had the most significant weights, as they were considered the most determining criteria for groundwater occurrence in the area. Compared to those above, criteria such as slope, texture and drainage density did not receive such high weights as in similar studies [15, 17]. The calculated consistency ratio of less than 0.1 validated these considerations.
A limitation of the AHP is the subjectivity related to assigning weights to the criteria, considering their hierarchy based on their relative importance and preference, which often depends on the judgments of experts [18]. Therefore, subjectivity in assigning weights can influence results and decision-making. It is important to consider performing sensitivity analyses to identify discrepancies and biases and contribute to the credibility of the weighting framework [61].
Geophysics allowed the inferring of stratigraphy by correlating resistivity intervals with lithologies and water-saturated zones. In the La Seca sector, a shallow aquifer is estimated between 10 and 20 meters deep, with resistivity values between 20 and 60 Ω·m (medium to coarse sand with clay and silt content, saturated with fresh water). On the other hand, in the Santo Tomás sector, a semi-confined shallow aquifer is estimated between 5 and 10 meters deep, with resistivity values between 60 and 80 Ω·m (medium to coarse sand saturated with fresh water), greater storage capacity and water transmissibility. These values show correspondence to ranges of resistivities obtained in similar lithologies (Quaternary sedimentary deposits) of the coastal environment of Santa Elena, such as the Valdivia aquifer (Santa Elena, Ecuador), with values assigned to the saturation zone between 25 and 95 Ω·m [62]. Another example corresponds to the Yarada coastal aquifer (Tacna, Perú), of similar lithology, whose resistivities associated with the aquifer are between 11.5 and 37.3 Ω·m in comparison [63].
The resistivity ranges were fundamental for identifying water occurrence zones. Although the reference values of Orellana [44], were taken as a basis, the adjustment with previous works in the area [45, 46], similar works in other parts of the world [64], and the lithological correlation allowed improving and refining the range of interest of groundwater to an interval of 20 to 80 Ω·m.
The presence of “high” GWPZ in the Entre Ríos commune implies multiple impacts at a social and environmental level. In the social aspect, it represents an opportunity for the development of agriculture [65], new job opportunities and an economic boost for the benefit of around 300 families. However, incorrect management can cause conflicts of appropriation/privatization of the resource, affecting community access. Environmentally, it could be helpful in the restoration of green areas [66]; however, deficient management can lead to overexploitation, saline intrusion, nitrate contamination from poor agricultural practices, and a decrease of phreatic level as has happened on the coastal margin of Sabratah (Lybia) [67]. In some instances, groundwater stress factors can propagate stressors towards surface waters [68].
Future research may consider specific areas of interest according to the GWPZ map that were not studied in depth in the present study, such as the northeastern end of the La Seca sector, through a broader geophysical campaign to obtain more accurate data on the depth and thickness of the aquifer layer, that allows the correlation with current study findings and offers a wider knowledge about local groundwater context.
The combination of geological and geophysical methods, precipitation analysis and the AHP through GIS, which this study involves, are some of the most used for GWPZ mapping due to its holistic approach that integrates various sources of information and techniques for a more complete and accurate evaluation of groundwater potential. This approach has been instrumental in arid or coastal areas such as Saudi Arabia [69], Egypt [70] and China [71], for the delimitation of areas of water interest and, in turn, for the formulation of sustainable management strategies. However, alternative approaches also suggest the use of remote sensing [72] and alternative geoelectrical methods, such as the use of electrical resistivity tomography (ERT) [73, 74].
The strategic proposal integrates water solution actions in the Entre Ríos community to benefit rural development based on agriculture. WS&H techniques can contribute to the management and sustainability of the underground resource, ensuring its availability in times of low precipitation [13]. Techniques of this type are widespread globally, helping in the effective management of water resources (e.g., Perú and Spain) [75]. In nearby communities such as Manglaralto and Olón (Santa Elena, Ecuador), similar actions are made by constructing artisanal or purely artisanal-technical tapes (dams) to increase the capture, infiltration, and recharge of groundwater recovered through water wells [14]. Agriculture can be developed by having more water, strengthening food security for the community (SDG2), and positively impacting the creation of economic development opportunities (SDG8).
The hydrogeological characterisation of the aquifer and constant monitoring make it possible to ensure water quality (SDG 6) and determine the exploitable flow to achieve sustainable management and responsible use of water resources (SDG 12) [76].
Surface water, such as wastewater, can solve part of the water shortage through green filter systems. Its use focused on reforestation can help recover the ecosystem, while in silviculture, it can contribute to the development of timber species, promoting local economic activity (cabinetry). Actions of this type are recognised locally in the Montañita commune (Santa Elena, Ecuador) [56], and worldwide, in Israel, where about 90% of wastewater is reused [77].
This study allowed the evaluation of the underground water potential in the Entre Ríos commune. The criteria of lithology, resistivity, texture, slope, drainage density and precipitation were used to prepare a GWPZ map. The northeastern (La Seca) and central-south (Santo Tomás) sectors of the study area presented zones of very high potential, with thicknesses of 10 and 5 meters, respectively, related to mainly medium to thick sand lithologies, with resistivities between 20 and 80 Ω·m. The northeastern end of the La Seca sector appears to be of interest according to the GWPZ map (Figure 7).
The study proposes sustainable water and agricultural management strategies to ensure the quantity and quality of irrigation water resources, based principally on WS&H techniques (constructing tapes and exploratory wells) and monitoring the water's physical-chemical parameters. In addition, the use of treated wastewater for silviculture and restoration of green areas is proposed. These strategies mainly contribute to SDGs 2, 6, 8, and 12 of the 2030 Agenda, promoting food security, water availability, decent work, and sustainable production at the community level.
This research constitutes a hydrogeological conceptual basis for the community, which, with the support of government entities, can develop water use projects for agricultural reactivation. In hydrogeology, the study provides a comprehensive methodology combining GIS, AHP and geophysical surveys to understand the potential of groundwater resources. The study's practical applications, such as the strategic proposal, promote techniques for the sustainable management of the aquifer. They address the challenges of water and agricultural security in the commune and demonstrate the direct impact of hydrogeological studies on the quality of life of rural sectors.
Future research directions may be focused towards a greater understanding of the distribution, characteristics and dynamics of the aquifer through other specialized studies such as geoelectric tomographies to develop a 2D and 3D model of the aquifer and resource quantification, long-term monitoring (exploratory wells, pumping tests, water level and physicochemical parameters) to know the quantity and quality of water, simulation of flow models under different scenarios, and aquifer vulnerability studies.
The research was funded by ESPOL. The following projects support this work: “Registro de sitios de interés geológico del Ecuador para estrategias de desarrollo sostenible” (Registry of geological sites of interest in Ecuador for sustainable development strategies), with code No. CIPAT-002-2023 and “Siembra, cosecha y reutilización del agua en un contexto de economía circular” (Sowing, harvesting and reuse of water in a circular economy context) with code No. PG13-PY23-10. Also, the authors would like to thank the Entre Ríos Community Board for its support in developing the present scientific work.
[1] Chandnani, G., Gandhi, P., Kanpariya, D., Parikh, D., Shah, M. (2022). A comprehensive analysis of contaminated groundwater: Special emphasis on nature-ecosystem and socio-economic impacts. Groundwater for Sustainable Development, 19: 100813. https://doi.org/10.1016/j.gsd.2022.100813
[2] Shiklomanov, I.A., Rodda, J.C. (Eds.). (2003). World Water Resources at the Beginning of the Twenty-First Century. Cambridge University Press.
[3] Irfeey, A.M.M., Najim, M.M., Alotaibi, B.A., Traore, A. (2023). Groundwater pollution impact on food security. Sustainability, 15(5): 4202. https://doi.org/10.3390/su15054202
[4] Warner, S. (2021). Progress on ambient water quality: Tracking SDG 6 series-global indicator 6.3. 2 updates and acceleration needs. Nairobi. https://wedocs.unep.org/20.500.11822/36689
[5] United Nations. The united nations world water development report 2022. groundwater: Making the invisible visible. Paris: UNESCO, 2022. https://unesdoc.unesco.org/ark:/48223/pf0000380721, accessed on Jun. 5, 2023.
[6] FAO. Water. https://www.fao.org/water/en/, accessed on Oct. 18, 2023.
[7] Giordano, M. (2006). Agricultural groundwater use and rural livelihoods in sub-Saharan Africa: A first-cut assessment. Hydrogeology Journal, 14: 310-318. https://doi.org/10.1007/s10040-005-0479-9
[8] Shah, T. (2009). Taming the Anarchy: Groundwater governance in South Asia. Washington, DC, USA; Colombo, Sri Lanka: Resources for the Future; International Water Management Institute (IWMI).
[9] Sikka, A.K., Alam, M.F., Pavelic, P. (2021). Managing groundwater for building resilience for sustainable agriculture in South Asia. Irrigation and Drainage, 70(3): 560-573. https://doi.org/10.1002/ird.2558
[10] Villholth, G.K. (2023). Groundwater irrigation for smallholders in Sub-Saharan Africa-a synthesis of current knowledge to guide sustainable outcomes. In Sustainable Groundwater Development for Improved Livelihoods in Sub-Saharan Africa, pp. 7-29.
[11] Morante-Carballo, F., Montalván-Burbano, N., Quiñonez-Barzola, X., Jaya-Montalvo, M., Carrión-Mero, P. (2022). What do we know about water scarcity in semi-arid zones? A global analysis and research trends. Water, 14(17): 2685. https://doi.org/10.3390/w14172685
[12] Snapp, S.S., Kebede, Y., Wollenberg, E.K., Dittmer, K.M., Brickman, S., Egler, C., Shelton, S.W. (2021). Agroecology and climate change rapid evidence review: Performance of agroecological approaches in low-and middle-income countries. CGIAR Research Program on Climate Change, Agriculture and Food Security.
[13] Martos-Rosillo, S., Durán, A., Castro, M., Vélez, J.J., Herrera, G., Martín-Civantos, J.M., Mateos, L., Durán, J. J., Jódar, J., Gutiérrez, C., Hermoza, R.M., Peña, F. (2021). Ancestral techniques of water sowing and harvesting in Ibero-America: Examples of hydrogeoethical systems. In Advances in Geoethics and Groundwater Management: Theory and Practice for a Sustainable Development: Proceedings of the 1st Congress on Geoethics and Groundwater Management (GEOETH&GWM'20), Porto, Portugal 2020, pp. 489-492. https://doi.org/10.1007/978-3-030-59320-9_104
[14] Carrión-Mero, P., Morante-Carballo, F., Briones-Bitar, J., Herrera-Borja, P., Moncayo, M.C., Arévalo-Ochoa, J. (2021). Design of a technical-artisanal dike for surface water storage and artificial recharge of the manglaralto coastal aquifer. Santa Elena Parish, Ecuador. International Journal of Sustainable Development & Planning, 16(3): 515-523, https://doi.org/10.18280/ijsdp.160312
[15] Abdullahi, A., Jothimani, M., Getahun, E., Gunalan, J., Abebe, A. (2023). Assessment of potential groundwater Zones in the drought-prone Harawa catchment, Somali region, eastern Ethiopia using geospatial and AHP techniques. The Egyptian Journal of Remote Sensing and Space Science, 26(3): 628-641. https://doi.org/10.1016/j.ejrs.2023.07.005
[16] Carrión-Mero, P., Olaya, P., Sanango-Ochoa, L., Cano-Alvarado, F., Bravo-Montero, L., Solórzano, J., Morante-Carballo, F. (2023). Hydrogeological characterization of a coastal area for the groundwater exploitation. Hondo River micro-watershed, Santa Elena-Ecuador. International Journal of Sustainable Development & Planning, 18(2): 401-410, https://doi.org/10.18280/ijsdp.180208
[17] Kom, K.P., Gurugnanam, B., Sunitha, V. (2024). Delineation of groundwater potential zones using GIS and AHP techniques in Coimbatore district, South India. International Journal of Energy and Water Resources, 8(1): 85-109. https://doi.org/10.1007/s42108-022-00188-y
[18] Saaty, T.L. (1980). The Analytic Hierarchy Process: Planning, Priority Setting, Resource Allocation. New York: McGraw-Hill.
[19] Uc Castillo, J.L., Martínez Cruz, D.A., Ramos Leal, J.A., Tuxpan Vargas, J., Rodríguez Tapia, S.A., Marín Celestino, A.E. (2022). Delineation of groundwater potential zones (GWPZs) in a semi-arid basin through remote sensing, GIS, and AHP approaches. Water, 14(13): 2138. https://doi.org/10.3390/w14132138
[20] Deep, M.A., Araffa, S.A.S., Mansour, S.A., Taha, A.I., Mohamed, A., Othman, A. (2021). Geophysics and remote sensing applications for groundwater exploration in fractured basement: A case study from Abha area, Saudi Arabia. Journal of African Earth Sciences, 184: 104368. https://doi.org/10.1016/j.jafrearsci.2021.104368
[21] Bhatnagar, S., Taloor, A.K., Roy, S., Bhattacharya, P. (2022). Delineation of aquifers favorable for groundwater development using Schlumberger configuration resistivity survey techniques in Rajouri district of Jammu and Kashmir, India. Groundwater for Sustainable Development, 17: 100764. https://doi.org/10.1016/j.gsd.2022.100764
[22] El-Kaliouby, H. (2019). Groundwater prospecting in a hard-rock coastal area using off-set TDEM method: Case study. In SEG International Exposition and Annual Meeting, pp. 2755-2758. https://doi.org/10.1190/segam2019-3209246.1
[23] Carrión-Mero, P., Morante-Carballo, F., Herrera-Franco, G., Jaya-Montalvo, M., Rodríguez, D., Loor-Flores de Valgas, C., Berrezueta, E. (2021). Community-university partnership in water education and linkage process. Study case: Manglaralto, Santa Elena, Ecuador. Water, 13(15): 1998. https://doi.org/10.3390/w13151998
[24] Herrera-Franco, G, Bravo-Montero, L., Carrión-Mero, P., Morante-Carballo, F., Apolo-Masache, B. (2020). Community management of the Olón coastal aquifer, Ecuador, and its impact on the supply of water suitable for human consumption. WIT Transactions on Ecology and the Environment, 241: 169-181. https://doi.org/10.2495/SDP200141
[25] GAD Atahualpa. Plan de Desarrollo y Ordenamiento Territorial: Parroquia Atahualpa. Santa Elena, 2023. https://gadpr-atahualpa.gob.ec, accessed on May 23, 2023.
[26] Instituto Nacional de Meteorología e Hidrología. Publicaciones meteorológicas. https://www.inamhi.gob.ec/biblioteca/, accessed on Jun. 09, 2023.
[27] CLIRSEN-MAGAP. (2012). Generación de geoinformación para la gestión del territorio a nivel nacional escala 1:25.000. Santa Elena. https://www.geoportaligm.gob.ec/descargas_prueba/santa_elena.html, accessed on Jul. 2, 2023.
[28] Geoportal IGM. (2023). Cantón Santa Elena. https://www.geoportaligm.gob.ec/descargas_prueba/santa_elena.html, accessed on Aug. 14, 2023.
[29] INAMHI. Precipitación total mensual de las principales estaciones meteorológicas del INAMHI a nivel nacional. https://www.datosabiertos.gob.ec/dataset/precipitacion-total-mensual/resource/98c77d18-e863-4e00-8a22-eb47f2981d9c, accessed on Sep. 1, 2023.
[30] Núñez del Arco E. (2003). Geología del Ecuador. Guayaquil, Ecuador: Escuela superior politécnica del litoral. https://fdocuments.ec/document/libro-geologia-del-ecuador-por-ing-nunez-del-arco.html, accessed on Jul. 5, 2023.
[31] Aizprua, C., Witt, C., Johansen, S.E., Barba, D. (2019). Cenozoic stages of forearc evolution following the accretion of a sliver from the late cretaceous‐Caribbean large igneous province: SW Ecuador‐NW Peru. Tectonics, 38(4): 1441-1465. https://doi.org/10.1029/2018TC005235
[32] Benitez, S. (1995). Evolution géodynamique de la province côtière sud-équatorienne au Crétacé supérieur-Tertiaire. Doctoral dissertation, Université Joseph-Fourier-Grenoble I. https://doi.org/10.13140/RG.2.2.23065.75369
[33] Bristow, C.R., Hoffstetter, R. (1977). Lexico Estratigrafico Internacional. America Latina, Ecuador, 2nd ed.
[34] Ordoñez, M., Jiménez, N., Suáres, J. (2006). Micropaleontología Ecuatoriana. Centro de Investigaciones Geológicas Guayaquil & Petroproducción, Guayaquil.
[35] Instituto Nacional de Estadística y Censos. Pricipales Resultados Censo 2022 Parroquia Atahualpa. Censo Ecuador Cuenta Conmigo. https://censoecuador.ecudatanalytics.com/, accessed on Jan. 17, 2024.
[36] International Labour Organization. Follow the 112th International Labour Conference live from Geneva. https://www.ilo.org/global/lang--en/index.htm, accessed on Jan. 28, 2024.
[37] Insituto Nacional de Estadisicas y Censos (INEC). (2010). Base de datos-Censo de Población y Vivienda 2010. https://www.ecuadorencifras.gob.ec/base-de-datos-censo-de-poblacion-y-vivienda-2010/, accessed on May 30, 2023.
[38] Kadiri, M., Zarhloule, Y., Barkaoui, A.E., Ourarhi, S. (2023). Identification of potential artificial groundwater recharge sites using GIS and the analytical hierarchy process: Case study of Tamellalt plain, Morocco. Hydrogeology Journal, 31(7): 1813-1828. https://doi.org/10.1007/s10040-023-02701-x
[39] NASA. Data Access Viewer-NASA POWER. https://power.larc.nasa.gov/data-access-viewer/, accessed on Jun. 01, 2023.
[40] Asuero, A.G., Sayago, A., González, A.G. (2006). The correlation coefficient: An overview. Critical Reviews in Analytical Chemistry, 36(1): 41-59. https://doi.org/10.1080/10408340500526766
[41] FAO soils portal. Physical Properties. https://www.fao.org/soils-portal/soil-survey/propiedades-del-suelo/propiedades-fisicas/es/, accessed on Feb. 07, 2024.
[42] Thornthwaite, C.W. (1948). An approach toward a rational classification of climate. Geographical Review, 38(1): 55-94. https://doi.org/10.2307/210739
[43] Turc, L. (1961). Estimation of irrigation water requirements, potential evapotranspiration: A simple climatic formula evolved up to date. Ann. Agron, 12(1): 13-49.
[44] Orellana, E. (1972). Prospección Geoeléctrica en Corriente Continua, 2nd ed. Madrid, España: Paraninfo.
[45] Romero-Crespo, P. (2002). Estudio geoléctrico y planeamiento de explotación de aguas subterráneas en el sector de Santa Elena, Atahualpa, Ancón y Pechiche (Bachelor's thesis). ESPOL, Guayaquil, Ecuador. https://www.dspace.espol.edu.ec/handle/123456789/3426, accessed on Jul. 05, 2023.
[46] Jiménez-Oyola, S. (2008). Elaboración de un Plan de explotación de aguas subterráneas en una zona de la península de santa elena, mediante la interpretación de métodos resistivos. Facultad de Ingeniería en Ciencias de La Tierra, ESPOL, Guayaquil, Ecuador.
[47] Van de Ven, A.H., Delbecq, A.L. (1972). The nominal group as a research instrument for exploratory health studies. American Journal of Public Health, 62(3): 337-342. https://doi.org/10.2105/AJPH.62.3.337
[48] Kaliraj, S., Chandrasekar, N., Magesh, N.S. (2015). Evaluation of multiple environmental factors for site-specific groundwater recharge structures in the Vaigai River upper basin, Tamil Nadu, India, using GIS-based weighted overlay analysis. Environmental Earth Sciences, 74: 4355-4380. https://doi.org/10.1007/s12665-015-4384-9
[49] Dyson, R.G. (2004). Strategic development and SWOT analysis at the University of Warwick. European Journal of Operational Research, 152(3): 631-640. https://doi.org/10.1016/S0377-2217(03)00062-6
[50] Vicente-Serrano, S.M., Aguilar, E., Martínez, R., Martín-Hernández, N., Azorin-Molina, C., Sánchez-Lorenzo, A., El Kenawy, A., Tomás-Burguera, M., Moran-Tejeda, E., López-Moreno, J.I., Revuelto, J., Beguería, S., Nieto, J.J., Drumond, A., Gimeno, L., Nieto, R. (2017). The complex influence of ENSO on droughts in Ecuador. Climate Dynamics, 48: 405-427. https://doi.org/10.1007/s00382-016-3082-y
[51] Zhang, R., Li, T., Wen, M., & Liu, L. (2015). Role of intraseasonal oscillation in asymmetric impacts of El Niño and La Niña on the rainfall over southern China in boreal winter. Climate Dynamics, 45(3–4), 559–567. https://doi.org/10.1007/s00382-014-2207-4
[52] What is El Niño & La Niña? NOAA. https://www.weather.gov/media/owlie/2018_ENSO.pdf, accesed on Feb. 1, 2024
[53] El Niño Oscilación del Sur. CIIFEN. Internacional para la Investigación del Fenómeno del Niño, Guayaquil, Ecuador. https://ciifen.org/el-nino-oscilacion-del-sur/, accesed on Feb. 01, 2024
[54] Kousky, V.E., Higgins, R.W. (2007). An alert classification system for monitoring and assessing the ENSO cycle. Weather and Forecasting, 22(2): 353-371. https://doi.org/10.1175/WAF987.1
[55] MAATE. (2017). Norma de Calidad Ambiental y de Descarga de Efluentes: Recurso Agua. Texto Unificado de Legislación Secundaria del Ministerio del Ambiente, TULSMA. https://faolex.fao.org/docs/pdf/ecu155128.pdf, accessed on Feb. 1, 2024
[56] Carballo, F.M., Brito, L.M., Mero, P.C., Aguilar, M.A., Ramírez, J.T. (2019). Urban wastewater treatment through a system of green filters in the Montañita commune, Santa Elena, Ecuador. WIT Transactions on Ecology and the Environment, 239: 233-249. https://doi.org/10.2495/WS190211
[57] IPCC. (2023). CLIMATE CHANGE 2023 Synthesis Report Summary for Policymakers. Intergovernmental Panel on Climate Change, Geneva, Switzerland.
[58] Slama, F., Dakhlaoui, H., Gargouri-Ellouze, E., Sidhom, O., Zemni, N., Bouksila, F., Hassen, I., Bouhlila, R. (2022). Assessment of groundwater recharge rates under projected climate change in arid and semiarid Tunisia. In Proceedings of the 39th IAHR World Congress, Granada, Spain, pp. 7201-7206. https://doi.org/10.3850/IAHR-39WC2521711920221540
[59] Taylor, R.G., Scanlon, B., Döll, P., et al. (2013). Ground water and climate change. Nature Climate Change, 3(4): 322-329. https://doi.org/10.1038/nclimate1744
[60] Chengot, R., Zylberman, R., Momblanch, A., Salazar, O.V., Hess, T., Knox, J.W., Rey, D. (2024). Evaluating the impacts of agricultural development and climate change on the water-energy nexus in Santa Elena (Ecuador). Environmental Science & Policy, 152: 103656. https://doi.org/10.1016/j.envsci.2023.103656
[61] Mouhoumed, R.M., Ekmekcioğlu, Ö., Özger, M. (2024). A holistic multi-tiered decision framework for evaluating rainwater harvesting potential in arid regions: A case study of the southeastern basin of Djibouti. Groundwater for Sustainable Development, 25: 101090. https://doi.org/10.1016/j.gsd.2024.101090
[62] Carrión-Mero, P., Morante-Carballo, F., Vargas-Ormaza, V., Apolo-Masache, B., Montalvo, M.J. (2021). A conceptual socio-hydrogeological model applied to sustainable water management. case study of the Valdivia river basin, southwestern Ecuador. International Journal of Sustainable Development & Planning, 16(7): 1275-1285. https://doi.org/10.18280/ijsdp.160708
[63] Pino, E., Ramos, L., Avalos, O., Tacora, P., Chávarri, E., Angulo, O., Ascensios, D., Mejía, J. (2019). Factors affecting depletion and pollution by marine intrusion in the La Yarada´ s coastal aquifer, Tacna, Peru. Tecnología y Ciencias del Agua, 10(5): 177-213. https://doi.org/10.24850/j-tyca-2019-05-07
[64] Farid, A., Khalid, P., Jadoon, K.Z., Jouini, M.S. (2014). The depositional setting of the Late Quaternary sedimentary fill in southern Bannu basin, Northwest Himalayan fold and thrust belt, Pakistan. Environmental Monitoring and Assessment, 186: 6587-6604. https://doi.org/10.1007/s10661-014-3876-5
[65] Hoogesteger, J. (2022). Regulating agricultural groundwater use in arid and semi-arid regions of the Global South: Challenges and socio-environmental impacts. Current Opinion in Environmental Science & Health, 27: 100341. https://doi.org/10.1016/j.coesh.2022.100341
[66] Barik, R., Pattanayak, S.K. (2019). Assessment of groundwater quality for irrigation of green spaces in the Rourkela city of Odisha, India. Groundwater for Sustainable Development, 8: 428-438. https://doi.org/10.1016/j.gsd.2019.01.005
[67] Alfarrah, N., Berhane, G., Bakundukize, C., Walraevens, K. (2017). Degradation of groundwater quality in coastal aquifer of Sabratah area, NW Libya. Environmental Earth Sciences, 76: 664. https://doi.org/10.1007/s12665-017-6999-5
[68] Kaandorp, V.P., Molina-Navarro, E., Andersen, H.E., Bloomfield, J.P., Kuijper, M.J., de Louw, P.G. (2018). A conceptual model for the analysis of multi-stressors in linked groundwater-surface water systems. Science of the Total Environment, 627: 880-895. https://doi.org/10.1016/j.scitotenv.2018.01.259
[69] Alshehri, F., Abd El-Hamid, H. T., Mohamed, A. (2024). Mapping coastal groundwater potential zones using remote sensing based AHP model in Al Qunfudhah region along Red Sea, Saudi Arabia. Heliyon, 10(7), e28186. https://doi.org/10.1016/j.heliyon.2024.e28186
[70] Mosaad, S., Kotb, A.D., Basheer, A.A. (2024). Groundwater potentiality mapping: A case study in Baba and Sidri watersheds, South Sinai, Egypt. Journal of African Earth Sciences, 210: 105145. https://doi.org/10.1016/j.jafrearsci.2023.105145
[71] Opoku, P.A., Shu, L., Amoako-Nimako, G.K. (2024). Assessment of groundwater potential zones by integrating hydrogeological data, geographic information systems, remote sensing, and analytical hierarchical process techniques in the Jinan Karst Spring Basin of China. Water, 16(4): 566. https://doi.org/10.3390/w16040566
[72] Gumma, M.K., Pavelic, P. (2013). Mapping of groundwater potential zones across Ghana using remote sensing, geographic information systems, and spatial modeling. Environmental Monitoring and Assessment, 185(4): 3561-3579. https://doi.org/10.1007/s10661-012-2810-y
[73] Petrick, N., Jubidi, M.F.B., Ahmad Abir, I. (2023). Groundwater potential assessment of Penang Island, Malaysia, through integration of Remote Sensing and GIS with validation by 2D ERT. Natural Resources Research, 32(2): 523-541. https://doi.org/10.1007/s11053-023-10164-w
[74] Sapkota, S., Pandey, V.P., Bhattarai, U., Panday, S., Shrestha, S.R., Maharjan, S.B. (2021). Groundwater potential assessment using an integrated AHP-driven geospatial and field exploration approach applied to a hard-rock aquifer Himalayan watershed. Journal of Hydrology: Regional Studies, 37: 100914. https://doi.org/10.1016/j.ejrh.2021.100914
[75] Jódar, J., Martos-Rosillo, S., Custodio, E., Mateos, L., Cabello, J., Casas, J., Salinas-Bonillo, M.J., Martín-Civantos, J.M., González-Ramón, A., González-Ramón, A., Zakaluk, T., Herrera-Lameli, C., Urrutia, J., Lambán, L.J. (2022). The recharge channels of the Sierra Nevada range (Spain) and the peruvian Andes as ancient nature-based solutions for the ecological transition. Water, 14(19): 3130. https://doi.org/10.3390/w14193130
[76] Olumuyiwa, F.O., Bamidele, A.M. (2019). Groundwater resource assessment by hydraulic properties determination for sustainable planning and development in central Part of Ondo State, Nigeria. Journal of Water Science & Environment Technologies, 4(2). https://doi.org/10.18280/eesrj.070101
[77] Adams, H., Messner, E., Sinicropi, P., Steinle‐Darling, E., Crespo, E. (2023). Learning from Water Reuse in Israel. Journal AWWA, 115(4): 72-75. https://doi.org/10.1002/awwa.2092