Hasanuddin![]() | Agus Arip Munawar*
| Agus Arip Munawar*![]()
© 2024 The authors. This article is published by IIETA and is licensed under the CC BY 4.0 license (http://creativecommons.org/licenses/by/4.0/).
OPEN ACCESS
The application of near infrared reflectance spectroscopy (NIRS) combined with principal component analysis (PCA) to distinguish weed species is investigated in this study. Specifically, the aim is to enhance the specificity of the study's objectives and methodologies and to highlight practical applications. The discernment of differential absorption characteristics, ultimately facilitating a nuanced understanding of each species, is enabled by the unique spectral signatures provided by NIRS, which are based on a plant’s biochemical components. Furthermore, the transformation of complex spectral data into manageable principal components, encapsulating significant plant variations, is facilitated by leveraging PCA. Optimal NIR wavelengths (1131 nm, 1422 nm, 1888 nm, and 1937 nm) corresponding to different chemical compounds, which lead to substantial improvements in weed species classification, are pinpointed in our study. The potential benefits of this methodology in weed management strategies, long-term monitoring of weed communities, and sustainable agricultural practices are underscored by our study. However, the need for further validation under varied field conditions is acknowledged to ensure the robustness and reliability of these findings. Overall, the significance of integrating NIRS and PCA is highlighted, and the necessity for further exploration of its potential in ecology and biodiversity conservation is underscored by our research.
NIRS, weed species classification, PCA, spectral analysis, biodiversity conservation
The role of weeds plants within various ecosystems is far more significant than often acknowledged and recognized. These species, frequently dismissed as nuisances, are essential contributors to biodiversity, often serving as a habitat and food source for numerous organisms [1]. Furthermore, certain weed species possess bioactive compounds potentially useful for medicinal or agricultural applications. However, unmanaged propagation of weeds can lead to depreciated crop yields and disruptions within established ecosystems, rendering precise species identification and quality assessment essential for both economic and conservation reasons [2, 3].
As with any other plant species, efficient management and utilization of weeds necessitate comprehensive understanding of their characteristics, both morphological and chemical. However, traditional methods employed for these quality assessments, while reliable, are time and resource-intensive, often requiring transportation of samples and multiple processing stages, rendering real-time analysis impractical. Additionally, these methods are generally destructive, taking a toll on the conservation of sampled species [4]. Therefore, a dire need is felt in the scientific community for a novel, non-invasive technique capable of rapid, real-time analysis, a criterion potentially met by near infrared spectroscopy [5].
In recent years, near infrared reflectance spectroscopy (NIRS) has been increasingly utilized for qualitative and quantitative analysis of plant species. As per findings from a range of studies, NIRS has shown promise as a viable tool for diverse applications, including, but not limited to, determination of plant species, assessment of nutrient composition, evaluation of soil health, and even prediction of crop yields [6, 7]. In contrast to traditional and conventional methods, NIRS offers rapid, non-destructive analysis, opening avenues for in-situ and real-time applications [8]. However, previous literature also points out limitations such as the need for extensive calibration and the sensitivity of NIRS to external parameters like sample temperature or particle size.
The NIRS has been increasingly recognized as a valuable tool for assessing various aspects of weed species. Several studies have explored and demonstrated its potential in the classification, identification, and characterization of weeds by utilizing their unique spectral signatures [9]. These previous applications of NIRS in weed assessment highlight its potential as a non-invasive, rapid, and cost-effective tool for various aspects of weed research and management. Nevertheless, further studies are still needed to refine and validate these methods across a broader range of weed species and environmental conditions.
The primary objective of this study is to evaluate the potential of NIRS technology as an approach and alternative method for rapid, non-destructive weed quality assessment, focusing on species recognition and chemical property determination. We argue that each weed species will exhibit a unique spectral pattern in the NIR wavelength region, allowing for classification based on spectral data. We further hypothesize that NIR spectra can be used for prediction of main chemical compounds within weed samples.
To test these hypotheses, we conducted an extensive analysis of various weed species using a portable sensing device (PSD) near infrared spectroscopy. We collected reflectance data in the near-infrared range from freshly harvested, intact weed samples, representing a simplification over traditional methodologies that generally require complex sample preparation stages. Following data acquisition, spectral features were identified, and multivariate statistical analyses were conducted to categorize the weed species and predict their chemical properties.
Our study distinguishes itself from previous research by focusing on the rapid, non-destructive assessment of weed quality, specifically in species recognition and chemical property determination. While previous studies have demonstrated the potential of NIRS in weed assessment, our work uniquely establishes that each weed species exhibits a distinct spectral pattern in the NIR wavelength region, enabling accurate classification based on spectral data. Moreover, we introduce the novel hypothesis that NIR spectra can be utilized to predict the main chemical compounds within weed samples. Our focus on these particular aspects of weed quality assessment marks a departure from the broader applications of NIRS seen in prior research.
Additionally, our approach simplifies the assessment process by utilizing a portable sensing device (PSD) for near infrared spectroscopy, thereby streamlining the data collection and analysis. This methodological innovation provides a foundation for rapid, non-destructive weed quality assessment, potentially revolutionizing the field and filling a critical gap in current weed research and management practices.
By explicitly stating these contributions, we establish the significance of our work and position it as a valuable and novel addition to the existing body of literature in the field of weed research.
2.1 Weed samples
A total of 76 weed samples representing various species were collected from different locations in Aceh province region during the peak growth season. The selection of weed species was based on their prevalence, ecological importance, and economic significance as common agricultural pests. Stratified random sampling was employed to ensure a representative sample set. The sampling sites were identified based on diverse ecological settings, including agricultural fields, forests, and uncultivated areas. Weed samples were collected from five distinct locations within each identified habitat to capture the potential variability in weed populations.
In each location, weed samples were collected using a randomized quadrant approach. Four quadrats measuring 1 × 1 m were placed at approximate intervals, covering the targeted habitat. All visible weed species within the quadrats were carefully identified and collected, ensuring intact representation of the aerial parts of the plants, including leaves, stems, and flowers.
To avoid cross-contamination, disposable gloves and clean cutting tools were used for each sample collection. Tools were decontaminated between samples by wiping with 70% ethanol. Each collected weed sample was assigned a unique identification number and labeled with the species name, collection location, and collection date. Upon arrival at the lab, samples were stored in a cool, dark room at approximately 4°C to preserve their physiological condition before further analysis.
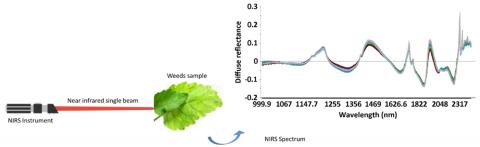
Figure 1. NIR spectral data acquisition of weed samples in the near infrared region
2.2 NIR spectral acquisition
Spectral data in the near infrared (NIR) wavelength range was acquired through by means of PSD NIRS i16 instrument equipped with a NIR sensor capable of measuring wavelengths ranging from 1000 to 2500 nm [10]. The weed samples were prepared, ensuring proper cleanliness of the sample surface to minimize any potential interference in the spectral measurements as illustrated in Figure 1. Each prepared weed sample was positioned within the field of view of the NIR instrument, consistently covering the entire measurement area. The raw spectral data obtained from the instrument for each weed sample was collected and recorded.
2.3 Spectral data analysis
The spectral data analysis of weed samples was conducted using principal component analysis (PCA) to enable classification of the weed samples. PCA, a dimensionality reduction technique, was applied to identify the underlying patterns and principal components within the high-dimensional spectral data [11]. Subsequently, it is an unsupervised classification technique, was employed to maximize the separation between different classes of weed samples using the extracted principal components. Data analysis of this presented work is summarized in Figure 2.
Figure 2. Spectral data analysis for the classification based on weed species and benefits
Principal component analysis (PCA) is a statistical method used to simplify the complexity in high-dimensional data while retaining trends and patterns. In the spectral data analysis of weed samples, PCA was used as a dimensionality reduction technique. PCA works by transforming the original variables (spectral data in this case) into a new set of variables, known as principal components. These principal components are orthogonal and capture the maximum amount of variation present in the original data.
The specific number of principal components used can vary depending on the variation explained by each component and the desired level of dimensionality reduction. In your study, the selection of the number of principal components would be based on the cumulative variance explained by these components. Typically, a common criterion is to retain enough principal components to capture a high percentage with more than 95% of the total variance in the data.
The process involves calculating the eigenvalues and eigenvectors of the covariance matrix of the original spectral data, and then ordering the eigenvalues to determine the amount of variance each principal component explains. These eigenvalues represent the amount of variance captured by each principal component.
Once the principal components are obtained, these components are used as new variables to represent the spectral data. In your case, the principal components derived from the spectral data would be used for subsequent analysis and classification of the weed samples.
The unsupervised nature of PCA allows it to identify underlying patterns and structures within the high-dimensional spectral data without relying on predetermined class labels. In your study, the principal components extracted using PCA were subsequently employed as features in an unsupervised classification technique to maximize the separation between different classes of weed samples.
This application of PCA allows for the reduction of spectral data complexity, leading to improved interpretability and understanding of the inherent patterns present in the weed samples, thereby facilitating the classification and analysis of the samples in an unsupervised manner.
The selection of quadrats was carried out in a randomized or systematic manner, ensuring that they were representative of the overall weed population and ecosystem diversity. Within each quadrat, sampling of weed species was systematically or randomly conducted, with the identification of each weed species being visually inspected and recorded. When necessary, physical specimens of the identified weed species within the quadrats were collected, encompassing leaves, stems, flowers, or any other features essential for accurate identification.
3.1 Spectra features
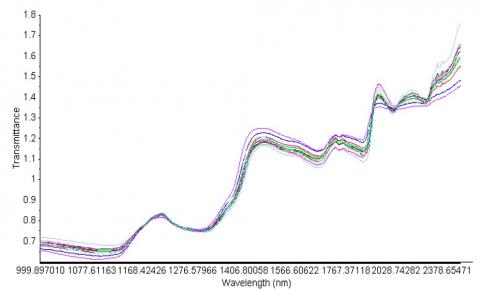
Typical spectrum of weed samples from different weed plants species is presented in Figure 3. In the near infrared spectroscopy, spectral data offers a valuable tool and method for differentiating between various species of weed plants. Each plant species has unique chemical compositions and structures, resulting in unique spectral signatures when irradiated with light in the NIR wavelength range. The spectral features of plants in the NIR spectrum range are primarily linked to chemical bonds such as O-H, N-H, and C-H present in plant biochemical component, which include water, cellulose, proteins, and other organic compounds [2, 3]. The combination of these components within a plant result in specific absorption features that are unique to that plant species.
Figure 3. Typical spectrum of weed plants in NIR region
When conducting a spectral analysis of weed plants, there are several key NIR spectral regions to consider: Overtone and combination bands related to O-H bonds at around 1450 nm and 1940 nm. These are primarily related to water content in the plant. C-H bond absorption features founded around 1720-1760 nm related to lignin and 2300-2350 nm related to cellulose content. The N-H bond absorption around 2100 nm which can provide information about protein content in the plant [4, 12].
The interpretation of these spectral features requires careful consideration. For instance, broad peaks around 1450 nm and 1940 nm may suggest high water content within the weed plants, possibly indicating a plant in its prime growth stages. Sharp, distinct peaks at wavelengths specific to certain chemical bonds could imply high concentrations of the associated chemical compound.
Analysing these spectral features collectively forms the basis of differentiating plant species. While some weeds may share similar spectral features, the relative strength and exact position of these absorption characteristics vary between species, thereby allowing for differentiation. For instance, Taraxacum officinale may exhibit different spectral features compared to Urtica dioica, reflecting differences in their chemical composition and structure. The spectral features of weed plants in the NIR provide abundant information beyond what meets the eye, enabling advanced identification and differentiation techniques [13, 14]. As such, NIR spectroscopy holds great potential in weed management, ecology, and related fields. It's worth noting that further substantial research is needed for a deeper understanding and broader applicability of NIR in weed discrimination.
The NIRS has shown promise in accurately classifying different weed species based on their spectral patterns. By analyzing the reflectance or absorption of near-infrared light by plant tissues, NIRS can identify specific molecular structures and chemical constituents. These spectral profiles can be used as reference data to build classification models, enabling rapid and non-destructive identification of weed species in the field as shown in Figure 4.
Figure 4. Classification based on NIR spectral data of weed samples using PCA method
PCA is a statistical method that transforms the original dataset into a new coordinate system. The axes of this new system, called principal components, are orthogonal and linear combinations of the original variables. Each principal component represents a certain percentage of the total variation in the dataset. In the context of plant classification, PCA could be utilized to generate a reduced set of variables that still captures most of the patterns in the plant data. These variables, or principal components, could be visualized in a scatter plot to help differentiate between plant species.
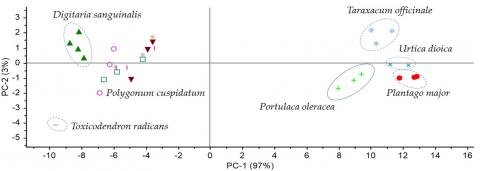
Figure 5. Weed plants distribution based on NIR spectral data in PCA mapping
In this PCA analysis, it is first critical to determine what kind of plant characteristics you have measured. This could include measurements of plant morphology like height, leaf length or width, and petal size, chemical properties such as levels of certain metabolites, nutrients, or toxins, ecological characteristics: preferred light conditions, soil pH or various other traits [15, 16]. Distribution weed samples with different species in PCA mapping is presented in Figure 5.
Once the PCA is performed and conducted, the first few principal components PC1 and PC2 represented the majority of the variation in the dataset. The total explained variance for PC1 is 97% while PC2 is 3%. This may indicate that weed plants can be distinguished by means of spectral data with the support of PCA. This also represented differences in weeds plant morphology, whereas PC2 may represent differences in plant chemical properties. Analyzing how each weed species contributes to these principal components would subsequently provide insights into differentiating characteristics.
Distinctions between certain species, like Taraxacum officinale (Dandelion) and Urtica dioica or stinging nettle, are quite significant due to their different morphological and chemical properties. These differences could fall along PC1. On the other hand, subtle differences leading to successful separation between similar species like Digitaria sanguinalis or known as crabgrass, and Polygonum cuspidatum or knotweeds might be more nuanced, perhaps requiring several more principal components to properly differentiate [14].
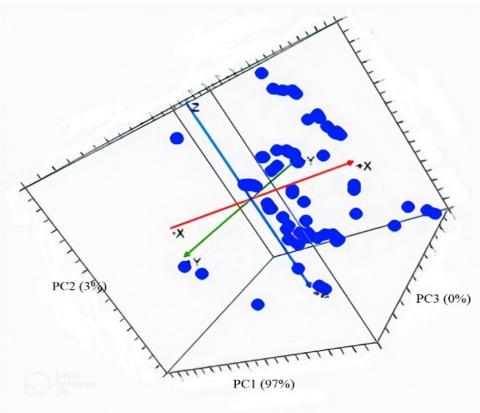
Figure 6. Relevant wavelength in NIR region to classify weeds species based on PCA method
It's important to visualize the PCA results, often through a scatter plot of the scores of the first two principal components. Each weed species can be denoted by a different color or symbol, making the clusters of similar species visually evident. Obtained optimum wavelength in the NIR region based on the PCA classification results is presented in Figure 6. The relevant wavelengths for weed classification through a loading plot from the NIR based on PCA analysis is a significant finding. The wavelengths identified, namely, 1131 nm, 1422 nm, 1888 nm, and 1937 nm, correspond to specific absorptions of chemical bonds in the plant that are essential in distinguishing one species from another.
The PCA utilized the information from the class labels to define the linear discriminant functions that can be optimally distinguished between weed species. By projecting the transformed data onto these discriminant functions, the weed samples were classified into specific classes based on their spectral characteristics [17, 18]. This integrated approach of utilizing PCA for dimensionality reduction and for classification enabled the efficient and effective discrimination of weed species based on their spectral signatures. The analysis provided valuable insights into the distinguishing features of different weed species and contributed to the development of robust classification models for future weed identification and management strategies.
The 1131 nm wavelength corresponds to the first overtone of C-H stretching vibrations, typically associated with carbohydrates and lignin. This spectral feature may provide unique insights into the structural components of the weed species [19]. Moreover, 1422 nm wavelength was generally associated with the first overtone of O-H stretching vibrations, corresponding to the water content in weed plants. Variations in this band can indicate differences in the moisture content of the weed species.
Wavelengths around 1888 nm and 1937 nm fall within the region of the second overtone of O-H stretch, generally impacted by the water in the plant tissue. These specific wavelengths are crucial because they're linked to distinct chemical compounds within the plants. Species variation in these organic compounds leads to differential absorption of NIR radiation, hence, elucidating distinguishing spectral features. As a result, these wavelengths serve as critical identifiers enabling accurate and efficient weed species classification [20].
Furthermore, these relevant and optimum wavelengths can significantly streamline the classification process, reduce computational needs, and allow the development of portable, field-ready NIR sensors calibrated specifically to these wavelengths. However, considering the inherent variability of field conditions like lighting and plant orientation, further validation under various field conditions will be pivotal in evaluating the robustness and reliability of these findings.
This finding underscores the value of NIR spectroscopy, combined with potent statistical tools like PCA, for precise and efficient weed classification and potentially myriad applications in agricultural management and biodiversity studies. The influence plot based on PCA analysis also showed that weed species which have medical benefits are categorized as cluster, whereas weed species with harmful effect influence the PCA scores and distinguished as presented in Figure 7.
Figure 7. Relevant wavelength in NIR region to classify weeds species based on PCA method
In brief, near infrared spectral data in tandem with PCA approach can be used to differentiate between different weed species based on various measured characteristics, providing a comprehensive and efficient approach to plant classification. However, the effectiveness largely depends on the type and range of data collected for each species since PCA relies on identifying patterns in the dataset.
Obtained works demonstrated efficacy in aiding weed management and control strategies. By accurately identifying different weed species, NIRS enables precise and targeted interventions, such as the selection of appropriate herbicides or the implementation of site-specific control measures. This technology contributes to optimizing the use of resources and minimizing the ecological impact of excessive herbicide applications. Some weed plants and species are benefitted for human medications, while other weeds are not, or even harmful for human like poison ivy plant from which in Greek name is Toxicodendron radicans. This weed plant is toxic and may harmful. Another weeds like knotweeds or grass species were annoyed and may interfere other plants to grows.
The identification process for each weed species was thoroughly documented, noting any diagnostic features or distinguishing characteristics used in the identification. Quality control measures, such as duplicate assessments by different researchers or experts, were implemented to verify the accuracy and reproducibility of species identification within the quadrats. The details of the identification procedure, including the specific protocols used, taxonomic references consulted, and any challenges encountered, were transparently reported, allowing for the reproducibility and validation of identification accuracy by other researchers.
Detailed information for each identified weed species, including location within the quadrat, morphological characteristics, and any unique features aiding in identification, was recorded. The accurate identification of each weed species to the finest taxonomic level possible was accomplished by employing validated taxonomic keys, botanical references, or expert consultation [21].
In terms of sustainable ecology and biodiversity, NIRS has utility in biodiversity studies by helping to identify invasive species and monitor changes in weed populations. It offers non-invasive, rapid, and repeatable data collection, making it an efficient method and alternative approach for long-term monitoring of weed communities and their interactions with other plant species.
Moreover, it can aid in assessing the impact of weeds on ecosystem processes, species diversity, and overall ecosystem health [22]. It also has been explored for discriminating between crop plants and weed species within agricultural fields. By leveraging the differences in the spectral characteristics of crops and weeds, NIRS can help distinguish between desired plants and invasive species, facilitating more efficient weed control strategies and reducing crop losses.
The implications of our findings for weed management and agricultural practices are substantial. By demonstrating the potential of near infrared reflectance spectroscopy (NIRS) combined with principal component analysis (PCA) for rapid, non-destructive weed quality assessment, our study offers a new avenue to improve weed management strategies and sustainable agricultural practices.
The application of our methodology can lead to enhanced precision in weed species identification and quality assessment, which is integral for effective weed management. Rapid and non-destructive analysis facilitated by NIRS and PCA can enable real time decision making, allowing for more targeted and efficient allocation of resources for weed control and eradication efforts. This, in turn, can result in reduced agricultural losses and improved crop yields.
Furthermore, the ability to predict main chemical compounds within weed samples based on NIR spectra has significant implications for agricultural practices. It can provide insights into the biochemical composition of weed species, potentially leading to the development of targeted herbicide treatments or precision agricultural practices. Such targeted approaches can contribute to minimizing the use of broad spectrum herbicides, reducing environmental impact, and promoting sustainable agricultural practices.
The findings from this study also hold promise for long-term monitoring of weed communities, providing a non-invasive and efficient method for assessing changes in weed populations and their chemical composition. This monitoring capability can aid in the development of adaptive weed management strategies, contributing to the overall sustainability and resilience of agricultural ecosystems.
In conclusion, our research has the potential to revolutionize weed management and agricultural practices by offering a rapid, non-destructive, and insightful tool for weed species identification and quality assessment. These implications underscore the significance of our findings in advancing agricultural sustainability and efficiency.
The effectiveness of combining near infrared reflectance spectroscopy (NIRS) and principal component analysis (PCA) for differentiating weed species was examined in this study. It was concluded that each weed species demonstrates unique spectral signatures in the NIR spectrum, driven by its distinct biochemical composition. Further analysis using PCA amplified these differences, allowing for more accurate classification. The study further uncovered optimum NIR wavelengths corresponding to different chemical components, streamlining the classification process and highlighting opportunities for the development of compact, field-ready NIR sensors.
The data presented in this study unequivocally support the realization of the study's objectives and the validation of its hypotheses. The specific spectral patterns identified and the subsequent successful classification of weed species using NIRS and PCA affirm the study's overarching goals. In essence, the study's conclusions are intrinsically linked to the presented data and directly correspond to the study's objectives and hypotheses. The successful application of NIRS and PCA for rapid, non-destructive weed quality assessment validates the initial hypotheses and offers substantive support for the study's conclusions.
However, it was underlined that the robustness of these findings needs to be validated under a variety of field conditions due to potential variability. Despite this, the study underscored the significant potential of integrating NIRS and PCA for agricultural purposes, ranging from precise weed management strategies to the conservation of biodiversity.
Overall, while the present findings are promising, the research and further studies for substantial further exploration. It emphasized the continuous need for studies to improve the understanding and applicability of NIRS in conjunction with PCA for efficient weed species differentiation and its broader impacts on agriculture and ecology.
[1] Sahu, A., Sen, S., Mishra, S.C. (2020). Processing and properties of Calotropis gigantea bio-char: A wasteland weed. Materials Today: Proceedings, 33: 5334-5340. https://doi.org/10.1016/j.matpr.2020.03.024
[2] Zhao, H.T., Feng, Y.Z., Chen, W., Jia, G.F. (2019). Application of invasive weed optimization and least square support vector machine for prediction of beef adulteration with spoiled beef based on visible near-infrared (Vis-NIR) hyperspectral imaging. Meat Science, 151: 75-81. https://doi.org/10.1016/j.meatsci.2019.01.010
[3] Liang, D., Xia, C., Huang, H., Liu, Y., Ma, Z., Li, S., Zhang, Q., Meng, Z. (2023). Weed control and slow-release behavior of 2-methyl-4-chlorophenoxyacetate intercalated layered double hydroxide. Colloids and Surfaces A: Physicochemical and Engineering Aspects, 658: 130661. https://doi.org/10.1016/j.colsurfa.2022.130661
[4] Milojković, J.V., Lopičić, Z.R., Anastopoulos, I.P., Petrović, J.T., Milićević, S.Z., Petrović, M.S., Stojanović, M.D. (2019). Performance of aquatic weed-Waste Myriophyllum spicatum immobilized in alginate beads for the removal of Pb(II). Journal of Environmental Management, 232: 97-109. https://doi.org/10.1016/j.jenvman.2018.10.075
[5] Su, W.H. (2020). Crop plant signaling for real-time plant identification in smart farm: A systematic review and new concept in artificial intelligence for automated weed control. Artificial Intelligence in Agriculture, 4: 262-271. https://doi.org/10.1016/j.aiia.2020.11.001
[6] González-Martín, I., Hernández-Hierro, J.M., Revilla, I., Vivar-Quintana, A., Ortega, I.L. (2011). The mineral composition (Ca, P, Mg, K, Na) in cheeses (cow’s, ewe’s and goat’s) with different ripening times using near infrared spectroscopy with a fibre-optic probe. Food Chemistry, 127(1): 147-152. https://doi.org/10.1016/j.foodchem.2010.12.114
[7] Sun, W., Zhang, X., Sun, X., Sun, Y., Cen, Y. (2018). Predicting nickel concentration in soil using reflectance spectroscopy associated with organic matter and clay minerals. Geoderma, 327: 25-35. https://doi.org/10.1016/j.geoderma.2018.04.019
[8] Pasquini, C. (2018). Near infrared spectroscopy: A mature analytical technique with new perspectives–A review. Analytica Chimica Acta, 1026: 8-36. https://doi.org/10.1016/j.aca.2018.04.004
[9] Munawar, A.A., Hörsten, D.V., Mörlein, D., Pawelzik, E., Wegener, J.K. (2013). Rapid and non-destructive prediction of mango sweetness and acidity using near infrared spectroscopy. Agricultural and Food Sciences.
[10] Munawar, A.A., Hizir, H., Muhammad, S., Yusmanizar, Y. (2023). Rapid detection of patchouli oil adulteration using support vector machine classification and discriminant analysis with near-infrared spectroscopy. Mathematical Modelling of Engineering Problems, 10(3): 1074-1080. https://doi.org/10.18280/mmep.100343
[11] Munawar, A.A., Sabaruddin, Z. (2021). Fast classification of rice (Oryza sativa) cultivars based on fragrance and environmental origins by means of near infrared spectroscopy. IOP Conference Series: Earth and Environmental Science, 644: 012003. https://doi.org/10.1088/1755-1315/644/1/012003
[12] Duncan, L., Miller, B., Shaw, C., Graebner, R., Moretti, M.L., Walter, C., Selker, J., Udell, C. (2022). Weed warden: A low-cost weed detection device implemented with spectral triad sensor for agricultural applications. HardwareX, 11: e00303. https://doi.org/10.1016/j.ohx.2022.e00303
[13] Devi, C., Khwairakpam, M. (2023). Weed biomass: Bioconversion through composting followed by vermicomposting to optimize time required. Bioresource Technology Reports, 21: 101326. https://doi.org/10.1016/j.biteb.2022.101326
[14] Ventura, M., Silva, J.R., Andrade, L.H., Junior, R.S., Lima, S.M. (2018). Near-near-infrared thermal lens spectroscopy to assess overtones and combination bands of sulfentrazone pesticide. Spectrochimica Acta Part A: Molecular and Biomolecular Spectroscopy, 188: 32-36. https://doi.org/10.1016/j.saa.2017.06.043.
[15] Munawar, A.A., Yunus, Y., Devianti, Satriyo, P. (2020). Calibration models database of near infrared spectroscopy to predict agricultural soil fertility properties. Data in Brief, 30: 105469. https://doi.org/10.1016/j.dib.2020.105469
[16] Chen, H., Xu, L., Ai, W., Lin, B., Feng, Q., Cai, K. (2020). Kernel functions embedded in support vector machine learning models for rapid water pollution assessment via near-infrared spectroscopy. Science of the Total Environment, 714: 136765. https://doi.org/10.1016/j.scitotenv.2020.136765
[17] Mishra, P., Verschoor, J., Nijenhuis-de Vries, M., Polder, G., Boer, M.P. (2023). Portable near-infrared spectral imaging combining deep learning and chemometrics for dry matter and soluble solids prediction in intact kiwifruit. Infrared Physics & Technology, 131: 104677. https://doi.org/10.1016/j.infrared.2023.104677
[18] Huang, X., Xia, L. (2017). Improved kernel PLS combined with wavelength variable importance for near infrared spectral analysis. Chemometrics and Intelligent Laboratory Systems, 168: 107-113. https://doi.org/10.1016/j.chemolab.2017.06.013
[19] Xing, Z., Tian, K., Du, C., Li, C., Zhou, J., Chen, Z. (2019). Agricultural soil characterization by FTIR spectroscopy at micrometer scales: Depth profiling by photoacoustic spectroscopy. Geoderma, 335: 94-103. https://doi.org/10.1016/j.geoderma.2018.08.003
[20] Yunus, Y., Devianti, Satriyo, P., Munawar, A.A. (2019). Rapid prediction of soil quality indices using near infrared spectroscopy. IOP Conference Series: Earth and Environmental Science, 365: 012043. https://doi.org/10.1088/1755-1315/365/1/012043
[21] Darusman, D., Juwita, I.R., Munawar, A.A., Zainabun, Z., Zulfahrizal, Z. (2021). Rapid determination of mixed soil and biochar properties using a shortwave near infrared spectroscopy approach. IOP Conference Series: Earth and Environmental Science, 667: 012003. https://doi.org/10.1088/1755-1315/667/1/012003
[22] Devianti, D., Sufardi, Syafriandi, S., Munawar, A.A. (2021). Environmental assessment of soil quality indices using near infrared reflectance spectroscopy. IOP Conference Series: Earth and Environmental Science, 922: 012009. https://doi.org/10.1088/1755-1315/922/1/012009