Jamilah D Jassam*![]() | Ibtihal A Mawlood
| Ibtihal A Mawlood![]() | Khamis N Sayl
| Khamis N Sayl![]()
© 2024 The authors. This article is published by IIETA and is licensed under the CC BY 4.0 license (http://creativecommons.org/licenses/by/4.0/).
OPEN ACCESS
The Water Quality Index (WQI) is an effective water test that assesses water quality, identifies contaminants, and aids in decision-making. However, it is inefficient to analyze water samples in laboratories due to high costs, time-consuming processes, and limited ability to record temporal or geographical oscillations. Recently, the use of modern technologies such as Remote Sensing (RS) data, Geographic Information Systems (GIS), and Artificial Neural Networks (ANN), in combination with survey data, has confirmed an efficient tool to generate the WQI map of the Euphrates River in Ramadi, Iraq. In the present study, the RS data, such as Landsat 8 and Landsat 9 images, and laboratory tests of samples were used to develop a database for WQI based on spectral reflectance using the radial basis neural network model. The result of this model was then manipulated within ArcGIS 10.8 using the spatial analyst model to generate a digital map of WQI. This model was evaluated using seven criteria, which are correlation coefficient (r), mean absolute error, normalized mean absolute error, lowest absolute error, maximum absolute error, and root square equation of the coefficients (RMSE). The correlation value of the WQI was 0.93, which shows remarkable prediction accuracy. Therefore, this calculation method is effective in calculating the WQI and producing precise digital maps of water quality.
artificial neural network, remote sensing, WQI, GIS
Rivers, crucial natural resources for mankind, are being polluted by uncontrolled sewage, industrial waste, and other human activities. This pollution impacts the physical, chemical, and microbiological indicators of river quality. To protect human health and preserve the original value of irreplaceable freshwater resources, spatial and temporal water quality data are needed [1]. Water quality is a combination of all relevant physical, chemical, biological, and bacteriological properties expressed in quantitative terms as suitability for human consumption. For efficient management, the prevention and control of river pollution must be as important as reliable statistics on water quality [2]. Numerous initiatives have been made to use water quality monitoring to support decision-making. A comprehensive monitoring program is essential for preserving the quality of river water because it measures the extent of pollution and controls its effects. However, evaluating quality becomes challenging when dealing with a large number of samples that have different concentrations of various attributes [3]. Therefore, safeguarding the public's health and the preservation of priceless freshwater resources is becoming very vital.
The availability of fresh water resources globally is enough based on current consumption levels, but the uneven distribution of water on Earth poses a challenge. The Euphrates River, while historically significant, has been impacted by various problems. Changes in the river, such as decreased discharge levels, have caused an increase in non-native organisms and chemical concentrations, leading to significant ecological changes [4, 5]. Sewage is a primary contributor to water quality deterioration, as it contains harmful microorganisms and toxins. Salty drainage water from agriculture, industrial waste, and improper disposal of waste from various sources further contribute to pollution [6, 7]. Water purification plants produce sterile water but release highly conductive waste back into the river. Entertainment venues also contribute to pollution by dumping waste and connecting drainage systems directly to the river. The detrimental impact of waste dumping on rivers is evident at recreational sites near the river. Despite the sufficiency of global fresh water resources, the uneven distribution and pollution from various sources pose significant threats to water quality and ecosystems, highlighting the urgent need for effective measures to protect and preserve freshwater sources like the Euphrates River.
The Water Quality Index (WQI) is a mathematical technique that simplifies large databases of water quality data into a single numerical value, providing managers with a reliable indicator of water quality [8-11]. Conventional laboratory testing methods for calculating WQI are time-consuming and costly, while remote sensing (RS) offers a viable substitute to expand current water survey datasets. Moreover, this data is easy to analyze and can be used in environmental impact evaluations [12-14]. In a geographical context, RS can be applied to complement WQI by using several different electromagnetic spectrum bands in the forecast of water quality parameters.
Over the past few decades, the application of remote sensing techniques has become vital in resolving global climate change-related issues as well as the continuous degradation of aquatic ecosystems. The demand for clean water is rising along with the population, but this growth is being restricted by pollution from point and non-point overland drainage that threatens fish and other species [15]. The advent of sophisticated sensor technology makes it possible to quickly and simultaneously monitor changes in land cover across large areas [16, 17]. The availability of remote sensing data and the use of GIS capabilities provide new tools for large-area in data-limited regions of the world [18-20]. Techniques for remote sensing are widely used to assess the quality of water [15, 21-30]. Many publications describe how different satellite sensors are used to check the quality of the water [21, 24, 31-37]. It is essential to comprehend the spectrum properties of contaminants and water to monitor and evaluate the quality of the water. The hydrological, biological, and chemical properties of water, as well as other influencing elements, provide the spectrum characteristics that are displayed in the signal obtained from water [23, 29, 38, 39].
It is challenging to anticipate the characteristics of water quality employing physical theoretical approaches due to the variable reflectance spectrum. The phenomenon of water reflection is complicated [40]. Thus, especially across large areas, it is vital to design a system that can reveal the complex relationships between reflectance and water quality. Artificial neural networks (ANNs) are advantageous in water quality index applications for various reasons. They can capture complex relationships between water quality parameters, enhancing prediction accuracy [41, 42]. ANNs are adaptable to evolving conditions, integrate data from multiple sources for comprehensive evaluations, and handle missing data effectively. Their use in WQI applications results in more robust and accurate water quality assessments, supporting informed decision-making in water resource management.
This work demonstrates a methodology to determine the WQI, which integrates RS, Geographic Information Systems (GIS), and ANNs. Artificial Intelligence (AI) is applied to enhance the digital mapping of WQI, while the GIS integration provides comprehensive coverage of the entire region. This methodology proves its effectiveness in large-scale contexts where data may be bounded. Hence, this method was applied to the Euphrates River in Ramadi City, located in the Anbar Governorate of Iraq.
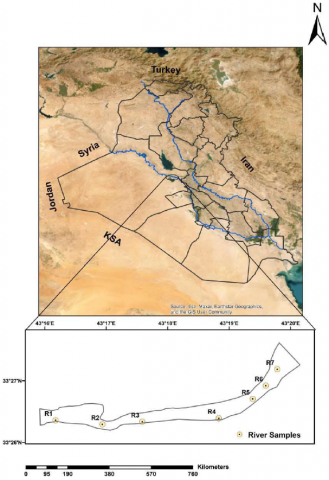
The longest river in the Middle East, the Euphrates, rises in Turkey's eastern highlands and is tucked between Lake Van and the Black Sea. Roughly 25% of the river's course passes through Syria, and the remaining 40% passes through Turkey. As it meanders down the river, Iraq and Syria split the remaining 35 percent [43, 44]. The Euphrates River is a key fresh water source connecting Turkey, Syria, and Iraq. It supports agriculture, industry, fishing, transportation, and electricity generation in Iraq. The river is crucial for wildlife and plants, attracting diverse species to the region, making it environmentally significant. It is a major electricity generator in Iraq." The river can't go as far as it can, though, because to fluctuations in the natural water flow. Unfortunately, the basin's irrigation demands are not sufficiently met by the allocation of available water [45, 46]. Iraq's largest river, the Euphrates, has an entrance point and basin in the western part of the nation. It travels through the Mesopotamian alluvial plain in the Al-Anbar area for around 337 kilometers. The main study has been implemented on the Euphrates River in Al-Ramadi city within Al-Anbar province, western Iraq. between Longitude 43°16'11.9″ to 43°19'47.0″ E; Latitude 33°26′24.5″ to 33°27′11.2″ N as shown in Figure 1. Ramadi city sits on the Euphrates River about 110 kilometers west of Baghdad, has a historic urban layout with markets, mosques, and homes. Economy thrives on trade, agriculture, and services due to its strategic location. Land use includes residential, commercial, agricultural, and institutional zones with basic infrastructure [47-49]. This region has hot, dry summers and chilly winters, with a climate that is classified as dry to semi-arid. The lowest level of temperature was recorded during January (2.5℃), whereas the highest level was recorded during July (42℃). The amount of precipitation diverges between (50–200) mm annually. The Euphrates River in Iraq is affected by extreme temperatures, low rainfall, and high evaporation rates, leading to increased water loss. Overall, the climate's impact on evaporation and water loss significantly affects the water quality in the study area [50, 51].
During the typical year, the river attains its maximum flow in the winter months of April and May [52]. The normal low-water season, which runs from July to December, is in August and September. It reaches its lowest point in August and September when the water is heavily used to irrigate the region's winter crops. The Euphrates monthly hydrograph shows seasonal variations that range from 33 to 275 percent of the yearly average [53-55].
Figure 1. Study area
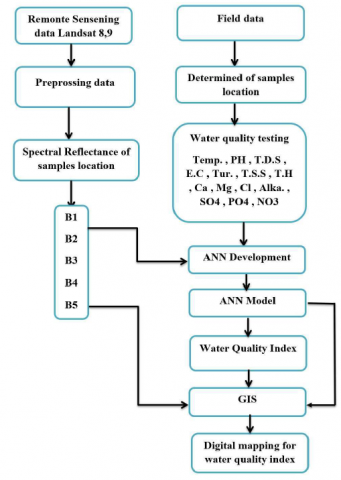
We use a technique that includes many steps of data preparation, gathering, and modeling in order to meet the study’s goal. Figure 2 provides an illustration of these stages. The following is an outline of the methodology:
First step: Involved gathering satellite images of the study area from Landsat 8 and Landsat 9, spanning from October 2022 to June 2023.
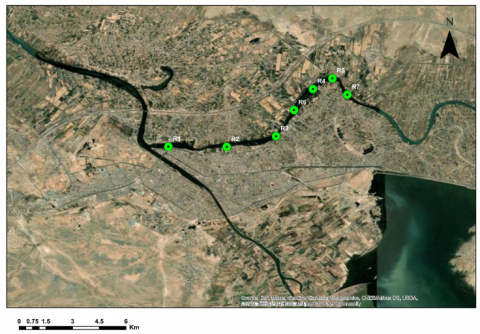
Second step: During the water sampling process, we chose seven sample locations (three sample locations represent clear water while four locations were chosen based on polluted sources identified through field surveys). Figure 3 shows the sample location. These sources represented sewage is a primary contributor to water quality deterioration and salty drainage water from agriculture, industrial waste, and improper disposal of waste from various sources further contribute to pollution. We collected 105 samples period from October 2022 to June 2023, which were taken at the same time as the satellite images, and conducted laboratory tests using water analysis to assess water contamination, as shown in Table 1.
Figure 2. Flowchart of the proposed methodology
Figure 3. Euphrates River basin and the sample locations
Table 1. Water parameters, test methods, and standards used
|
Parameter |
Symbol |
Teste Methods |
Water Quality Conservation Law of Rivers and Public Waters (Law Iraqi No. 25/1967) |
|
pH |
pH |
PH meter |
8.5 |
|
Temperature |
Temp. |
Thermometer |
25℃ |
|
Total dissolved solids |
T.D.S |
TDS meter |
|
|
Electrical Conductivity |
E.C |
Conductivity meter |
|
|
Turbidity |
Tur. |
Nephelometric |
10 NTU |
|
Total suspended solids |
T.S.S |
Drying Method 2540 D |
25 mg/l |
|
Hardness |
T.H |
EDTA Titrimetric |
300 mg/l |
|
Calcium |
Ca |
Flame photometric |
75 mg/l |
|
Magnesium |
Mg |
Calculation method |
30 mg/l |
|
Chloride |
Cl |
Argentometric |
250 mg/l |
|
Alkalinity |
Alka. |
EDTA Titrimetric |
200 mg/l |
|
Sulphate |
SO4 |
UV Spectrophotometer |
200 mg/l |
|
Phosphorus |
PO4 |
UV Spectrophotometer |
0.4 mg/l |
|
Nitrate |
NO3 |
UV Spectrophotometer |
50 mg/l |
* Depended on Iraqi drinking water quality specifications standard IQS/417, 2001. Because the river is a source of drinking water.
While assessing the quality of water, one must consider its intended uses, natural circumstances, and human impact while analyzing its physical, chemical, and biological characteristics. In this work, we have developed the WQI that allows us to evaluate the quality of water for various public uses, such as recreational and drinking water supplies. Additionally, the WQI helps assess how well water quality management initiatives are working. We can explain the current state of the water quality, better comprehend it overall, and demonstrate the efficacy of preventive actions with the use of the WQI. For the reasons you indicated, we would want to create a river index or water quality index.
The study area was chosen based on water pollution. Four sample locations were selected to represent clear water (R2, R5, R6, R7), while three locations were chosen based on polluted sources identified through field surveys (R1, R3, R4), as shown in Figure 3.
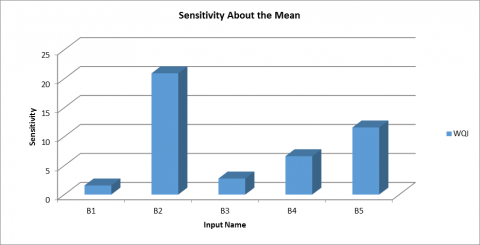
We performed a sensitivity analysis as part of our investigation to look at the connection between reflectance and the WQI. The visual representation of the WQI's sensitivity to various bands is provided in Figure 4. As can be seen from Figure 4, band 1 (0.45–0.52 µm) has no effect on the WQI. In contrast, band 2 (0.52-0.60 µm) has the highest WQI sensitivity. In terms of sensitivity, bands 4 (0.76-0.90 µm) and 5 (1.55-1.75 µm) are closely followed, whereas band 3 (0.63-0.69 µm) has little effect. The bands and the spectral reflectance of the WQI have a complex connection in which each band has a distinct function of changing significance.
The reflectance variance across the bands can be a good starting point for creating an extremely accurate model to estimate the WQI. Consequently, it is imperative that the Artificial Neural Network (ANN) model incorporate all of the bands.
Figure 4. WQI sensitivity with bands reflectance
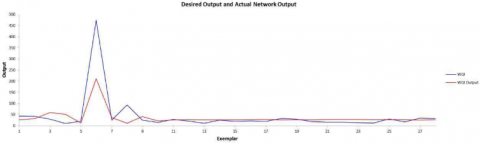
The actual and anticipated values of the ANN model are shown in Figure 5. The WQI for the research region is shown in this figure. It also shows that there is a greater degree of accuracy between the estimated and real WQI values. A mathematical model using bands as inputs and the water quality index as the output was developed after taking 28 points for the estimated values.
Figure 5. Estimated and actual values of WQI of tested samples
To evaluate the performance of the Artificial Neural Network (ANN) model in estimating the Water Quality Index (WQI), seven criteria were considered: RMSE, NRMSE, MAE, NMAE, minimum absolute error, maximum absolute error, and the correlation coefficient (r). The results revealed that the correlation coefficient for WQI, as shown in Table 2, is the highest at 0.93.
Table 2. Performance criteria of Neural network model for WQI
|
Performance |
WQI |
|
RMSE |
53.65671766 |
|
NRMSE |
0.242244315 |
|
MAE |
22.49976681 |
|
NMAE |
0.101579836 |
|
Min Abs Error |
1.28693089 |
|
Max Abs Error |
262.3010894 |
|
r |
0.933806536 |
|
Score |
90.19598885 |
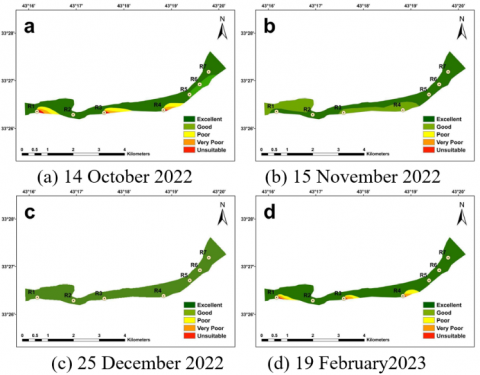
As mentioned before, the main goal of this paper is to create a map that shows the WQI for the Euphrates River. To predict the WQI, we used the spectral reflectance data from 120 different points in various locations using the ANN model. These data were processed within a GIS using a spatial analysis model, resulting in a digital map of the WQI. As shown in Figure 6, the distribution of the WQI for the Euphrates River in Ramadi city, located in the Anbar Governorate of Iraq. Four periods were taken with different dates as shown in Figure 6. These periods were taken depending on the weather condition. The weather in the summer was hot and dry. It leads to an increase in the salt concentration of the river water with an increase in evaporation, and therefore pollutants are concentrated as a result of the slowdown in the movement of the river. However, in the winter, the condition of the river was good, especially during the period of rainfall, as the river level rose, the rate of evaporation decreased, and its movement increased, which led to a reduction of pollutants, and the quantities of rainfall reduces the salinity of the river.
Figure 6. GIS plot for four periods of the water quality index
The WQI is monitored, detected, and mapped in large part because to remote sensing. It offers recurring, economical, quick, and timely data. Our goal in this work was to use the correlation between WQI and spectral reflectance to predict the WQI. The WQI facilitates rapid decision-making in resource planning and water management by acting as a platform for a variety of modeling and applications. In order to produce the WQI in this study, we integrated the use of GIS, Remote Sensing data, and ANN. We looked at the difference between the actual and anticipated numbers to assess the efficacy of this technique. This study revealed that the band 2 (0.52-0.60 µm) has the highest WQI sensitivity. Also, this study show that the actual and anticipated values of the ANN model is a greater degree of accuracy between the estimated and real WQI values. This study monitors water quality data in real time by combining a number of physical and chemical characteristics. This study finds that, in comparison to conventional approaches, the neural network methodology exhibits a significant improvement with respect to the tested values. This work focuses on the weight value calculation and training backpropagation technique. According to the Root Mean Square Error (RMSE) and correlation coefficient (r), the prediction of WQI produces higher estimate performance. With r = 0.93, the water quality index exhibits a high association. This study concluded that the strengths of the integrated approach using GIS, remote sensing data, and ANN can offer recurring, economical, quick, and timely monitoring, detecting, and mapping for large parts.
The authors may express their appreciation to the University of Anbar for academic advice.
[1] Mishra, A., Mukherjee, A., Tripathi, B.D. (2009). Seasonal and temporal variations in physico-chemical and bacteriological characteristics of River Ganga in Varanasi. https://www.sid.ir/paper/300742/fa.
[2] Koklu, R., Sengorur, B., Topal, B. (2010). Water quality assessment using multivariate statistical methods—A case study: Melen River System (Turkey). Water Resources Management, 24: 959-978. https://doi.org/10.1007/s11269-009-9481-7
[3] Almeida, C.A., Quintar, S., González, P., Mallea, M.A. (2007). Influence of urbanization and tourist activities on the water quality of the Potrero de los Funes River (San Luis–Argentina). Environmental Monitoring and Assessment, 133: 459-465. https://doi.org/10.1007/s10661-006-9600-3
[4] Jaafar, Q.N., Sayl, K.N., Kamel, A.H. (2023). Modeling the effects of river training works on the hydraulic properties of euphrates river cross-sections using HEC-RAS. International Journal of Design & Nature and Ecodynamics, 18(6): 1355-1362. https://doi.org/10.18280/ijdne.180608
[5] Jaafar, Q.N., Sayl, K.N., Kamel, A.H. (2023). Numerical modelling of river training work: A review. IOP Conference Series: Earth and Environmental Science, 1222(1): 012010. https://doi.org/10.1088/1755-1315/1222/1/012010
[6] Mitab, B.T., Hamdoon, R.M., Sayl, K.N. (2023). Assessing potential landfill sites using GIS and remote sensing techniques: A case study in Kirkuk, Iraq. International Journal of Design & Nature and Ecodynamics, 18(3): 643-652. https://doi.org/10.18280/ijdne.180316
[7] Jabar, B.S., Sayl, K.N., Alboresha, R. (2023). Incorporating a GIS-based approach and SWAT model to estimate sediment in the western desert of Iraq. International Journal of Design & Nature and Ecodynamics, 18(4): 791-800. https://doi.org/10.18280/ijdne.180405
[8] Khan, F., Husain, T., Lumb, A. (2003). Water quality evaluation and trend analysis in selected watersheds of the Atlantic region of Canada. Environmental Monitoring and Assessment, 88: 221-248. https://doi.org/10.1023/A:1025573108513
[9] Bordalo, A.A., Teixeira, R., Wiebe, W.J. (2006). A water quality index applied to an international shared river basin: The case of the Douro River. Environmental Management, 38: 910-920. https://doi.org/10.1007/s00267-004-0037-6
[10] Atulegwu, P.U., Njoku, J.D. (2004). The impact of biocides on the water quality. International Research Journal of Science and Technology, 1(2): 47-52.
[11] Cude, C.G. (2001). Oregon water quality index a tool for evaluating water quality management effectiveness1. Journal of the American Water Resources Association, 37(1): 125-137. https://doi.org/10.1111/j.1752-1688.2001.tb05480.x
[12] Mamdooh, A.D., Aljanabi, K.R., Sayl, K.N. (2024). Using GIS tools for the prediction of CBR and Su values for Ramadi city’s soils. In AIP Conference Proceedings, 3009(1): 030061. https://doi.org/10.1063/5.0190544
[13] Mohammed, O.A., Sayl, K.N. (2020). Determination of Groundwater potential zone in arid and semi-arid regions: A review. In 2020 13th International Conference on Developments in eSystems Engineering (DeSE), Liverpool, United Kingdom, pp. 76-81. https://doi.org/10.1109/DeSE51703.2020.9450782
[14] Sameer, Y.M., Abed, A.N., Sayl, K.N. (2023). Geomatics-based approach for highway route selection. Applied Geomatics, 15(1): 161-176. https://doi.org/10.1007/s12518-023-00495-x
[15] Pozdnyakov, D., Shuchman, R., Korosov, A., Hatt, C. (2005). Operational algorithm for the retrieval of water quality in the Great Lakes. Remote Sensing of Environment, 97(3): 352-370. https://doi.org/10.1016/j.rse.2005.04.018
[16] Wen, X., Yang, X. (2009). Change detection from remote sensing imageries using spectral change vector analysis. In 2009 Asia-Pacific Conference on Information Processing, Shenzhen, China, 2: 189-192. https://doi.org/10.1109/APCIP.2009.183
[17] Wen, X., Yang, X. (2009). A new change detection method for two remote sensing images based on spectral matching. In 2009 International Conference on Industrial Mechatronics and Automation, Chengdu, pp. 89-92. https://doi.org/10.1109/ICIMA.2009.5156567
[18] Sattar, B., Sayl, K., Rashid, R. (2024). Modeling of spatially distributed sedimentation in Houran dam H-3. In AIP Conference Proceedings, Iraq, 3009(1): 030125. https://doi.org/10.1063/5.0190480
[19] Mohammed, S.S., Sayl, K.N., Kamel, A.H. (2024). Modeling of spatially distributed soil moisture in the Iraqi Western Desert. In AIP Conference Proceedings, 3009(1): 030058. https://doi.org/10.1063/5.0190545
[20] Mohammed, S.S., Sayl, K.N., Kamel, A.H. (2023). Ground water recharging methods: Review study. In AIP Conference Proceedings, 2787(1): 060016. https://doi.org/10.1063/5.0149894
[21] Alparslan, E., Aydöner, C., Tufekci, V., Tüfekci, H. (2007). Water quality assessment at Ömerli Dam using remote sensing techniques. Environmental Monitoring and Assessment, 135(1): 391-398. https://doi.org/10.1007/s10661-007-9658-6
[22] Brando, V.E., Dekker, A.G. (2003). Satellite hyperspectral remote sensing for estimating estuarine and coastal water quality. IEEE Transactions on Geoscience and Remote Sensing, 41(6): 1378-1387. https://doi.org/10.1109/TGRS.2003.812907
[23] Chen, Q., Zhang, Y., Hallikainen, M. (2007). Water quality monitoring using remote sensing in support of the EU water framework directive (WFD): A case study in the Gulf of Finland. Environmental Monitoring and Assessment, 124: 157-166. https://doi.org/10.1007/s10661-006-9215-8
[24] Giardino, C., Brando, V.E., Dekker, A.G., Strömbeck, N., Candiani, G. (2007). Assessment of water quality in Lake Garda (Italy) using Hyperion. Remote Sensing of Environment, 109(2): 183-195. https://doi.org/10.1016/j.rse.2006.12.017
[25] Hadjimitsis, D.G., Clayton, C. (2009). Assessment of temporal variations of water quality in inland water bodies using atmospheric corrected satellite remotely sensed image data. Environmental Monitoring and Assessment, 159: 281-292. https://doi.org/10.1016/j.rse.2006.12.017
[26] Kondratyev, K.Y., Pozdnyakov, D.V., Pettersson, L.H. (1998). Water quality remote sensing in the visible spectrum. International Journal of Remote Sensing, 19(5): 957-979. https://doi.org/10.1080/014311698215810
[27] Koponen, S., Pulliainen, J., Kallio, K., Hallikainen, M. (2002). Lake water quality classification with airborne hyperspectral spectrometer and simulated MERIS data. Remote Sensing of Environment, 79(1): 51-59. https://doi.org/10.1016/S0034-4257(01)00238-3
[28] Ritchie, J.C., Zimba, P.V., Everitt, J.H. (2003). Remote sensing techniques to assess water quality. Photogrammetric Engineering & Remote Sensing, 69(6): 695-704. https://doi.org/10.14358/PERS.69.6.695
[29] Seyhan, E., Dekker, A. (1986). Application of remote sensing techniques for water quality monitoring. Hydrobiological Bulletin, 20: 41-50. https://doi.org/10.1007/BF02291149
[30] Wang, X.J., Ma, T. (2001). Application of remote sensing techniques in monitoring and assessing the water quality of Taihu Lake. Bulletin of Environmental Contamination and Toxicology, 67: 863-870. https://doi.org/10.1007/s001280202
[31] Maillard, P., Santos, N.A.P. (2008). A spatial-statistical approach for modeling the effect of non-point source pollution on different water quality parameters in the Velhas river watershed–Brazil. Journal of Environmental Management, 86(1): 158-170. https://doi.org/10.1016/j.jenvman.2006.12.009
[32] He, W., Chen, S., Liu, X., Chen, J. (2008). Water quality monitoring in a slightly-polluted inland water body through remote sensing—Case study of the Guanting Reservoir in Beijing, China. Frontiers of Environmental Science & Engineering in China, 2: 163-171. https://doi.org/10.1007/s11783-008-0027-7
[33] Verma, V.K., Setia, R.K., Sharma, P.K., Singh, H. (2008). Geoinformatics as a tool for the assessment of the impact of ground water quality for irrigation on soil health. Journal of the Indian Society of Remote Sensing, 36(3): 273-281. https://doi.org/10.1007/s12524-008-0028-9
[34] Zhang, Y., Pulliainen, J.T., Koponen, S.S., Hallikainen, M.T. (2003). Water quality retrievals from combined Landsat TM data and ERS-2 SAR data in the Gulf of Finland. IEEE Transactions on Geoscience and Remote Sensing, 41(3): 622-629. https://doi.org/10.1109/TGRS.2003.808906
[35] Martinez, J.M., Guyot, J.L., Cochonneau, G., Seyler, F. (2007). Surface water quality monitoring in large rivers with MODIS data application to the amazon basin. In 2007 IEEE International Geoscience and Remote Sensing Symposium, Barcelona, Spain, pp. 4566-4569. https://doi.org/10.1109/IGARSS.2007.4423873
[36] Boken, V.K. (2007). Linking landuse and groundwater quality in the Mississippi delta Using MODIS satellite data. In 2007 IEEE International Geoscience and Remote Sensing Symposium, Barcelona, Spain, pp. 5025-5027. https://doi.org/10.1109/IGARSS.2007.4423990
[37] Wang, Y., Xia, H., Fu, J., Sheng, G. (2004). Water quality change in reservoirs of Shenzhen, China: Detection using LANDSAT/TM data. Science of the Total Environment, 328(1-3): 195-206. https://doi.org/10.1016/j.scitotenv.2004.02.020
[38] Sayl, K.N., Sulaiman, S.O., Kamel, A.H., Al-Ansari, N. (2022). Towards the generation of a spatial hydrological soil group map based on the radial basis network model and spectral reflectance band recognition. International Journal of Design & Nature and Ecodynamics, 17(5): 761-766. https://doi.org/10.18280/ijdne.170514
[39] Mohammed, S.S., Sayl, K.N., Kamel, A.H. (2022). Ground water recharge mapping in Iraqi Western desert. International Journal of Design & Nature and Ecodynamics, 17(6): 913-920. https://doi.org/10.18280/ijdne.170612
[40] Clark, R.N., Roush, T.L. (1984). Reflectance spectroscopy: Quantitative analysis techniques for remote sensing applications. Journal of Geophysical Research: Solid Earth, 89(B7): 6329-6340. https://doi.org/10.1029/JB089iB07p06329
[41] Allawi, M.F., Abdulhameed, U.H., Adham, A., Sayl, K.N., Sulaiman, S.O., Ramal, M.M., El-Shafie, A. (2023). Monthly rainfall forecasting modelling based on advanced machine learning methods: Tropical region as case study. Engineering Applications of Computational Fluid Mechanics, 17(1): 2243090. https://doi.org/10.1080/19942060.2023.2243090
[42] Allawi, M.F., Sulaiman, S.O., Sayl, K.N., Sherif, M., El-Shafie, A. (2023). Suspended sediment load prediction modelling based on artificial intelligence methods: The tropical region as a case study. Heliyon, 9(8): e18506. https://doi.org/10.1016/j.heliyon.2023.e18506
[43] Mustafa, A.S., Sulaiman, S.O., Al_Alwani, K.M. (2017). Application of HEC-RAS model to predict sediment transport for Euphrates River from Haditha to Heet 2016. Al-Nahrain Journal for Engineering Sciences, 20(3): 570-577.
[44] Noon, A.M., Ahmed, H.G., Sulaiman, S.O. (2021). Assessment of water demand in Al-Anbar province-Iraq. Environment and Ecology Research, 9(2): 64-75. https://doi.org/10.13189/eer.2021.090203
[45] Najm, A.B.A., Abdulhameed, I.M., Sulaiman, S.O. (2020). Water requirements of crops under various Kc coefficient approaches by using water evaluation and planning (WEAP). International Journal of Design & Nature and Ecodynamics, 15(5): 739-748. https://doi.org/10.18280/ijdne.150516
[46] Sulaiman, S.O., Al-Dulaimi, G., Al Thamiry, H. (2018). Natural rivers longitudinal dispersion coefficient simulation using hybrid soft computing model. In 2018 11th International Conference on Developments in eSystems Engineering (DeSE), Cambridge, UK, pp. 280-283. https://doi.org/10.1109/DeSE.2018.00056
[47] Mohammed, O.A., Sayl, K.N., Sulaiman, S.O., Mahmood, N.S., Allawi, M.F., Al-Ansari, N. (2023). Geoinformatics-based approach for aquifer recharge zone identification in the western desert of Iraq. GEOMATE Journal, 25(110): 220-234.
[48] Jabar, B.S., Sayl, K.N., Rashid, R.S. (2023). Approaches to modeling soil erosion caused by water: A review. In AIP Conference Proceedings, 2775(1): 040001. https://doi.org/10.1063/5.0140870
[49] Hashim, H.Q., Sayl, K.N. (2022). Incorporating GIS Technique and SCS-CN approach for runoff estimation in the ungauged watershed: A case study west desert of Iraq. Iraqi Journal of Civil Engineering, 14(2): 1-6.
[50] Assaf, A.T., Sayl, K. (2024). Sustainability of water storage in Horan 2 dam. In AIP Conference Proceedings, 3009(1): 030065. https://doi.org/10.1063/5.0193203
[51] Sameer, Y.M., Abed, A.N., Sayl, K.N. (2021). Highway route selection using GIS and analytical hierarchy process case study Ramadi Heet rural highway. Journal of Physics: Conference Series, 1973(1): 012060. https://doi.org/10.1088/1742-6596/1973/1/012060
[52] Mustafa, A.S., Sulaiman, S.O., Hussein, O.M. (2016). Application of swat model for sediment loads from valleys transmitted to Haditha reservoir. Journal of Engineering, 22(1): 184-197.
[53] Ministries, I. (2006). New Eden master plan for the integrated water resources management in the Marshland area, Main Report, Iraqi Ministries of Environment. Water Resources Municipalities and Public Works with cooperation of the Italian Ministry for the Environment and Territory and Free Iraq Foundation, 20.
[54] Broomhead, D., Lowe, D. (1988). Multivariable functional interpolation and adaptive networks. Complex Systems, 2.
[55] Moody, J., Darken, C.J. (1989). Fast learning in networks of locally-tuned processing units. Neural Computation, 1(2): 281-294. https://doi.org/10.1162/neco.1989.1.2.281