Susilowati*![]() | Dyah Indriana Kusumastuti
| Dyah Indriana Kusumastuti![]()
© 2024 The authors. This article is published by IIETA and is licensed under the CC BY 4.0 license (http://creativecommons.org/licenses/by/4.0/).
OPEN ACCESS
Climate change due to weather anomalies causes rainfall and frequency to be more intense than normal conditions, including on the island of Sumatera, Indonesia. This has the potential to cause hydrometeorological disasters, such as floods and landslides. The intensity duration frequency (IDF) is an approach of rainfall amounts in water resources engineering for planning, designing, and operating water resources projects. Therefore, this article aims to conduct a rainfall intensity mapping study for specific return periods using the intensity duration frequency (IDF) approach, a case study of Sumatera Island, Indonesia, with the period of historical rainfall between 2013 and 2022. The purpose of the study is to provide essential reference information to mitigate hydrometeorological disasters to avoid the accumulation of rainwater in disaster-prone areas. The method used is a quantitative study using historical rainfall data from 48 rainfall recording stations in the Sumatera Island area. The results of this study show that the average maximum daily rainfall at nine stations is in the normal category, 39 rain gauge stations are in the standard medium rainfall category, and the rest are in the high category. Maps for each of these conditions are attached as the main results of this study. The practical application of this research has generated disaster vulnerability maps using IDF approaches for Sumatera Island (Indonesia) based on rainfall, emphasizing decreasing and aware activity in these areas.
frequency duration intensity, hydrometeorological disasters, Mononobe, mapping, rainfall
Climate change is a global phenomenon that has ushered in a new era of weather extremes that significantly affects various regions around the world. One of the consequences of climate change is the increase in intensity and frequency of rainfall, which can lead to a variety of hydrometeorological disasters, such as floods and landslides [1-3]. The island of Sumatera, located in Indonesia, is no exception to these changing weather patterns, experiencing increased rainfall events that have the potential to disrupt lives and livelihoods. Recognizing the urgent need to understand and manage this increasing challenge, this research endeavors to conduct a comprehensive study of rainfall intensity mapping for specific return periods on Sumatera Island, Indonesia, using the intensity duration frequency (IDF) approach.
Sumatera, the sixth largest island in the world, is known for its rich biodiversity and unique ecosystems, but is also highly vulnerable to the impacts of climate change. Understanding the changing patterns of rainfall in this region is crucial to effective disaster mitigation and preparedness [4-6]. The IDF approach is a well-established methodology in hydrology and climatology, providing valuable information on the relationship between rainfall intensity, duration, and frequency [7-9]. By applying this approach to Sumatera, our objective is to provide essential reference information that can guide policymakers, urban planners and disaster management agencies in minimizing the accumulation of rainwater in disaster-prone areas.
Historical rainfall data recording stations scattered throughout Sumatera Island are essential in studies to know the effects of the past on the future . These stations have been strategically placed to capture a comprehensive view of the island's diverse climate and topography. Through rigorous analysis and modeling, our objective is to unravel patterns and trends in rainfall intensity for specific return periods. The results of this study will not only contribute to our understanding of the changing climate in Sumatera, but will also aid in the formulation of targeted strategies to mitigate the risks associated with hydrometeorological disasters.
The significance of this research lies in its potential to enhance our ability to predict and manage extreme rainfall events on Sumatera Island. By identifying areas with high intensity rainfall and specific return periods, we can take proactive measures to protect communities and infrastructure. Additionally, the insights gained from this study will support the development of localized adaptation strategies that can mitigate the adverse effects of climate change in the region. Ultimately, this research aims to bridge the gap between scientific knowledge and practical solutions, empowering decision-makers to make informed decisions in the face of evolving climate challenges.
The remainder of this paper is organized as follows. Section 1 provides an overview of the introduction. Section 2 outlines the methodology used in this study. Section 3 discusses the implications of the findings and their potential applications in disaster management. Finally, Section 4 concludes the article by summarizing the main objectives and results of the research, highlighting the importance of this work in addressing the growing concerns related to rainfall intensity in Sumatera, Indonesia.
Rain measurement is carried out by collecting rain that falls at several predetermined points using a rain gauge. Measurable rain represents the area around it, which is expressed by the depth of the rain. The rain data used in this investigation are secondary data or online data in the form of maximum daily rainfall data originating from the Meteorological, Climatology and Geophysics Agency, collected from 48 rain gauge stations spread across ten provinces on the island of Sumatera. The length of the research observations is limited to daily rainfall data from 2013 to 2022. The names and distribution of the rain stations in each province can be seen in Figure 1.
Figure 1. Map of the distribution of rainfall climatology stations on Sumatera island
2.1 Testing of rain constance data
Changes in the location of rain stations or measurement procedures can significantly influence the amount of rain measured, which can cause errors in the form of data inconsistencies. Consistency testing means testing the accuracy of field data that are not affected by errors during delivery or measurement.
The consistency test using RAPS (rescaled adjusted partial sums) is a test for individual stations (stand-alone stations) [13-15]. This consistency test tests inconsistencies between data within the station by detecting shifts in the average value (mean). The test is carried out on the cumulative deviation from the average value, as stated in Eqs. (1)-(4).
Sk*0=0 (1)
$S k^*=\sum_{i+1}^k(Y i-Y r)$ (2)
$S k^{* *}=\frac{S k^*}{d y}$ (3)
$D_{y^2}=\sum_{i=1}^n \frac{(Y i-Y r)^2}{n}$ (4)
where, Yi is rainfall data, Yr is average rainfall, Dy is average deviation, n is the amount of data, and k is 1, 2, 3, …, n.
For homogeneous or homogeneous data, the Sk* value will range close to zero. RAPS is obtained by dividing Sk* by the standard deviation value Dy. The test uses data from the station itself, namely testing with the cumulative deviation of the average value divided by the cumulative root of the mean squared deviation of the average value. This can be seen more clearly in the formula for the statistical values of Qy and Ry.
$Q y=Maks\left|S k^{* *}\right|, 0 \leq \mathrm{k} \leq \mathrm{n}$ (5)
$R y=Maks \,\, S k^{* *}-Min \,\, S k^{* *}, 0 \leq \mathrm{k} \leq \mathrm{n}$ (6)
where, Sk*0 is the initial deviation, Sk* is the absolute deviation, Sk** is the consistency value of the data, Q is the statistical value of Q for 0≤k≤n, n is the amount of data, and R is the statistical value (range).
You can find the Qy/n (statistical value of Q per total data) and Ry/n (statistical value of R per total data) values by looking at the statistical values above. The results can be compared with the Qy/n condition and Ry/n condition values; if the results are minor, then the data is still within consistent limits. The statistical values of Q and R are given in Table 1.
Table 1. Percentage of Qy/n and Ry/n values
|
Amount of Data |
Qy/n |
Ry/n |
||||
|
90% |
95% |
99% |
90% |
95% |
99% |
|
|
10 |
1.05 |
1.14 |
1.29 |
1.21 |
1.28 |
1.38 |
|
20 |
1.10 |
1.22 |
1.42 |
1.34 |
1.43 |
1.60 |
|
30 |
112 |
1.24 |
1.46 |
1.40 |
1.50 |
1.70 |
|
40 |
1.13 |
1.26 |
1.50 |
1.42 |
1.53 |
1.74 |
|
50 |
1.14 |
1.27 |
1.52 |
1.44 |
1.55 |
1.78 |
|
100 |
1.17 |
1.29 |
1.53 |
1.50 |
1.62 |
1.86 |
|
>100 |
1.22 |
1.36 |
1.55 |
1.62 |
1.75 |
2.00 |
2.2 Rainfall frequency analysis
This frequency analysis is based on the statistical properties of past event data to obtain the probability of the amount of rain in the future, assuming that the statistical properties of future rain events are still the same as those of past rain events. Determining the data series used in frequency analysis can be done using the maximum annual series, which is done by taking the top data each year. This means that the number of data series will be the same as the length of available data. As a result, the second maximum rainfall or flood in one year that may be greater than the maximum rainfall or flood in another year is not included in this analysis.
In statistics, several types of frequency distributions are known, and the four types of distribution widely used in the field of hydrology are the Gumbel distribution, normal distribution, log-normal distribution, and log- Pearson III distribution [16-18]. In statistics, there are several parameters related to data analysis, which include:
2.3 Rainfall intensity analysis
Rain intensity or rain thickness per unit of time is usually recorded in units of millimeters per hour (mm/hour). The data used are high intensity rain data that occur quickly, such as rain durations of 5, 10, 15, ..., 120 minutes, or more. If short-term or hourly rain data are unavailable and only daily rain data are available, then the rain intensity can be calculated using the Mononobe formula [19, 20].
2.4 Rain intensity mapping
For centuries, information on the earth's surface has been presented in maps, including rainfall information. Currently, software is widely used to detect rainfall and rain intensity. One of them uses ArcGIS software to map rainfall areas. ArcGIS is a software package consisting of Geographic Information System (GIS) software products produced by ESRI (Environmental Systems Research Institute) to map a region [21].
3.1 Rain data consistency
Several of the 48 rain measuring stations observed had incomplete data because the rain measuring stations were still new (less than ten years old). To fill in the incomplete rain data, an approach was made to the NASA rain data (www.nasa.gov). Next, a consistency test was carried out on the rain data using the rescaled adjusted partial sums (RAPS) method as has been reported in previous studies [22-24]. Figure 2 shows a striking visual representation of the rainfall consistency test, which is a crucial component of the broader study on rainfall intensity mapping for specific return periods. This graph is an essential tool in the quantitative analysis of historical rainfall data, serving as a diagnostic check to ensure the reliability and coherence of the data collected from 48 rain gauge stations across Sumatera Island. The rescaled adjusted partial sum test, depicted in the figure, is a sophisticated statistical method used to identify inconsistencies in rainfall data, which may indicate errors in data collection or represent actual anomalies in rainfall patterns. The diverse color palette in the graph facilitates a clear distinction between the various rain gauge stations, allowing for an immediate visual assessment of those falling within the normal, medium and high rainfall categories. This categorization is vital to understand the spatial distribution of rainfall intensity and frequency, which directly influences hydrometeorological disaster mitigation strategies [25-27].
The illustrated results serve as a methodological exhibit and a substantive foundation for subsequent rainfall intensity mapping. The data in the graph reveal that most stations exhibit rainfall amounts within the standard medium category. This insight underscores the need for region-specific disaster preparedness measures. By providing a detailed visual breakdown of data consistency, the study emphasizes the need for tailored approaches to water accumulation management, particularly in disaster-prone areas. These results form the basis for producing maps that delineate regions by their respective rainfall categories, critical information for government agencies, urban planners and disaster response teams in Sumatera. Thus, this graph is a testament to rigorous data analysis and a key instrument in the practical application of the study's findings towards reducing the risk and impact of hydrometeorological disasters.
Figure 2. RAPS test results for rain measuring stations on sumatera island
3.2 Calculation of frequency analysis
The selection of rain data for frequency analysis uses the annual maximum series method, namely by selecting one top data for each year. This method is used if rainfall data is available for at least ten years of time series data (Figure 3). According to BMKG, the average rainfall is divided into three categories, namely low (0 – 100 mm), medium (100 – 300 mm), high (300 – 500 mm), and very high (> 500 mm) [28, 29]. In Figure 3, it can be seen that for nine rain gauge stations (18.75%) on Sumatera Island, the average maximum daily rainfall is in the usual low rainfall category (lowest average maximum daily rainfall = 67.2 mm), while 81.25% (39 rain gauge stations) falls into the normal medium rainfall category with the highest average maximum daily rainfall at = 228.32 mm.
Figure 3. Maximum daily rainfall for the last 10 years
Frequency analysis is a procedure to estimate the frequency of an event in the past or future. This procedure can determine the design rainfall in various return periods based on the frequency distribution that best matches the theoretical rainfall distribution with the empirical rainfall distribution. In statistics, several parameters are related to data analysis to estimate frequency distributions: mean, standard deviation, coefficient of variation, kurtosis coefficient and skewness coefficient. The results of the statistical parameters and the appropriate distribution types for the rain data for each rain post are shown in Figure 4.
Figure 4. Results of statistical parameters and corresponding distribution types from each rainfall measurement station
After frequency analysis, the goodness-of-fittest test is carried out on the frequency distribution of the data samples to the probability distribution function, which is estimated to describe or represent the frequency distribution. The tests often used are the Chi-square test and the Smirnov-Kolmogorov test, and the rain data from these 48 stations meet the criteria for the Chi-square test and the Smirnov-Kolmogorov test [30].
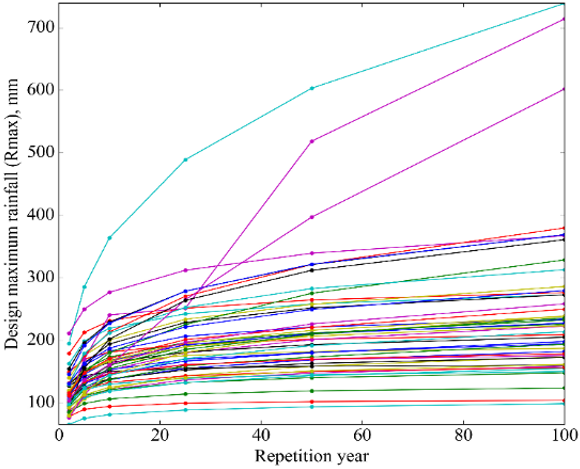
The following research stage calculates the design rainfall in various return periods based on the most appropriate frequency distribution, namely the log Pearson III distribution. Figure 5 provides a comprehensive visual analysis of the maximum amounts of projected rainfall in different return periods, from annual to centennial scales. This figure is instrumental in understanding the potential variability and extremity of rainfall events that Sumatera Island could experience. The curves represent the intensity of rain that is statistically likely to be equal to or exceeded once in a specified number of years at each station. As shown, the steeper gradients of some curves suggest a higher sensitivity of those locations to extreme rainfall events, which could be critical for flood risk assessments. In particular, the graph highlights a subset of stations with significantly higher design rainfall values, which could indicate regional climatic factors or geographic anomalies contributing to more intense rainfall patterns. These insights are vital for infrastructure design and urban planning, where safety margins against flooding must consider the heaviest rainfall likely to occur [31, 32].
The data encapsulate the variation in rainfall intensity with a clear distinction of return periods, essential for developing robust intensity-duration-frequency (IDF) relationships for the island. The spread of the curves across the graph illuminates the heterogeneity in rainfall patterns, implying that a one-size-fits-all approach to infrastructure design in Sumatera would be inadequate. The higher values of rain fall maximum (Rmax) observed for more extended return periods underscore the necessity of incorporating climate change projections into planning and design standards. This is particularly relevant for Sumatera, as it must prepare for the possibility of more frequent and severe hydrometeorological events. The information depicted in this graph will help policymakers and engineers create more resilient water management systems, ensuring that the infrastructure can withstand the upper echelons of projected rainfall intensity.
Figure 5. Design rainfall (Rmax) at various return periods from each rainfall measuring station
3.3 Calculation of rain intensity
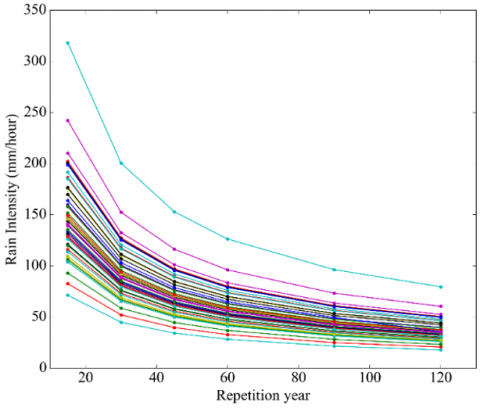
This study analyzes rain intensity for varying return periods (2, 5, and 10 years) and short durations (15 to 120 minutes). This data is crucial for engineers planning peak discharge for drainage systems in small catchment areas. It considers how short-duration, high-intensity rainfall events in different catchment parts can converge at the discharge point [33-35]. This simultaneous review helps in effective drainage design. Figure 6 presents an integral component of the rainfall intensity analysis for Sumatera Island. This graph delineates the intensity of rainfall events expected to occur on average once every two years across a range of durations at each of the 48 stations examined in the study. The descending lines illustrate a clear inverse relationship between rainfall intensity and duration, a characteristic finding in hydrological analyses. In particular, the tight clustering of lines at shorter durations indicates a more uniform response among stations to short-duration rainfall events. As the duration increases, the spread of the lines widens, suggesting that the variability among stations becomes more pronounced over extended periods. This is a critical observation for water resource management and disaster mitigation, as it emphasizes that the intensity of short-duration rainfall events may be more predictable and uniform across different regions of Sumatera. On the contrary, longer-duration events exhibit more significant spatial variability [36-39].
The implications of the data shown in Figure 6 are profound for the design and implementation of flood mitigation strategies. The relatively high intensity of short-duration rainfall highlights the need for rapid-response drainage systems to cope with sudden deluges, particularly in urban areas where impermeable surfaces exacerbate surface runoff. For longer durations, the data suggest that while intensity decreases, the total volume of water can still pose significant risks, necessitating the design of storage and slow release systems to prevent overburdening drainage capacity. Based on empirical data from multiple gauge stations, this nuanced understanding of rainfall intensity as a function of duration equips planners and engineers with the necessary information to design customized flood prevention measures. Such measures must be calibrated to the unique hydrological characteristics of each region within Sumatera to effectively mitigate the risks associated with these predictable but potentially destructive two-year return period rainfall events.
Figure 6. Mononobe rainfall intensity from 48 rain gauge stations for 2-year return periods of various durations
Figure 7 is a graphical representation of the analysis of the intensity of the rain that plays a critical role in understanding the hydrological patterns of Sumatera Island. The graph shows a series of descending lines, each representing the expected rainfall intensity of a rain gauge station for events with a return period of five years. The line convergence at the initial point on the Y-axis indicates that short-duration, high-intensity rainfalls are shared across the studied locations. As the duration increases, the intensity decreases, which is consistent with hydrological principles. The spread of the lines illustrates the variability of rainfall intensity across different durations and gauging stations, providing insight into the regional variations in rainfall patterns. This variability is significant for risk assessment, as it indicates that certain areas may be more susceptible to intense rainfall events than others [40, 41], which is critical to designing infrastructure and implementing effective flood management strategies.
The data presented in Figure 7 are essential for the development of infrastructure that can withstand significant rainfall events that occur on average once every five years. It suggests that Sumatera's stormwater systems must handle a range of rainfall intensities, from high-intensity, short-duration storms to less intense, but possibly more prolonged, rainfall events. For urban planners and civil engineers, these data are critical for designing flood mitigation systems, such as retention basins and reinforced drainage channels, tailored to their respective regions' specific rainfall profiles. The figure underscores the need for a flexible approach to water management that accommodates the varying intensities and durations of rainfall, ensuring that the infrastructure is resilient against a spectrum of hydrometeorological challenges posed by the five-year return period events.
Figure 8 offers a detailed visualization of the expected rainfall intensity for events with a return period of a decade. This graph is particularly significant for long-term urban and regional planning. The curvature of the lines indicates the relationship between rainfall intensity and duration, confirming that shorter events tend to be more intense. This is crucial for designing infrastructure elements, such as stormwater systems, that must cope with intense bursts of rainfall. The variance between the lines suggests that, while all stations are subject to similar hydrological patterns, the degree to which they are affected by heavy rain over a given duration can differ markedly. This differential can be attributed to geographical location, elevation, and local climate conditions. The higher intensities at the left end of the graph highlight the need for robust flood management strategies, especially in areas where the infrastructure may be vulnerable to extreme weather events [42].
The information in Figure 8 is vital to developing effective disaster risk reduction strategies. Given that these rainfall events are expected to occur once every ten years, they are less frequent but potentially more devastating. The graph provides policymakers and engineers with the data necessary to understand and prepare for the worst-case rainfall intensity and duration scenarios. This is important for the size of the drainage infrastructure, the creation of emergency response plans, and the implementation of landscape management practices that can mitigate the effects of heavy rains. The spread of the lines towards the right end of the graph also highlights the need for sustainable water management practices that can accommodate prolonged rainfall events, ensuring that water resources are managed efficiently and flood risks are minimized.
Figure 7. Mononobe rainfall intensity from 48 rain gauge stations for 5-year return periods of various durations
Figure 8. Mononobe rainfall intensity from 48 rain gauge stations for 10-year return periods of various durations
In this study, Mononobe rain intensity values were obtained from 48 rain stations on the island of Sumatera for return periods of 2, 5, and 10 years with a duration of 60 minutes, including conditions of heavy rain (>20 mm). High intensity and short duration rain conditions must be considered when planning maximum discharge for drainage design in small catchment areas. The comparative analysis of Figure 6 until Figure 8 reveals the progression of rainfall intensities at different return periods (2, 5, and 10 years, respectively) for various durations at the 48 rain gauge stations on Sumatera Island. All three figures show a clear trend of decreasing rainfall intensity with increasing duration, highlighting universal hydrological behavior. However, when comparing the figures, a notable shift in the intensity of rainfall events becomes apparent. Figure 6 indicates a more uniform intensity between stations for the 2-year return period, suggesting a frequent occurrence of moderate intensity rainfall events. Moving to Figure 7, the 5-year return period shows a slight increase in spread between stations, indicating the beginning of a differentiation in the intensity of rainfall events that can be expected to occur less frequently. Figure 8, representing the 10-year return period, exhibits an even greater spread among stations, implying that these less frequent events are characterized by a broader range of rainfall intensities, reflecting the variability of heavier rainfall events over a decade.
The rainfall data depicted in these figures are critical for infrastructure planning and risk management. While Figure 6 indicates the need for regular flood mitigation measures, Figure 7 and Figure 8 suggest that preparations must be made for less frequent but more intense and potentially damaging rainfall events. This distinction is essential for the design and implementation of water management systems. The systems must be robust enough to handle the regular intensity of 2-year events, as seen in Figure 6, while also being resilient against the more extreme but less frequent events shown in Figure 7 and Figure 8. The increased variability and intensity of rainfall in the 5-year and 10-year return periods underscore the importance of designing adaptive systems that respond to various meteorological conditions, protecting vulnerable areas from the varying impacts of rainfall events over different timescales.
3.4 Rain intensity map
The following is a Mononobe method rain intensity map for return periods of 2, 5, and 10 years for 60 minutes. This map can estimate the maximum flow discharge, such as planning city drainage systems, culverts, and bridges. Figure 9 provides a spatial visualization of the intensity of rainfall on Sumatera Island for a specific duration and frequency. The map is color-coded to represent different rainfall intensities, measured in mm per hour, which are expected to be exceeded once every two years for one hour. This representation is crucial for understanding the geographic distribution of rainfall intensities and identifying areas particularly susceptible to intense precipitation in a short period of time. The concentration of higher intensity values in certain regions indicates potential hotspots for flash flooding, necessitating targeted infrastructure to manage sudden water flows. The use of geographic coordinates along with station codes allows for precise location identification, making the map a valuable tool for local authorities and urban planners in developing region-specific flood mitigation strategies.
Figure 9. Rain intensity map of Sumatera island at 2 year return duration 60 minutes
The significance of Figure 9 lies in its utility for emergency planning and disaster risk reduction. The darker shaded regions indicate higher rainfall intensities, which require particular attention for urban drainage planning and agricultural and watershed management. The map also informs the development of early warning systems and evacuation plans, as areas prone to higher intensity are at greater risk of flash floods and associated hazards. For engineers and planners, this map is a foundational piece in designing and strengthening infrastructure, such as stormwater systems and flood barriers, to withstand the impact of intense rainfall events. Furthermore, the map can be used to educate the public about areas at risk, fostering community preparedness and resilience in the face of hydrometeorological challenges.
Figure 10 illustrates the expected intensity of rainfall for one hour, which is likely to occur once every five years. The map color gradient effectively differentiates between areas of varying rainfall intensities, with darker colors indicating higher intensities. This detailed mapping is crucial to identify regions at increased risk of experiencing significant rainfall within a relatively short period, which is critical in managing flood risks and designing adequate stormwater facilities. The map shows a transparent gradient of rainfall intensity, with specific zones exhibiting a higher propensity for intense rainfall. These areas are particularly interesting for infrastructure development and emergency planning, as the five-year return period suggests a moderate frequency of occurrence with potentially high impact.
Figure 10. Rain intensity map of Sumatera island at 5 year return duration 60 minutes
The data represented in Figure 10 are instrumental in strategic planning in water-sensitive urban design and agricultural practices. The intensities marked on the map guide the construction of a water infrastructure with sufficient capacity to handle the rainfall of such an event, ensuring that the drainage systems are not overwhelmed during peak rains. Furthermore, visualization is an empirical basis for local governments to allocate resources effectively, focusing on the most vulnerable regions. Understanding the spatial distribution of rainfall intensity allows for a proactive approach to disaster risk reduction, including the implementation of early warning systems. It contributes to the overall resilience of communities to hydrometeorological hazards. This map is a valuable asset for a comprehensive flood management strategy, providing vital information for informed decision-making and long-term planning.
Figure 11. Rain intensity map of Sumatera Island at 10 year return duration 60 minutes
Figure 11 presents the expected rain intensities for a significant one-hour rainfall event that is statistically expected to recur once every ten years. With its color-coded intensity zones, this map is crucial for identifying the spatial distribution of high-intensity rainfalls on Sumatera Island. Darker colors on the map denote regions with the highest intensity of rain, signifying potential areas of concern for extreme weather events. This information is crucial for long-term planning, particularly in areas prone to hydrometeorological disasters such as floods. The 10-year interval depicted on the map suggests these events are infrequent, but potentially severe, highlighting the need for robust infrastructure resilience and effective emergency management strategies.
The higher intensity zones indicated on the map require the development of reinforced flood defense systems and effective water management policies to protect vulnerable areas. This map is a strategic tool for government authorities and urban planners to prioritize areas for the investment of flood prevention and management infrastructure. It also guides the development of localized emergency response protocols, considering the increased impact of less frequent but more intense rainfall events. Furthermore, the data provided in Figure 11 could be integrated into regional planning guidelines to inform the construction of buildings, roads, and public utilities, ensuring that they are designed to withstand the high-intensity decadal rainfall events and contribute to the overall resilience of the infrastructure on Sumatera Island.
Extensive examination of rainfall patterns throughout Sumatera Island, Indonesia, employing the intensity duration frequency (IDF) method, has provided a crucial understanding of the geographical and temporal dispersion of rainfall intensities at different recurrence intervals. The IDF curves derived from historical rainfall data collected from 48 rain gauge sites around the island have allowed the development of precise rain intensity maps for 2-year, 5-year and 10-year recurrence intervals, each corresponding to a duration of 60 minutes. The results derived from the rescaled adjusted partial sums test, the design rainfall analysis, and the resulting intensity maps provide a reliable data set to understand rainfall patterns and prepare for probable hydrometeorological catastrophes.
The analytical results demonstrate that most of the rain gauge stations on Sumatera Island measure rainfall within the medium standard range, while a smaller portion falls into the high and normal categories. The intensity of rains decreases significantly as the length increases, but the divergence between weather stations becomes more noticeable over extended periods. The observed pattern remains constant throughout the various time intervals examined, highlighting the need for tailored regional planning and policies to mitigate disasters.
The rain intensity maps display regions with an increased likelihood of heavy rainfall, especially those with more profound color suggestions. These dark areas indicate a higher risk of flash floods and the need for immediate action in infrastructure design and community preparation. These maps are essential for government agencies, urban planners, and disaster response teams to establish policies that reduce flood risks, especially considering the more frequent and intense rainfall events caused by climate change.
Ultimately, this work offers implications as crucial reference data for effectively reducing hydrometeorological disasters on Sumatera Island. The research uses a quantitative analysis of historical rainfall data. Create detailed maps to help implement adaptive infrastructure design, efficient land use planning, and the development of comprehensive flood risk management strategies. This highlights the need to consider the intensity and frequency of rainfall in the context of climate change to strengthen the island's ability to withstand the anticipated rise in hydrometeorological occurrences. Adopting this proactive strategy is crucial to protect the lives, livelihoods, and economy of Sumatera Island, establishing a model for conducting such investigations in other areas. Last but not least, by expanding and adding observation stations, we can further increase the accuracy of the method being developed.
The Authors would like to thank the Directorate of Research, Technology and Community Service, Directorate General of Higher Education, Research and Technology, Ministry of Education, Culture, Research and Technology of the Republic of Indonesia as the funder of this research in 2023.
[1] Kim, J., Porter, J., Kearns, E.J. (2023). Exposure of the US population to extreme precipitation risk has increased due to climate change. Scientific Reports, 13(1): 21782. https://doi.org/10.1038/s41598-023-48969-7
[2] Shrestha, R., Rakhal, B., Adhikari, T.R., Ghimire, G.R., Talchabhadel, R., Tamang, D., KC, R., Sharma, S. (2022). Farmers’ perception of climate change and its impacts on agriculture. Hydrology, 9(12): 212. https://doi.org/10.3390/hydrology9120212
[3] Marengo, J.A., Alves, L.M., Ambrizzi, T., Young, A., Barreto, N.J., Ramos, A.M. (2020). Trends in extreme rainfall and hydrogeometeorological disasters in the Metropolitan Area of São Paulo: A review. Annals of the New York Academy of Sciences, 1472(1): 5-20. https://doi.org/10.1111/nyas.14307
[4] Prabhakar, S.V.R.K., Shaw, R. (2008). Climate change adaptation implications for drought risk mitigation: A perspective for India. Climatic Change, 88(2): 113-130. https://doi.org/10.1007/s10584-007-9330-8
[5] Prabhakar, S.V., Srinivasan, A., Shaw, R. (2009). Climate change and local level disaster risk reduction planning: need, opportunities and challenges. Mitigation and Adaptation Strategies for Global Change, 14: 7-33. https://doi.org/10.1007/s11027-008-9147-4
[6] Linnenluecke, M.K., Griffiths, A., Winn, M. (2012). Extreme weather events and the critical importance of anticipatory adaptation and organizational resilience in responding to impacts. Business Strategy and the Environment, 21(1): 17-32. https://doi.org/10.1002/bse.708
[7] Schlef, K.E., Kunkel, K.E., Brown, C., et al. (2023). Incorporating non-stationarity from climate change into rainfall frequency and intensity-duration-frequency (IDF) curves. Journal of Hydrology, 616: 128757. https://doi.org/10.1016/j.jhydrol.2022.128757
[8] Sandink, D., Simonovic, S.P., Schardong, A., Srivastav, R. (2016). A decision support system for updating and incorporating climate change impacts into rainfall intensity-duration-frequency curves: Review of the stakeholder involvement process. Environmental Modelling & Software, 84: 193-209. https://doi.org/10.1016/j.envsoft.2016.06.012
[9] Ayuso-Muñoz, J.L., García-Marín, A.P., Ayuso-Ruiz, P., Estévez, J., Pizarro-Tapia, R.A., Taguas, E.V. (2015). A more efficient rainfall intensity-duration-frequency relationship by using an “at-site” regional frequency analysis: Application at Mediterranean climate locations. Water Resources Management, 29: 3243-3263. https://doi.org/10.1007/s11269-015-0993-z
[10] Kirono, D.G., Butler, J.R., McGregor, J.L., Ripaldi, A., Katzfey, J., Nguyen, K. (2016). Historical and future seasonal rainfall variability in Nusa Tenggara Barat Province, Indonesia: Implications for the agriculture and water sectors. Climate Risk Management, 12: 45-58. https://doi.org/10.1016/j.crm.2015.12.002
[11] Aldrian, E., Dwi Susanto, R. (2003). Identification of three dominant rainfall regions within Indonesia and their relationship to sea surface temperature. International Journal of Climatology: A Journal of the Royal Meteorological Society, 23(12): 1435-1452. https://doi.org/10.1002/joc.950
[12] Susilo, G.E., Yamamoto, K., Imai, T., Ishii, Y., Fukami, H., Sekine, M. (2013). The effect of ENSO on rainfall characteristics in the tropical peatland areas of Central Kalimantan, Indonesia. Hydrological Sciences Journal, 58(3): 539-548. https://doi.org/10.1080/02626667.2013.772298
[13] Đurin, B., Kranjčić, N., Kanga, S., Singh, S.K., Sakač, N., Pham, Q.B., Hunt, J., Dogančić, D., Di Nunno, F. (2022). Application of Rescaled Adjusted Partial Sums (RAPS) method in hydrology–An overview. Advances in Civil and Architectural Engineering, 13(25): 58-72. https://doi.org/10.13167/2022.25.6
[14] Durin, B., Glumac, N., Sakač, N., Pezeshki, A., Dadar, S. (2020). New assessment of the analysis of wastewater quality on a wastewater treatment plant using the RAPS method. Environmental Sciences Proceedings, 7(1): 2. https://doi.org/10.3390/ECWS-5-08019
[15] Đurin, B., Raič, M., Sušilović, P. (2022). Application of the RAPS method of time series analysis to the assessment of grout curtain performance in karst—A case study of the hydro energy power plant (HEPP) Mostar Dam in Bosnia and Herzegovina. Hydrology, 9(11): 192. https://doi.org/10.3390/hydrology9110192
[16] Sangal, B.P., Biswas, A.K. (1970). The 3-parameter lognormal distribution and its applications in hydrology. Water Resources Research, 6(2): 505-515. https://doi.org/10.1029/WR006i002p00505
[17] Coronado-Hernández, Ó.E., Merlano-Sabalza, E., Díaz-Vergara, Z., Coronado-Hernández, J.R. (2020). Selection of hydrological probability distributions for extreme rainfall events in the regions of Colombia. Water, 12(5): 1397. https://doi.org/10.3390/w12051397
[18] Jahangir, M.H., Azimi, S.M.E., Arast, M. (2023). Determining the most appropriate probability distribution function for meteorological drought indices in Urmia Lake Basin, Iran. Environmental Monitoring and Assessment, 195(1): 2. https://doi.org/10.1007/s10661-022-10639-y
[19] Irawan, R., Pandebesie, E.S., Purwanti, I.F. (2017). The study of urban drainage system based on spatial structure plan. Sustinere: Journal of Environment and Sustainability, 1(2): 118-130. https://doi.org/10.22515/sustinere.jes.v1i2.14
[20] Susilowati, S., Alisjahbana, S.W., Kusumastuti, D.I. (2022). Estimation of intensity duration frequency for ungauged Basin in Lampung Province, Indonesia. International Journal of Design & Nature and Ecodynamics, 17(2): 297-302. https://doi.org/10.18280/ijdne.170217
[21] Kennedy, M. (2009). Introducing Geographic Information Systems with ARCGIS: A Workbook Approach to Learning GIS. John Wiley & Sons.
[22] Rangsiwanichpong, P., Kazama, S., Ekkawatpanit, C. (2017). Analysing the relationship between ocean indices and rainfall in the Chao Phraya River Basin. International Journal of Climatology, 37: 230-238. https://doi.org/10.1002/joc.4997
[23] Bonacci, O., Bonacci, D., Patekar, M., Pola, M. (2021). Increasing trends in air and sea surface temperature in the Central Adriatic Sea (Croatia). Journal of Marine Science and Engineering, 9(4): 358. https://doi.org/10.3390/jmse9040358
[24] Markovinović, D., Kranjčić, N., Đurin, B., Bjelotomić Oršulić, O. (2021). Identifying the dynamics of the sea-level fluctuations in Croatia using the RAPS method. Symmetry, 13(2): 289. https://doi.org/10.3390/sym13020289
[25] Sahani, J., Kumar, P., Debele, S., Spyrou, C., Loupis, M., Aragão, L., Porcù, F., Shah, M.A.R., Di Sabatino, S. (2019). Hydro-meteorological risk assessment methods and management by nature-based solutions. Science of the Total Environment, 696: 133936. https://doi.org/10.1016/j.scitotenv.2019.133936
[26] Debele, S.E., Kumar, P., Sahani, J., et al. (2019). Nature-based solutions for hydro-meteorological hazards: Revised concepts, classification schemes and databases. Environmental Research, 179: 108799. https://doi.org/10.1016/j.envres.2019.108799
[27] Gupta, S.K., Kanga, S., Meraj, G., Kumar, P., Singh, S. K. (2023). Uncovering the hydro-meteorological drivers responsible for forest fires utilizing geospatial techniques. Theoretical and Applied Climatology, 153(1): 675-695. https://doi.org/10.1007/s00704-023-04497-y
[28] Setiyono, H., Bambang, A.N.B., Helmi, M., Yusuf, M. (2022). Effect rainfall season on coastal flood in Semarang City, Central Java, Indonesia. International Journal of Health Sciences, (I): 7584-7595. https://doi.org/10.53730/ijhs.v6ns1.6618
[29] Hayasaka, H., Usup, A., Naito, D. (2020). New approach evaluating peatland fires in Indonesian factors. Remote Sensing, 12(12): 2055. https://doi.org/10.3390/rs12122055
[30] Handajani, N., Zainab, S., Trilita, M.N. (2021). Analysis of intensity, duration, frequency for Groundsill planning in the Lower Bengawan Solo River Basin. IOP Conference Series: Materials Science and Engineering, 1125(1): 012015. https://doi.org/10.5194/hessd-6-1347-2009
[31] Abdulkareem, M., Elkadi, H. (2018). From engineering to evolutionary, an overarching approach in identifying the resilience of urban design to flood. International Journal of Disaster Risk Reduction, 28: 176-190. https://doi.org/10.1016/j.ijdrr.2018.02.009
[32] Liao, K.H., Le, T.A., Van Nguyen, K. (2016). Urban design principles for flood resilience: Learning from the ecological wisdom of living with floods in the Vietnamese Mekong Delta. Landscape and Urban Planning, 155: 69-78. https://doi.org/10.1016/j.landurbplan.2016.01.014
[33] Kirkby, M.J., Bracken, L.J., Shannon, J. (2005). The influence of rainfall distribution and morphological factors on runoff delivery from dryland catchments in SE Spain. Catena, 62(2-3): 136-156. https://doi.org/10.1016/j.catena.2005.05.002
[34] Wei, Z., Shang, Y., Zhao, Y., Pan, P., Jiang, Y. (2017). Rainfall threshold for initiation of channelized debris flows in a small catchment based on in-site measurement. Engineering Geology, 217: 23-34. https://doi.org/10.1016/j.enggeo.2016.12.003
[35] Sartika, T.D., Pandjaitan, N.H., Sitorus, A. (2017). Measurement and modelling the drainage coefficient for hydraulic design criteria on residential area. In 2017 International Conference on Computing, Engineering, and Design (ICCED), pp. 1-5. https://doi.org/10.1109/CED.2017.8308092
[36] Alparone, S., Cannata, A., Gambino, S., Gresta, S., Milluzzo, V., Montalto, P. (2010). Time-space variation of volcano-seismic events at La Fossa (Vulcano, Aeolian Islands, Italy): New insights into seismic sources in a hydrothermal system. Bulletin of Volcanology, 72: 803-816. https://doi.org/10.1007/s00445-010-0367-6
[37] Dolšak, D., Bezak, N., Šraj, M. (2016). Temporal characteristics of rainfall events under three climate types in Slovenia. Journal of Hydrology, 541: 1395-1405. https://doi.org/10.1016/j.jhydrol.2016.08.047
[38] Zhang, Y.F., Wang, X.P., Hu, R., Pan, Y.X. (2016). Throughfall and its spatial variability beneath xerophytic shrub canopies within water-limited arid desert ecosystems. Journal of Hydrology, 539: 406-416. https://doi.org/10.1016/j.jhydrol.2016.05.051
[39] Devianti, Fachruddin, Purwati, E., Thamren, D.S., Sitorus, A. (2021). Application of geographic information systems and sediment routing methods in sediment mapping in Krueng Jreu Sub-Watershed, Aceh province, Indonesia. International Journal of Sustainable Development and Planning, 16(7): 1253-1261. https://doi.org/10.18280/ijsdp.160706
[40] Marchi, L., Borga, M., Preciso, E., Gaume, E. (2010). Characterisation of selected extreme flash floods in Europe and implications for flood risk management. Journal of Hydrology, 394(1-2): 118-133. https://doi.org/10.1016/j.jhydrol.2010.07.017
[41] Elum, Z.A., Modise, D.M., Marr, A. (2017). Farmer’s perception of climate change and responsive strategies in three selected provinces of South Africa. Climate Risk Management, 16: 246-257. https://doi.org/10.1016/j.crm.2016.11.001
[42] Diakakis, M., Boufidis, N., Grau, J.M.S., Andreadakis, E., Stamos, I. (2020). A systematic assessment of the effects of extreme flash floods on transportation infrastructure and circulation: The example of the 2017 Mandra flood. International Journal of Disaster Risk Reduction, 47: 101542. https://doi.org/10.1016/j.ijdrr.2020.101542