Ashfa Achmad*![]() | Ichwana Ramli
| Ichwana Ramli![]() | Sugiarto Sugiarto
| Sugiarto Sugiarto![]() | Irzaidi Irzaidi
| Irzaidi Irzaidi![]() | Atika Izzaty
| Atika Izzaty![]()
© 2024 The authors. This article is published by IIETA and is licensed under the CC BY 4.0 license (http://creativecommons.org/licenses/by/4.0/).
OPEN ACCESS
Land use and land cover (LULC) changes driven by rapid urbanization and land use policies can result in changes in carbon stocks. The study conducted in the region of Central Aceh (TCAR) aims to 1) identify the pattern of LULC change in TCAR 2001-2019 and make predictions of its changes in 2039 using the CA-Markov simulation, and 2) quantify changes in carbon stocks in the region in 2001-2019 and their predicted changes in 2039. This study uses Landsat 5 (2001), Landsat 7 (2009) and Landsat 8 OLI /TIRS (2019) satellite imagery, which is classified into six LULC categories using the supervised classification method. The 2001-2019 LULC map from the classification results was then tested for accuracy. The CA-Markov model was used to predict LULC changes and to obtain carbon stock values related to changes in LULC patterns. This study provides a new understanding of changes in LULC and their impact on carbon stocks, where LULC changes result in a decrease in carbon stocks, and will continue to decrease in 2039, along with the continued decline in forest area. These findings can be valuable information for policymakers in determining the appropriate spatial configuration in the future, which places more emphasis on increasing nature and environmental conservation, to mitigate climate change, a healthy environment, and provide comfort for the community.
land use and land cover, CA-Markov, carbon stocks, The Central Aceh, remote sensing, Landsat imagery
Eighty percent of the carbon (C) in forest ecosystems is thought to be found over the ground and forty percent beneath [1]. The importance of forests in preventing climate change is acknowledged by the international community. It uses the reducing emissions from deforestation and forest degradation (REDD) concept, which entails decreasing emissions from deforestation and forest degradation, conserving forest carbon stocks, sustainable forest management, and raising forest carbon stocks in developing countries [2]. One ton of carbon stored in trees results in the removal of 3.67 Mg of carbon dioxide from the atmosphere [3]. REDD is emerging as a primary policy to reduce emissions related to land use. The mechanisms of REDD are instrumental in reducing emissions from deforestation and forest degradation [4]. The agroforestry system is one of the possible REDD strategies [5].
Aceh's ability to supply carbon is pretty substantial. In 2012, this province's forest cover was 3,929,420 acres, or sixty-eight percent of the total of Aceh's land area. Given the forest cover size, a lot of carbon is produced [6]. Due to Aceh's shrinking forest acreage, it is imperative to establish a suitable REDD plan to maintain this carbon stock. Around 3,004,352 ha of forest were present in 2018; by the end of 2019, that number had dropped to 2,989,212 ha. According to SK.580/MENLHK/SETJEN/SET.1/12/2018, the Aceh Province conserves about 3,557,928 ha of forest and water.
The transformation of land use and land cover (LULC) has been linked to a reduction in carbon storage, according to several earlier studies, both locally [7, 8] and globally [1, 9]. Depending on the variety and density of plants in the area, different amounts of carbon can be stored on different types of land. Carbon stocks can be estimated using satellite photography technology in conjunction with measurements of carbon storage in distinct LULC types [10].
Understanding the LULC transformation and its involvement in changes in the supply of carbon stocks is essential for developing effective spatial planning strategies and mitigating climate change [1, 8]. Getting a basic understanding of the carbon content related to the various LULC categories is the first step in achieving this goal [1]. However, knowledge regarding the direct impact of LULC on carbon storage has not been widely quantified in tropical climates [9, 11]. In addition, there are still few studies that examine the effects of changes in LULC on carbon stocks in the future, using simulation modeling techniques [12].
Many regional and environmental planning studies use remote sensing (RS) technology as a significant data source. By using this technology, LULC can be classified into several categories and determine the effects of changes that take place in addition to being a monitoring tool [11, 13, 14]. These RS data can be used to create LULC maps that can be used to track the patterns of change, including their spatial and compositional arrangements. Forest cover changes that were discovered using RS can be utilized to determine how much carbon is stored there [2, 8]. Future LULC changes have been predicted using prediction methods of the CA-Markov model in a large number of cases [15].
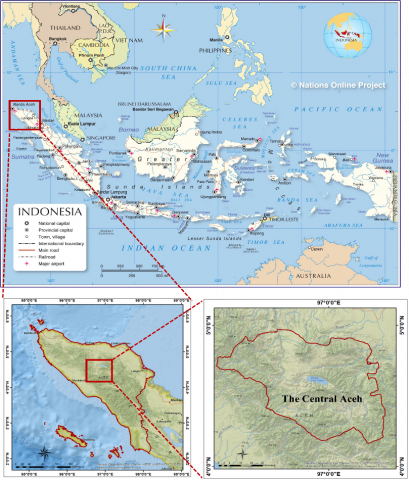
In addition, to provide information on the transformation of LULC and carbon stocks in 2040, this study also offers options for environmentally friendly spatial planning. The study location is The Central Aceh Region (TCAR), which is made up of the Bener Meriah Regency and The Central Aceh Regency, was selected due to its distinctive regional landscape configuration, which includes mountains, forests, lakes, and watersheds.
2.1 Research location
This study was conducted in TCAR, which consists of The Central Aceh Regency and the Bener Meriah Regency, Aceh, as shown in Figure 1. This region has an area of 57,956 km2, with a population of 376,810 people (2020). The average air temperature is 21.38℃, with an altitude of 100 m to over 2,100 m above sea level. The average humidity is 89.92% [16].
This region is mainly located in the Gayo Highland, Central Aceh Regency, Aceh, Indonesia (Figure 1), which is situated astronomically between 4°10'30'' – 05°7'40'' N and 95°13'02'' – 95°22'36'' E, with a population of 72,646 people (2020) (Central Aceh Regency in Figures, 2021). This region has an area of 16,024 ha, while the average altitude of urban areas is about 1,200 meters above sea level. The boundaries of the area surrounding this region are as follows:
2.2 Data analysis
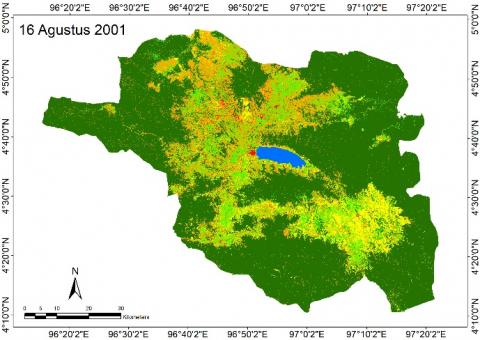
Using Landsat 5 (2001), Landsat 7 (2009), and Landsat 8 OLI/TIRS (2019) satellite imagery from http://earthexplorer.usgs.gov/, LULC in the region is classified into six categories [17], based on landscape conditions, which include: 1) forest, 2) grassland, 3) water body, 4) agriculture land, 5) built-up area, and 6) bareland, using ArcGIS®10.1. The following equation was used to tested the accuracy of LULC maps using reference point [18, 19] (Table 1).
Overall accuracy = $\frac{{{N}_{AA}}~+~{{N}_{BB}}~+~{{N}_{CC}}}{N}$. × 100% (1)
Kappa = $\frac{N~\mathop{\sum }_{j=1}^{k}{{N}_{jj}}-\mathop{\sum }_{j=1}^{k}{{N}_{jR}}{{N}_{Pj}}}{{{N}^{2}}-~\mathop{\sum }_{j=1}^{k}{{N}_{jR}}{{N}_{Pj}}}$ (2)
where, N = total points; k = the number of classes, R = test classes, and P = the classified class.
Figure 1. Research location [16]
Table 1. An example of the confusion matrix
|
Test Data |
||||||
|
|
A |
B |
C |
Ʃ |
User’s accuracy (%) |
|
|
Classified |
A |
NAA |
NAB |
NAC |
ƩAR |
NAA / ƩAR × 100% |
|
Data |
B |
NBA |
NBB |
NAC |
ƩBR |
NBB/ ƩBR × 100% |
|
|
C |
NCA |
NCB |
NCC |
ƩCR |
NCC / ƩCR × 100% |
|
Ʃ |
ƩPA |
ƩPB |
ƩPC |
N |
|
|
|
|
Producer’s |
NAA/ƩPA |
NAA/ƩPA |
NAA/ƩPA |
|
|
|
|
Accuracy (PA) × 100% |
× 100% |
× 100% |
× 100% |
|
|
LULC classification is carried out in a supervised manner, using maximum likelihood. Using stratified random sampling, the LULC maps resulting from the classification were tested for accuracy using the ERRMAT module in TerrSet 2020, according to reference points. The calculation of overall accuracy and kappa coefficient is seen in Table 1 [20].
The next step is to predict LULC for 2033. This process was carried out using TerrSet 2020, which has a CA-Markov simulation [21, 22]. This CA-Markov simulation combines two methods, namely Markov chain (MC) and Cellular automata (CA). MC is an empirical/stochastic model that is determined based on the probability of an event occurring and is determined by previous events, which can be used to predict subsequent events [23, 24]. CA is a dynamic model that integrates space and time dimensions, which can be incorporated into GIS [22, 25]. This model produces a transition from the initial time to the target time using probability values. The Markov chain can be described as a transition probability matrix as follows [26]:
$Pij = \left[ \begin{matrix}
{{p}_{11}} & {{p}_{12}} & \begin{matrix}
\ldots & {{p}_{1k}} \\
\end{matrix} \\
{{p}_{21}} & {{p}_{22}} & \begin{matrix}
\ldots & {{p}_{2k}} \\
\end{matrix} \\
\begin{matrix}
\ldots \\
{{p}_{k1}} \\
\end{matrix} & \begin{matrix}
\ldots \\
{{p}_{k2}} \\
\end{matrix} & \begin{matrix}
\begin{matrix}
\ldots \\
\ldots \\
\end{matrix} & \begin{matrix}
\ldots \\
{{p}_{kk}} \\
\end{matrix} \\
\end{matrix} \\
\end{matrix} \right]$. (3)
Pij from state i to state j, for all indices should fulfill these rules:
0 ≤ Pij ≤ 1 (i,j = 1,2,3,…,n)
$\mathop{\sum }_{i=1}^{n}Pij$ = 1 (i,j = 1,2,3,…,n)
Based on the transition probability matrix, and Bayes probability theorem, MC could be defined as (…8):
P(n) = P(n-1)Pij
where,
P(n) = condition’s probability in a time
P(n-1) = probability in the preceding conditions
Pij = transformation probability of land cover into another.
The average forest carbon stock data is the carbon stock utilized for forest land cover (including degraded forest). For plantations and agricultural land cover with regular planting and harvesting cycles, time-averaged C stock data is employed [27, 28]. Table 2 provides references on the carbon stocks in the above-ground biomass employed in the RAN-GRK. It is urged to create local emission factors for the sub-national level (province and regency) that are more accurate and accurately reflect the situation in the relevant province or regency. Additionally, a higher layer is required for carbon trading that bases payments on the effectiveness of emissions reductions (result-based payment).
Table 2. Recommended aboveground emission factors (carbon stocks) for emission inventory from land use change on a national scale
|
LULC |
C (Mg.ha-1) |
Source |
|
Secondary forest |
169 |
World Agroforestry Centre (2011) for high-density secondary forests; Rahayu et al. [29]; IPCC (2006) for tropical Asia; Saatchi et al. [30]; World Agroforestry Centre (2011) for low-density secondary forests, Asmara et al. [31] with the value of 250, 203, 180, 158, 150 and 74 t/ha, respectively. |
|
Plantation forest |
64 |
World Agroforestry Centre (2011) mineral soil 70 t/ha, peat soil 60 t/ha. |
|
Bushland |
30 |
IPCC (2006); Istomo et al. [32]; Jepsen [33]; World Agroforestry Centre (2011) respectively 35, 30, 20 and 27 t/ha. |
|
Grassland |
4 |
Rahayu et al. [29] |
|
Waterbody |
0 |
Assumption |
|
Agriculture land |
30 |
Rahayu et al. [29] |
|
Built-up area |
4 |
World Agroforestry Centre (2011) |
|
Bareland |
2.5 |
Assumption |
Source: Study [34]
There are two methods for determining emissions: 1) calculating changes in carbon stocks (stock difference) and 2) calculating increases and declines in carbon stocks (gain and loss). The stock difference approach calculates the variation in carbon stocks across time, such as one cycle of plantation crops or plantation woods. The US EPA (2012) also employed this technique. Lands that do not vary in use or cover at a given time are thought to be non-emitting (zero emission), while lands that do change in use or cover emit carbon. By deducting the carbon stock of the following land cover from the carbon stock of the initial land cover, this carbon emission is computed.
3.1 Accuracy assessment
From the calculation of the accuracy test carried out using the method described above, it was found that the overall accuracy for LULC in 2001, 2009, and 2019 was 95.30%, 93.70%, and 92.40%, respectively. Meanwhile, the kappa coefficient values are 0.91, 0.88, and 0.86, respectively, which means it is in the very good category [35], and can be used for subsequent modeling, which uses CA-Markov. There are 1,000 sample points determined by stratified random sampling, which can be seen in Table 3. For the water body category, there is no misinterpretation. A minor misunderstanding appears in the built-up area category. Meanwhile, misunderstanding often occurs in the forest category, with errors in 2001, 2009, and 2019 at 2.30%, 3.48%, and 3.55%, respectively.
3.2 LULC changes
Table 3 shows that the LULC in Aceh Tengah Regency is divided into six categories; forest, grassland, water body, agriculture land, built-up area, and bareland (Figure 2). The largest LULC area in 2001 was forest, with a land area of 418,363.76, or 65.19% of the total LULC area. After forest comes grassland, with an area of 98,695.58 or 15.38%, and then comes agriculture land, with an area of 68,567.64 or 10.68% of the total area. The bareland category comes in fourth with an area of 45,190.23 or 7.04%, and then comes the water body category with an area of 5,731.31, or 0.89% of the total area. The smallest LULC is built-up area with an area of 5,236.23 or 0.82% of the entire area.
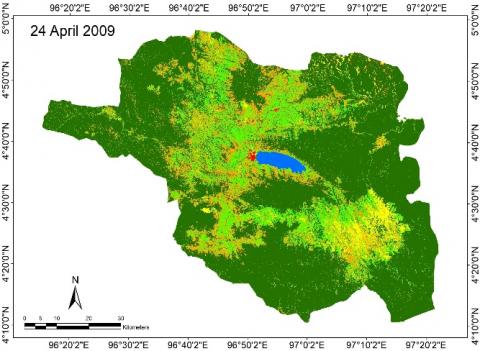
In 2009, LULC experienced an increase and decrease in area, as previous research [36, 37]. It is indicated by the increase in agriculture land, built-up area, and water body, as well as the decrease in forest, grassland, and bareland. Table 4 shows several changes in LULC that occurred from 2001 to 2009.
Table 3. Confusion matrix of LULC
|
Classified Data |
Reference Data |
|||||||
|
Forest |
Grassland |
Waterbody |
Agriculture |
Built-Up Area |
Bareland |
Total |
User's Accuracy (%) |
|
|
(a) 2001 |
||||||||
|
Forest |
637 |
7 |
0 |
8 |
0 |
0 |
652 |
97.70 |
|
Grassland |
16 |
144 |
0 |
5 |
0 |
0 |
165 |
87.27 |
|
Waterbody |
0 |
0 |
11 |
0 |
0 |
0 |
11 |
100.00 |
|
Agriculture |
4 |
1 |
0 |
85 |
0 |
1 |
91 |
93.41 |
|
Built-up Area |
0 |
0 |
0 |
0 |
7 |
1 |
8 |
87.50 |
|
Bareland |
0 |
1 |
0 |
3 |
0 |
69 |
73 |
94.52 |
|
Total |
657 |
153 |
11 |
101 |
7 |
71 |
1.000 |
|
|
Producer's accuracy (%) |
96.96 |
94.12 |
100.00 |
84.16 |
100 |
97.18 |
||
|
Overall accuracy (%) = 95.30; K coefficient = 0.91 |
||||||||
|
(b) 2009 |
||||||||
|
Forest |
638 |
8 |
0 |
15 |
0 |
0 |
661 |
96.52 |
|
Grassland |
13 |
111 |
0 |
5 |
0 |
0 |
129 |
86.05 |
|
Water Body |
0 |
0 |
11 |
0 |
0 |
0 |
11 |
100.00 |
|
Agriculture |
5 |
8 |
0 |
136 |
1 |
2 |
152 |
89.47 |
|
Built-up Area |
0 |
0 |
0 |
0 |
10 |
0 |
10 |
100.00 |
|
Bareland |
4 |
2 |
0 |
0 |
0 |
31 |
37 |
83.78 |
|
Total |
660 |
129 |
11 |
156 |
11 |
33 |
1.000 |
|
|
Producer's accuracy (%) |
96.67 |
86.05 |
100.00 |
87.18 |
90.91 |
93.94 |
||
|
Overall accuracy (%) = 93.70; K coefficient = 0.88 |
||||||||
|
(c) 2019 |
||||||||
|
Forest |
624 |
5 |
0 |
18 |
0 |
0 |
647 |
96.45 |
|
Grassland |
1 |
84 |
0 |
8 |
0 |
5 |
98 |
85.71 |
|
Water Body |
0 |
0 |
11 |
0 |
0 |
0 |
11 |
100.00 |
|
Agriculture |
23 |
6 |
0 |
172 |
1 |
1 |
203 |
84.73 |
|
Built-up Area |
0 |
0 |
0 |
2 |
9 |
0 |
11 |
81.82 |
|
Bareland |
4 |
1 |
0 |
1 |
0 |
24 |
30 |
80.00 |
|
Total |
652 |
96 |
11 |
201 |
10 |
30 |
1.000 |
|
|
Producer's accuracy (%) |
95.71 |
87.50 |
100 |
85.57 |
90.00 |
80.00 |
||
|
Overall accuracy (%) = 92.40; K coefficient = 0.86 |
||||||||
In 2009, the forest category experienced a slight decrease from 65.19% to 65.18% of the total area. Grassland also experienced a decrease in area, from 15.38% to 12.39%. Bareland area experienced a decrease from 7.04% to 3.93%. Meanwhile, the LULC categories of water body, agriculture land, and built-up area experienced an increase in area. In 2001, the water body category had an area of 0.89%; in 2009, the area increased to 0.90%. Agriculture land experienced a significant increase in area, from 10.68% to 16,63%. Built-up area also increased from 0.82% to 0.98%.
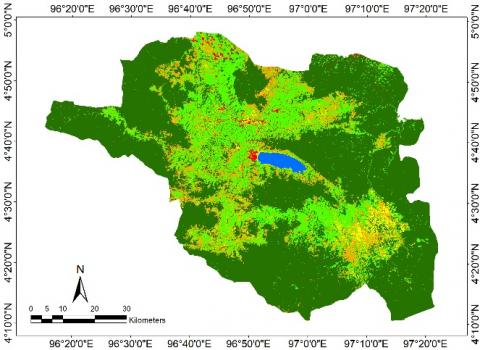
Several changes in the LULC area also occurred from 2009 to 2019. In 2019, the forest category experienced a slight decrease in area, from 65.18% to 63.74% of the total area. Grassland also experienced a decrease in area, from 12.39% to 11.07%, water body from 0.90% to 0.88%, and bareland from 3.93% to 2.83%. Meanwhile, agriculture land and built-up area experienced an increase in area. Agriculture land experienced a significant increase in area, from 16.63% to 20.38%. Built-up area increased from 0.98% to 1.10%.
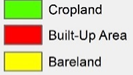
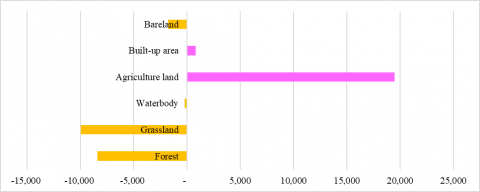
In 2039, LULC is expected to experience an increase and decrease in area. It is estimated based on the pattern of the rise and protection of LULC from 2001 to 2019. Several LULC categories, namely agriculture land, and built-up area are expected to continue to increase. Meanwhile, the forest, grassland, water body, and bareland categories are expected to decrease. The estimated LULC area in 2039 can be seen in Figure 3.
Table 5 shows the estimated changes in LULC for 2039. The forest category is expected to experience a slight decrease in area, from 63.74% to 62.43% of the total area. Grassland is also estimated to experience a decrease in area, from 11.07% to 9.51% of the total area. The water body is also expected to experience a slight decrease, from 0.88% to 0.85%. Bareland is expected to decrease from 2.83% to 2.56%. Meanwhile, agriculture land and built-up area are estimated to increase in area. Agriculture land is expected to increase from 20.38% to 23.42%, while built-up area is also estimated to increase from 1.10% to 1.23%. Several studies also show the same condition, where forests are decreasing, built-up land is increasing, and agricultural land is increasing, which also has an impact on the loss of carbon stock [9, 11, 12, 17, 38].
(a) LULC 2001
(b) LULC 2009
(c) LULC 2019
(d) Prediction LULC 2039
Figure 2. (a) LULC 2001, (b) LULC 2009 [16], (c) LULC 2019 [16], and (d) prediction LULC 2039
Figure 3. Estimated changes in LULC area
Table 4. LULC area in 2001, 2009, and 2019
|
Category |
Area (ha) |
Area Difference (ha) |
|||||
|
2001 |
2009 |
2019 |
2001-2009 |
2009-2019 |
|||
|
Luas |
% |
Luas |
% |
||||
|
Forest |
418,363.76 |
418,321.46 |
409,050.74 |
- 42.30 |
- 0.01 |
- 9,270.72 |
- 2.27 |
|
Grassland |
98,695.58 |
79,500.88 |
71,014.09 |
-19,194.71 |
-24.14 |
- 8,486.79 |
- 11.95 |
|
Waterbody |
5,731.31 |
5,758.17 |
5,649.25 |
26.86 |
0.47 |
-108.92 |
- 1.93 |
|
Agriculture land |
68,567.64 |
106,720.34 |
130,817.33 |
38,152.70 |
35.75 |
24,096.99 |
18.42 |
|
Built-up area |
5,236.23 |
6,290.13 |
7,079.27 |
1,053.89 |
16.75 |
789.14 |
11.15 |
|
Bareland |
45,190.23 |
25,193.79 |
18,174.08 |
-19,996.44 |
-79.37 |
-7,019.71 |
-38.62 |
|
Total |
641,784.76 |
641,784.76 |
641,784.76 |
||||
Table 5. LULC area in 2019 and 2039
|
LULC |
Area (ha) |
|||
|
2019 |
Percentage |
2039 |
Percentage |
|
|
Forest |
409.050,741 |
63.74% |
400.676,213 |
62.43% |
|
Grassland |
71.014,086 |
11.07% |
61.050,131 |
9.51% |
|
Waterbody |
5.649,250 |
0.88% |
5.438,446 |
0.85% |
|
Agriculture land |
130.817,330 |
20.38% |
150.305,261 |
23.42% |
|
Built-up area |
7.079,272 |
1.10% |
7.905,021 |
1.23% |
|
Bareland |
18.174,082 |
2.83% |
16.409,688 |
2.56% |
|
Total |
641.784,761 |
100.00% |
641.784,760 |
100.00% |
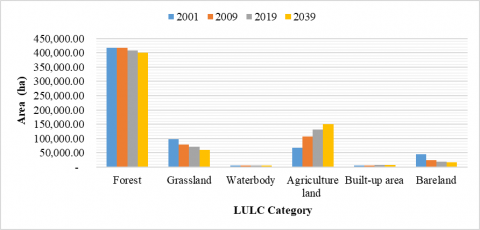
Figure 4 shows the change in the area of each LULC category from 2001 to 2019. The orange bar in Figure 3 represents a decrease in the area of LULC from 2001 to 2019, while the purple bar represents an increase. The decrease in area is indicated in by negative value. Grassland and bareland experienced a substantial decrease in area, while waterbody and forest experienced only a slight decrease. Many grasslands and bareland were converted into agricultural and built-up area from 2001 to 2019. It resulted in these two categories continuing to decline from 2001 to 2019. The decrease in the area also occurred in forest and waterbody, albeit not too significantly, at only -9,313.019 and -82.064. From Table 5, it can also be concluded that the estimated most significant LULC change from 2019 to 2039 is that there will be a decrease in the LULC categories of the forest, grassland, water body, and bareland, at -8,374.528 ha, -9,963.956 ha, -210.804 ha, and -1,764.393 ha respectively. This change in LULC is marked by the increase in agriculture land and built-up area, at 19,487.931 ha and 825.749 ha, respectively. Figure 5 shows the estimates in a bar graph.
The purple bar in Figure 5 represents an increase in the LULC area, while the orange bar represents a decrease. The decrease in area is indicated by negative value. Similar to the change in LULC area from 2009 to 2019, grassland and forest are expected to continue to experience a considerable decrease in area, while bareland and water body are expected to experience a slight decrease as they are expected to be converted into agriculture land and built-up area.
Figure 4. LULC changes in area 2001-2019 (ha)
Figure 5. Estimated LULC changes in area 2019-2039 (ha)
The decrease in bareland, grassland, and other categories was caused by a large number of land clearings of unproductive land to be converted into land use that could meet human needs, which is marked by the increase of agriculture land and built-up area areas. Other grounds also consist of constructing various infrastructure and facilities in the study area to support multiple activities properly and smoothly.
Between 2001 and 2019, there were significant changes in LULC, and more are predicted in 2039. It is crucial to satisfy the requirement for space to meet the many human needs and development needs, given the growing rate of population growth and economic expansion that occurs every year. It implies that there would be an ongoing rise in the need for agricultural land and urban space for development and agriculture to suit human requirements. The LULC modification must, however, be implemented with care to avoid having a detrimental influence on the area's environment and must continue to adhere to the established regulations and spatial plans. The ecosystem must thus be maintained and preserved, and uncontrolled land alterations must be avoided, for LULC improvements to be suitable and sustainable.
3.3 Carbon stock changes
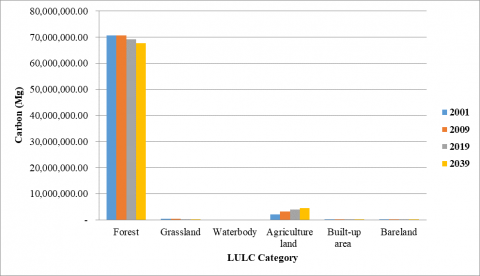
Calculating carbon stock is very important in improving environmental quality and mitigating climate change [12]. This change in LULC results in changes in carbon stocks in each LULC category [39], and also influences changes in land surface temperature [40, 41]. Table 6 shows the total carbon stocks stored in TCAR in 2001, 2009, and 2019 and the predicted carbon stocks in 2039. The highest carbon stocks are found in the forest LULC category, followed by agriculture land, grassland, bareland, and built-up area. In contrast, the water body category provides no carbon stock. The total carbon stock was at its peak in 2009, at 74,304,085.05 Mg, before it continued to decrease (Figure 6).
Table 6. Carbon stock changes
|
LULC |
Carbon (Mg) |
|||
|
Year |
Prediction Result |
|||
|
2001 |
2009 |
2019 |
2039 |
|
|
Forest |
70,703,475.44 |
70,696,326.34 |
69,129,575.31 |
67,714,280.00 |
|
Grassland |
394,782.33 |
318,003.50 |
284,056.34 |
244,200.52 |
|
Waterbody |
- |
- |
- |
- |
|
Agriculture land |
2,057,029.22 |
3,201,610.23 |
3,924,519.90 |
4,509,157.82 |
|
Built-up area |
20,944.94 |
25,160.51 |
28,317.09 |
31,620.08 |
|
Bareland |
112,975.58 |
62,984.48 |
45,435.20 |
41,024.22 |
|
Total |
73,289,207.51 |
74,304,085.05 |
73,411,903.84 |
72,540,282.65 |
Tabulated data shows that there is an increase as well as a decrease in carbon stocks from 2001 to 2039. In 2009, there was an increase of 1,014,877.54 Mg (1.38%) from 2001. The increase occurred in agriculture land category at 1,144,581.01 Mg (64.24%), followed by built-up area. Meanwhile, the other land categories experienced a decrease. The largest decrease in carbon stock in 2009 occurred in the grassland category at 76.778,83 Mg (19.44%), followed by bareland and forest. LULC can, directly and indirectly, affect carbon uptake and loss in conjunction with changes in carbon stocks [42].
In 2019, there was a decrease in carbon stocks of 892.181.21 Mg (1.2%) from 2009. The decline occurred in forest, grassland, and bareland. The most significant decrease occurred in forest at 1,566,751.03 Mg (2.21%), followed by grassland and bareland. Meanwhile, the most significant increase was in agriculture, at 722,909.67 Mg (22.57%), followed by built-up area at 3,156.58 Mg (12.54%). The carbon stock in each type of LULC category is influenced by tree biomass, soil biomass, undergrowth, and root factors. Soil also plays an essential role in maintaining the balance of carbon storage (vegetation, climatic conditions, and soil physical chemistry).
The prediction of changes in carbon stocks in 2039 shows a decrease from 2019, totaling 907,621.19 Mg (1.23%). This amount is more significant than the previous year. The largest decrease occurs in forest, at 1,415,295.31 Mg (2.04%), followed by grassland and bareland. Meanwhile, there is an increase in carbon stocks in agriculture land and built-up area. There is an increase of 584,637.92 Mg (14.89%) in agriculture land and 3,302.99 Mg (11.66%) in built-up area.
Carbon stocks in the forest category tend to be larger yearly than in the other land categories. In 2001, the forest's carbon stocks were 70,703,475.44 Mg. In 2009, it decreased to 70,696,326.34 Mg. In 2019, it decreased again to 69,129.575.31 Mg, and in 2039 to 67,714,280.00 Mg. Meanwhile, the number of carbon stocks in grassland was 394,782.33 Mg in 2001. In 2009, it decreased to 318.003.50 Mg. In 2019 it decreased again to 284,056.34 Mg, and in 2039 to 244,200.52 Mg. The number of carbon stocks in bareland was 112,975.58 Mg in 2001. In 2009, it decreased to 62,984.48 Mg. In 2019 it decreased again to 45,435.20 Mg, and in 2039 to 41,024.22 Mg. Increased LULC triggered carbon stock loss for the grassland and bareland categories. Agricultural land is one category that can absorb and emit CO2 [43].
Meanwhile, there is an increase in carbon stocks in agriculture land and built-up area. The number of carbon stocks in agriculture land was 2,057,029.22 Mg in 2001. In 2009, it increased to 3,201,610.23 Mg. In 2019, it increased again to 3,924,519.90 Mg, and in 2039 to 4,509,157.82 Mg. The number of carbon stocks in built-up area was 20,944.94 Mg in 2001. In 2009, it increased to 25,160.51 Mg. In 2019, it increased again to 28,317.09 Mg, and in 2039 to 31,620.08 Mg. This occurs due to the positive impact of plants with existing species diversity on the availability of organic carbon. The presence of plants can alter carbon uptake into the soil and the release of carbon. The conversion of mixed forest to another LULC category can reduce the carbon stock in the soil by about 0.39 mg ha/year, depending on the category of LULC. Changes from the category of agricultural land to grasslands will increase the soil carbon stock. Otherwise, the soil carbon stock will decrease if the land cover changes to agricultural land (0.84-1.74 Mg ha/year) [44].
The tabulated data shows that the same LULC categories that experienced a decrease will continue to experience a reduction. In contrast, the same classes that experienced an increase will continue to experience an increase [45]. The categories that continue to experience a decrease in carbon stocks are forest, grassland, and bareland [1, 2]. On the other hand, agriculture land, and built-up area continue to experience an increase in carbon stocks yearly. This change very much depends on the transformation of the area of each LULC category. Increased emissions and species, density, and the number of plants have different carbon stocks, so each land category has other carbon stocks [46]. LULC change influences regional and global climate change through carbon emissions. Thus, public policy must focus more on nature conservation and improving environmental quality to mitigate climate change [12]. However, other facts state that changes in LULC are not the only factor that influences changes in carbon storage and climate, but LULC is the main factor compared to other environmental factors [47-49].
So, assessing the effect of changes in LULC on the carbon budget is very necessary for efforts to balance regional carbon budgets and the impact of human activities on the environment [48]. Apart from climate change, LULC also causes significant disruption to the carbon budget [50].
The continuing decrease of forest, grassland, and bareland areas reduces carbon stocks in each land category [11]. Several reasons, such as local climate, site conditions, source rock, and vegetation type, will affect the variation of carbon stock in the soil. Carbon accumulation and loss patterns were determined according to location, soil type, tree species, and plantation land management system. Changes in land cover have a significant effect on the total carbon stock in an ecosystem. Changing land cover from either forest to plantations or agricultural land will reduce the total available carbon.
Figure 6. LULC category and the valuation of carbon stocks
Forests category has decreased, although not significantly, in the area of -9,313,019 ha. Meanwhile, according to Table 4, water bodies increased in 2009 and decreased in 2019. The total decrease in the area of water bodies was -82,064 ha. In 2039, LULC is expected to experience an increase and decrease in area. Several LULCs, such as agriculture land and built-up area, are expected to increase and decrease in forest, grassland, waterbody, and bareland. The changes in carbon stocks in 2039 show a reduction from 2019 of 907,621.19 Mg (1.23%). This amount is more significant than the previous year. The most considerable reduction occurred in forest cover, which was 1,415,295.31 Mg (2.04%), followed by grassland and bareland.
The loss of carbon stock that occurs is very significant, so important steps are needed in efforts to mitigate climate change, one of which is creating public policies that encourage the preservation of natural resources and the environment, and the carbon budget can be more controlled to control global temperature increases. It is necessary to monitor and evaluate the growth of the built-up area in the study area, which decreases carbon stocks. The monitoring and evaluation results become a reference in preparing spatial patterns and regional spatial structures. Areas that need to be conserved, such as forests, must be protected areas that cannot be disturbed by their use so that carbon stocks do not decrease with the growth of the built-up area.
Regarding conditions in TCAR, where currently there is a significant increase in temperature, a strategy is needed for regulating land use, by prioritizing strong protection of forests, reforestation of forests, and carrying out strict monitoring, so that forest conservation areas are maintained. By doing this, it is hoped that carbon stocks will be maintained, and efforts to achieve the SDGs will have greater opportunities.
We are grateful to the Universitas Syiah Kuala for its support and funding for this research. Contract no.: 010/UN11.2.1/PT.Q1.03/PNBP/2022.
[1] Nakakaawa, C.A., Vedeld, P.O., Aune, J.B. (2011). Spatial and temporal land use and carbon stock changes in Uganda: Implications for a future REDD strategy. Mitigation and Adaptation Strategies for Global Change, 16: 25-62.
[2] Mendoza-Ponce, A., Corona-Nunez, R., Kraxner, F., Leduc, S., Patrizio, P. (2018). Identifying effects of land use cover changes and climate change on terrestrial ecosystems and carbon stocks in Mexico. Global Environmental Change, 53: 12-23. https://doi.org/10.1016/j.gloenvcha.2018.08.004
[3] Dhakal, R., Mandal, R.A. (2022). Application of vegetattion indexes to assess carbon stock. Mercator (Fortaleza), 21: e21018. https://doi.org/10.4215/rm2022.e21018
[4] Reang, D., Hazarika, A., Sileshi, G.W., Pandey, R., Das, A.K., Nath, A.J. (2021). Assessing tree diversity and carbon storage during land use transitioning from shifting cultivation to indigenous agroforestry systems: Implications for REDD+ initiatives. Journal of Environmental Management, 298: 113470. https://doi.org/10.1016/j.jenvman.2021.113470
[5] Cardinael, R., Cadisch, G., Gosme, M., Oelbermann, M., Van Noordwijk, M. (2021). Climate change mitigation and adaptation in agriculture: Why agroforestry should be part of the solution. Agriculture, Ecosystems & Environment, 319: 107555. https://doi.org/10.1016/j.agee.2021.107555
[6] Sanusi, S., Mujibussalim, M., Fikri, F. (2013). Perdagangan Karbon Hutan Aceh: Analisis Hukum Pada Tahapan Perencanaan. Kanun Jurnal Ilmu Hukum, 15(1): 41-63.
[7] Fidayanti, N. (2016). Analisis serapan karbondioksida berdasarkan tutupan lahan di kota palangka raya. Jurnal Matematika Sains dan Teknologi, 17(2): 77-85.
[8] Rizki, G.M., Bintoro, A., Hilmanto, R. (2016). Perbandingan emisi karbon dengan karbon tersimpan di hutan rakyat desa buana sakti kecamatan Batanghari Kabupaten Lampung Timur. Jurnal Sylva Lestari, 4(1): 89-96. https://doi.org/10.23960/jsl1489-96
[9] Verstegen, J.A., van der Laan, C., Dekker, S.C., Faaij, A.P., Santos, M.J. (2019). Recent and projected impacts of land use and land cover changes on carbon stocks and biodiversity in East Kalimantan, Indonesia. Ecological Indicators, 103: 563-575. https://doi.org/10.1016/j.ecolind.2019.04.053
[10] Kolis, K., Hiironen, J., Riekkinen, K., Vitikainen, A. (2017). Forest land consolidation and its effect on climate. Land Use Policy, 61: 536-542. https://doi.org/10.1016/j.landusepol.2016.12.004
[11] Achmad, A., Ramli, I., Nizamuddin, N. (2023). Impact of land use and land cover changes on carbon stock in Aceh Besar District, Aceh, Indonesia. Journal of Water and Land Development, 159-166. https://doi.org/10.24425/jwld.2023.145346
[12] Fernandes, M.M., de Moura Fernandes, M.R., Garcia, J.R., Matricardi, E.A.T., de Souza Lima, A.H., de Araújo Filho, R.N., Filho, R.R.G., Piscoya, V.C., Piscoya, T.O.F., Cunha Filho, M. (2021). Land use and land cover changes and carbon stock valuation in the São Francisco River basin, Brazil. Environmental Challenges, 5: 100247. https://doi.org/10.1016/j.envc.2021.100247
[13] Fernandes, M.M., de Moura Fernandes, M.R., Garcia, J.R., Matricardi, E.A., de Almeida, A.Q., Pinto, A.S., Menezes, R.S., de Jesus Silva, A., de Souza Lima, A.H. (2020). Assessment of land use and land cover changes and valuation of carbon stocks in the Sergipe semiarid region, Brazil: 1992-2030. Land Use Policy, 99: 104795. https://doi.org/10.1016/j.landusepol.2020.104795
[14] Achmad, A., Irwansyah, M., Nizamuddin, N., Ramli, I. (2019). Land use and cover changes and their implications on local Climate in Sabang City, Weh Island, Indonesia. Journal of Urban Planning and Development, 145(4): 04019017. https://doi.org/10.1061/(ASCE)UP.1943-5444.0000536
[15] Ngoy, K.I., Qi, F., Shebitz, D.J. (2021). Analyzing and predicting land use and land cover changes in new jersey using multi-layer perceptron – Markov chain model. Earth, 2(4): 845-870. https://doi.org/10.3390/earth2040050
[16] Achmad, A., Ramli, I., Sugiarto, S. (2022). The dynamics of landscape pattern changes in the central aceh region 2009-2019: A preliminary study for sustainable spatial planning. In International Conference on Indonesian Architecture and Planning, Singapore, pp. 479-487.
[17] Cai, W., Peng, W. (2021). Exploring spatiotemporal variation of carbon storage driven by land use policy in the Yangtze River Delta Region. Land, 10(11): 1120. https://doi.org/10.3390/land10111120
[18] Congalton, R.G. (1991). A review of assessing the accuracy of classifications of remotely sensed data. Remote Sensing of Environment, 37(1): 35-46. https://doi.org/10.1016/0034-4257(91)90048-B
[19] Olofsson, P., Foody, G.M., Herold, M., Stehman, S.V., Woodcock, C.E., Wulder, M.A. (2014). Good practices for estimating area and assessing accuracy of land change. Remote Sensing of Environment, 148: 42-57. https://doi.org/10.1016/j.rse.2014.02.015
[20] Ramadhani, F., Pullanagari, R., Kereszturi, G., Procter, J. (2020). Mapping of rice growth phases and bare land using Landsat-8 OLI with machine learning. International Journal of Remote Sensing, 41(21): 8428-8452. https://doi.org/10.1080/01431161.2020.1779378
[21] Achmad, A., Irwansyah, M., Ramli, I. (2018). Prediction of future urban growth using CA-Markov for urban sustainability planning of Banda Aceh, Indonesia. IOP Conference Series: Earth and Environmental Science, 126(1): 012166.
[22] Halmy, M.W.A., Gessler, P.E., Hicke, J.A., Salem, B.B. (2015). Land use/land cover change detection and prediction in the north-western coastal desert of Egypt using Markov-CA. Applied Geography, 63: 101-112. https://doi.org/10.1016/j.apgeog.2015.06.015
[23] Mitsova, D., Shuster, W., Wang, X. (2011). A cellular automata model of land cover change to integrate urban growth with open space conservation. Landscape and Urban Planning, 99(2): 141-153. https://doi.org/10.1016/j.landurbplan.2010.10.001
[24] Gashaw, T., Tulu, T., Argaw, M., Worqlul, A.W. (2017). Evaluation and prediction of land use/land cover changes in the Andassa watershed, Blue Nile Basin, Ethiopia. Environmental Systems Research, 6(1): 1-15. https://doi.org/10.1186/s40068-017-0094-5
[25] Barreira-González, P., Gómez-Delgado, M., Aguilera-Benavente, F. (2015). From raster to vector cellular automata models: A new approach to simulate urban growth with the help of graph theory. Computers, Environment and Urban Systems, 54: 119-131. https://doi.org/10.1016/j.compenvurbsys.2015.07.004
[26] Moghadam, H.S., Helbich, M. (2013). Spatiotemporal urbanization processes in the megacity of Mumbai, India: A Markov chains-cellular automata urban growth model. Applied Geography, 40: 140-149. https://doi.org/10.1016/j.apgeog.2013.01.009
[27] Hairiah, K., Dewi, S., Agus, F., Velarde, S., Ekadinata, A., Rahayu, S., van Noordwijk, M. (2011). Measuring carbon stocks: across land use systems: A manual. Brawijaya University and ICALRRD (Indonesian Center for Agricultural Land Resources Research and Development).
[28] Agus, F., Gunarso, P., Sahardjo, B.H., Harris, N., van Noordwijk, M., Killeen, T.J. (2013). Historical CO2 emissions from land use and land use change from the oil palm industry in Indonesia, Malaysia and Papua New Guinea. Roundtable on Sustainable Palm Oil, 65-88.
[29] Rahayu, S., Lusiana, B., van Noordwijk, M. (2005). Above ground carbon stock assessment for various land use systems in Nunukan, East Kalimantan. In: Lusiana, B., van Noordwijk, M., and Rahayu, S. (eds.) Carbon Stock Monitoring in Nunukan, East Kalimantan: A Spatial and Modelling Approach. Environmental Science, 21-33. World Agroforestry Centre, SE Asia, Bogor, Indonesia.
[30] Saatchi, S.S., Harris, N.L., Brown, S., Lefsky, M., Mitchard, E.T., Salas, W., Zutta, B.R., Buermann, W., Lewis, S.L, Hagen S, Petrova S. (2011). Benchmark map of forest carbon stocks in tropical regions across three continents. In Proceedings of the National Academy of Sciences, 108(24): 9899-904. https://doi.org/10.1073/pnas.1019576108
[31] Asmara, D.H., Dewi, S., Heryawan, F.X., Van Noordwijk, M. (2016). Forest carbon-stock estimates based on national forest inventory data. ALLREDDI Brief 02, World Agroforestry Centre, Bogor.
[32] Istomo, H., Rahayu, S., Permana, E., Suryawan, S.I., Hidayat, A.W. (2006). Monitoring dan evaluasi delineasi potensi areal proyek karbon dan pendugaan cadangan karbon di wilayah kajian taman nasional berbak dan buffer-zone, propinsi jambi dan areal Eks-PLG, Propinsi Kalimantan Tengah. Laporan Kerjasama Penelitian Fakultas Kehutanan IPB dan Wetland International, Bogor.
[33] Jepsen, M.R. (2006). Above-ground carbon stocks in tropical fallows, Sarawak, Malaysia. Forest Ecology and Management, 225(1-3): 287-295. https://doi.org/10.1016/j.foreco.2006.01.005
[34] Agus, F., Santosa, I., Dewi, S., Setyanto, P., Thamrin, S., Wulan, Y.C., Suryaningrum, F. (2013). Pedoman teknis penghitungan baseline emisi dan serapan gas rumah kaca sektor berbasis lahan: Buku I Landasan Ilmiah [Technical guidelines for calculation of baseline greenhouse gas emissions and absorption in the land-based sector: Book I Scientific Foundation]. Jakarta: Badan Perencanaan Pembangunan Nasional, Republik Indonesia, Jakarta.
[35] Sejati, A.W., Buchori, I., Rudiarto, I. (2019). The spatio-temporal trends of urban growth and surface urban heat islands over two decades in the Semarang Metropolitan Region. Sustainable Cities and Society, 46: 101432. https://doi.org/10.1016/j.scs.2019.101432
[36] Estoque, R.C., Murayama, Y., Lasco, R.D., Myint, S.W., Pulhin, F.B., Wang, C., Hijioka, Y. (2018). Changes in the landscape pattern of the La Mesa Watershed–The last ecological frontier of Metro Manila, Philippines. Forest Ecology and Management, 430: 280-290. https://doi.org/10.1016/j.foreco.2018.08.023
[37] Song, W., Deng, X. (2017). Land-use/land-cover change and ecosystem service provision in China. Science of the Total Environment, 576: 705-719. https://doi.org/10.1016/j.scitotenv.2016.07.078
[38] Gemitzi, A., Albarakat, R., Kratouna, F., Lakshmi, V. (2021). Land cover and vegetation carbon stock changes in Greece: A 29-year assessment based on CORINE and Landsat land cover data. Science of the Total Environment, 786: 147408. https://doi.org/10.1016/j.scitotenv.2021.147408
[39] Hermon, D. (2015). Estimate of changes in carbon stocks based on land cover changes in the Leuser Ecosystem Area (LEA) Indonesia. Forum Geografi: Indonesian Juornal of Spatial and Regional Analysis, 29(2): 187-196.
[40] Achmad, A., Fadhly, N., Deli, A., Ramli, I. (2022). Urban growth and its impact on land surface temperature in an industrial city in Aceh, Indonesia. Letters in Spatial and Resource Sciences, 15(1): 39-58. https://doi.org/10.1007/s12076-021-00292-3
[41] Zhang, Y., Sun, L.X. (2019). Spatial-temporal impacts of urban land use land cover on land surface temperature: Case studies of two Canadian urban areas. International Journal of Applied Earth Observation and Geoinformation, 75: 171-181. https://doi.org/10.1016/j.jag.2018.10.005
[42] Salinger, M.J. (2007). Agriculture's influence on climate during the Holocene. Agricultural and Forest Meteorology, 142(2-4): 96-102. https://doi.org/10.1016/j.agrformet.2006.03.024
[43] Toru, T., Kibret, K. (2019). Carbon stock under major land use/land cover types of Hades sub-watershed, eastern Ethiopia. Carbon Balance and Management, 14: 1-4. https://doi.org/10.1186/s13021-019-0122-z
[44] Deng, L., Zhu, G.Y., Tang, Z.S., Shangguan, Z.P. (2016). Global patterns of the effects of land-use changes on soil carbon stocks. Global Ecology and Conservation, 5: 127-138. https://doi.org/10.1016/j.gecco.2015.12.004
[45] Achmad, A., Ramli, I., Irwansyah, M. (2020). The impacts of land use and cover changes on ecosystem services value in urban highland areas. IOP Conference Series: Earth and Environmental Science, 447(1): 012047. https://doi.org/10.1088/1755-1315/447/1/012047
[46] Rahmawati, S., Kiswara, W. (2012). Cadangan karbon dan kemampuan sebagai penyimpan karbon pada vegetasi tunggal Enhalus acoroides di Pulau Pari, Jakarta. Oseanologi Dan Limnologi Di Indonesia, 38(1): 143-150.
[47] Zhang, F., Xu, N., Wang, C., Wu, F., Chu, X. (2020). Effects of land use and land cover change on carbon sequestration and adaptive management in Shanghai, China. Physics and Chemistry of the Earth, Parts A/B/C, 120: 102948. https://doi.org/10.1016/j.pce.2020.102948
[48] Chang, X., Xing, Y., Wang, J., Yang, H., Gong, W. (2022). Effects of land use and cover change (LUCC) on terrestrial carbon stocks in China between 2000 and 2018. Resources, Conservation and Recycling, 182: 106333. https://doi.org/10.1016/j.resconrec.2022.106333
[49] Yue, X., Zhang, T., Shao, C. (2021). Afforestation increases ecosystem productivity and carbon storage in China during the 2000s. Agricultural and Forest Meteorology, 296: 108227. https://doi.org/10.1016/j.agrformet.2020.108227
[50] Xu, X., Yang, G., Tan, Y., Zhuang, Q., Li, H., Wan, R., Su, W., Zhang, J. (2016). Ecological risk assessment of ecosystem services in the Taihu Lake Basin of China from 1985 to 2020. Science of the Total Environment, 554-555: 7-16. https://doi.org/10.1016/j.scitotenv.2016.02.120