Atta-ur Rahman*![]() | Hussam Khalid Abahussin
| Hussam Khalid Abahussin![]() | Mohammed Hamed Alghamdi
| Mohammed Hamed Alghamdi![]() | Ali Abdulelah Alkhwaja
| Ali Abdulelah Alkhwaja![]() | Faisal Abdulaziz Alfawaz
| Faisal Abdulaziz Alfawaz![]() | Ibrahim Abdulelah Alkhwaja
| Ibrahim Abdulelah Alkhwaja![]() | Mohammed Naif Albugami
| Mohammed Naif Albugami![]() | Mustafa Youldash
| Mustafa Youldash![]() | Tahir Iqbal
| Tahir Iqbal![]() | Aghiad Bakry
| Aghiad Bakry![]() | Hesham Abed Al-Musallam
| Hesham Abed Al-Musallam![]()
© 2024 The authors. This article is published by IIETA and is licensed under the CC BY 4.0 license (http://creativecommons.org/licenses/by/4.0/).
OPEN ACCESS
With the explosion of the global population and technological progress, the electricity demand has skyrocketed. To ensure a consistent flow of power, it's essential to accurately predict energy usage ahead of time. Failure to do so could lead to potential outages and disrupt our daily lives. This research reviews previous research in the field of using data mining techniques to analyze electricity consumption data, optimize energy performance of buildings, and predict energy consumption in various industries. The study also aims to uncover patterns, correlations, and rules in electricity consumption worldwide using data mining techniques. The analysis is performed using various data mining techniques, such as simple K-Means and Expectation Maximization (EM). This selection is based on their prominent applications for similar problems in literature. The simple K-Means and EM algorithms showed successful outcomes on the dataset, which is evident in the clustering plots. Further, the performance of the Hierarchical Clustering algorithm was not up to the desired standard. This is probably due to the nature of the available dataset. These outcomes of the analysis will provide a valuable resource for decision-makers and stakeholders in the energy sector, as it will provide a deeper understanding of electricity consumption patterns and trends. This could lead to a sustainable future.
data mining, energy forecasting, data mining, trend analysis, sustainability, clustering algorithms, electricity consumption forecasting
The extensive implementation of smart meters has boosted the quantity available of electricity consumption data, making it a part of Big Data. The emphasis on integrating demand flexibility into the grid system has shifted towards buildings as they are responsible for a significant portion of energy usage, comprising 31% of final energy consumption and over 55% of global electricity demand. Demand response is the adaptation of consumers’ energy consumption patterns in response to changes in the energy system, either by a change in behavior or through automation [1]. The tremendous among of energy used by buildings and the rapid increase in the amount of energy buildings need is pushing the creation of techniques to make buildings consume less energy [2]. The objective of this study is to provide a thorough overview of electricity consumption from different countries around the world using data mining techniques. In addition, it aims to uncover patterns, correlations, and rules in the power usage data that can shed light on energy consumption patterns and trends. The analysis will be performed using various data mining techniques, such as simple K-Means and Expectation Maximization (EM) due to their promising nature in solving similar types of problems found in the literature. The analysis is comprised of two types of time frame factors. Firstly, the algorithms are trained over the past or historic values obtained over a specified timeframe. Secondly, based on the learned patten, future consumption trends are adequately predicted considering the already extracted knowledge. This is mainly the process of prediction using data mining and machine learning [3].
The significance of the proposed study is crucial for the energy sector especially amid the emergence of information and communication technologies (ICT) that cause a huge demand in the energy sector. For instance, cloud servers in cloud computing technology demands huge energy on 24/7 basis to perform the daily operations, demanding sustainable solutions [4-6]. The results of the analysis will be presented in a form that can provide a valuable resource for decision-makers and stakeholders in the energy sector, as it will provide a deeper understanding of electricity consumption patterns and trends, which can inform energy planning and policy. For instance, based on the outcomes of the study, the concerned authorities can plan sustainable demand response strategies at earlier stages to prevent unsolicited circumstances such as power failure [7].
The rest of the paper is organized as follows: Section 2 contains a review of the related literature. Section 3 highlights the investigated methodology in detail. Section 4 presents the experimental results conducted over the dataset while Section 5 concludes the paper.
Corten et al. [8] discussed the use of data mining techniques to optimize the energy performance of buildings. The authors argue that data mining can be used to identify patterns and relationships in energy consumption data, which can then be used to improve the energy efficiency of buildings. To demonstrate the effectiveness of this approach, the authors present a case study in which data mining techniques were used to analyze energy consumption data from a residential building. The results of the analysis showed that data mining was able to identify patterns and relationships in the data that were not apparent from traditional statistical analysis. The authors also discuss the potential benefits of using data mining for energy performance optimization, including the ability to identify and address energy waste, reduce energy costs, and improve the overall energy efficiency of buildings. Overall, the paper presents a compelling case for the use of data mining techniques to optimize energy performance in buildings. The authors provide a thorough review of the literature on the topic and present a well-designed case study to demonstrate the effectiveness of their approach. However, it would be helpful to see additional case studies or larger-scale studies to further validate the findings of this work.
Aki et al. [9] used data mining techniques to analyze real-time electricity data. They divided their work into two main phases, phase one containing data collection, data preprocessing, data understanding, finding k value, and clustering. Phase two is all about the FP-growth Algorithm and the result. The dataset is gathered from six houses in real-time. In the data preprocessing phase, they perform four techniques, data cleaning, data integration, data transformation, and data reduction. Additionally, they used the box plot to represent the dataset in the data understanding phase. Then they used the elbow method to find the number of clusters which is K. After that they apply the clustering, each cluster is assigned a color in the cluster plot. Also, they convert their data to binary values so they can apply the FP-growth algorithm to find frequent patterns.
Sharma [10], in her research paper she wants to produce energy forecasting data mining model. By using data mining techniques her goal is to define the relationship between energy consumption and the weather. They collected data from Australian energy company called Ausgrid and open power system data. She used Machine learning algorithm, the data sets spited into testing and training, to avoid underfitting and overfitting they used a cross validation method. In the preprocessing phase, to avoid outliers and continuously measure the accuracy they used anomaly detection methods like support vector anomaly detection, and clustering-based anomaly detection, and density-based anomaly detection. Finally, the outcomes from anomaly detection methods were used for developing unified model that can provide more accuracy for short term, and medium term and long-term forecasting.
Ebrahim and Mohammed [11] introduced an innovative methodology to enhance household demand forecasting based on energy disaggregation for Short Term Load Forecasting. They applied five data mining disaggregation algorithms in their study by utilizing data mining techniques, and they also used feed-forward artificial neural networks to approach and pre-process the energy disaggregation process. They started using five distinct methods of energy disaggregation for a set of data pertaining to two separate houses. Denoising autoencoder (DAE), RECTANGLES, recurrent neural network (RNN), factorial hidden Markov model (FHMM), and combinatorial optimization (CO) were applied and analyzed in various combinations. Then they utilized it to test the used energy disaggregation approaches and provide a thorough evaluation of their performance, seven performance criteria were used. They were RECTANGLES + FFANN, DAE + FFANN, RNN + FFANN, FHMM + FFANN, CO + FFANN, FFANN, SVM, and autoregressive integrated moving average (ARIMA). They also discovered that denoising autoencoder, which had a direct impact on the efficiency of the STLF at the individual household scale and that was the best method for energy disaggregation. When compared to ARIMA, the suggested approach (DEA + FFANN) results in a 91.13% reduction in root mean square error (RMSE) and normalized RMSE (NRMSE) and a 92.36% reduction in mean absolute error (MAE), according to a great comparison and performance analysis.
Kim and Cho [12] proposed a model called CNN-LSTM neural network that can successfully forecast the energy usage of homes by extracting spatial and temporal parameters. The CNN-LSTM neural network combines two techniques which are CNN and LSTM. CNN is known as convolutional neural network while the LSTM is called long short-term memory. The combined technique has demonstrated via experiments its ability to extract intricate details of energy use. The features between various factors that impact power consumption may be extracted using the CNN layer. Modeling temporal data of erratic tendencies in time series elements is ideal for the LSTM layer. For the usage of electric energy, which was previously difficult to forecast, the suggested CNN-LSTM technique yields nearly perfect prediction performance. The authors of the paper verified that, without relying on time resolution, their model beats other models in terms of performance.
Wei et al. [13] examine the prevalent data-driven strategies employed in building energy analysis at various levels of granularity and typology, including those strategies for prediction. Some of the methods are support vector machine (SVM), artificial neural networks (ANN), statistical regression, decision trees, and genetic algorithms. In addition, the review's findings show that data-driven approaches have successfully addressed a wide range of applications related to building energy, including load forecasting and prediction, energy pattern profiling, mapping regional energy consumption, benchmarking for building stocks, global retrofit strategies, and developing guidelines, among others. A few crucial tasks for modifying data-driven methodologies in the context of application to building energy analysis are refined in this review, which is significant. By performing the necessary retrofits and using renewable energy technology, the results reached in this research may help future micro-scale adjustments in the energy usage of a specific building. Additionally, it opens a door for prospective macro-scale energy-reduction research while taking customer desires into account. All of these will be helpful in developing a stronger long-term urban sustainability plan.
The study's findings by Fan et al. [14] are based on a cluster analysis of electricity demand information from 1,000 Swiss residences. To assess the suitability of various building archetypes (hospitals, schools, offices, hotels, apartments, households, etc.) for demand response programs, patterns of electricity use must be identified. The authors created four criteria to gauge each archetype's capacity for demand flexibility, ramp rates, and peak management. The findings demonstrated that the various archetypes' patterns of electricity use varied significantly and that occupant schedules had an impact on load profiles, peak intensities, and ramp rates. When compared to the non-domestic sector, the domestic sector (houses and apartments) had greater peak intensities, making it a target for peak reduction plans. Except for schools, mansions, and commercial buildings, the non-domestic sector, on the other hand, gave more possibilities for flexibility. The authors concluded that because of the flexibility of their demand, households should be encouraged to participate in dynamic energy tariffs. However, carefully planned programs with both financial and social components are required to foster acceptance.
Liu et al.’s [2] study report offered a data-mining-based method for assessing the variable refrigerant flow (VRF) system's dynamic energy performance. Moreover, it discovered issues with the energy assessment of the VRF system by analyzing the energy data gathered from experiments on a 29.8 kW type VRF system. The research put up a generic framework for assessing energy performance based on data-mining methods, including correlation analysis and decision tree (DT) analysis to address these issues. The findings demonstrated that the power consumption of the VRF system was highly impacted by both the PLR and OT, and that the power consumption patterns controlled how much the refrigerant charge fault affected system power consumption. To give a quantitative evaluation of the power consumption of the VRF system, the study produced nine energy benchmarks and created an energy consumption rating system. The proposed method for assessing the dynamic energy performance of the VRF system was found to be accurate and reasonable. Their future studies will focus on applying the proposed method to more operational conditions.
Aki et al. [9] present an approach for predicting the energy consumption for the next-day and peak power demand. The approach consists of three main steps. First, delete the unusual energy consumption, such as outliers. Second, they used an embedded variable selection method which is recursive feature elimination (RFE), to obtain the optimal inputs which will be used later in the eight prediction models that were separately developed using popular algorithms. Then these parameters will be obtained through level-group-out cross validation (LGOCV). Finally, they used a genetic algorithm (GA) to optimize the weight of the eight prediction models. Moreover, they used the mean absolute percentage error (MAPE) to measure the prediction accuracy of the ensemble model. The accuracy for the next-day energy consumption was 2.32% while for the peak power demand 2.85%. Data mining was used in the study by Wang et al. [15] to analyze energy usage and optimize dorm buildings. To increase accuracy and improve the quality of the data, outliers, and missing values are removed during the preprocessing stage. They also utilized the survey to compare how much energy each student was using. Additionally, the energy consumption analysis was conducted using the K-means clustering technique. Moreover, they initially standardized their data, then used the Mclust algorithm to discover the best number of clusters, which revealed that the data could be categorized into five categories. Furthermore, a decision tree can categorize the gathered dormitory attributes into four groups with a 91.3% classification accuracy. The result shows that 15.8% of the energy consumption can be reduced when the subject category is studied.
The study conducted by Sathishkumar et al. [16] in 2020 focuses on using data mining techniques to predict energy consumption in the steel industry. The study is centered around the use of data from the DAEWOO steel company, which includes current reactive power, carbon dioxide emission levels, power factor, and load types. General Linear Regression, SVM with Radial Basis Kernel, K Nearest Neighbor, Random Forest, and Regression Trees were just a few of the prediction models that were examined. The findings were assessed using Mean Absolute Error, Root Mean Squared Error, Mean Absolute Percentage Error, and Coefficient of Variation before the highest performing model was chosen. The findings showed that the Random Forest model was the most effective in predicting energy consumption and outperformed the other algorithms. The study highlights the importance of energy consumption prediction for energy production companies and the need to reduce energy usage for the benefit of the environment, economy, and domestic consumers. It specifically focuses on the fast-growing manufacturing industry in South Korea and the increasing electricity consumption in the industrial sector. The authors aim to provide a data-mining-based solution to manage energy consumption within the industry. The authors advise further research in this area and state that the data show the Random Forest model to be the most accurate at predicting energy usage in the steel sector. Zhao [17] proposes a prediction method for energy saving in public buildings based on data mining. The research starts by analyzing a large amount of data generated by the energy consumption monitoring system of public buildings to extract valuable information and relevant information. The study focuses on finding the distribution law of regional energy consumption influencing factors and energy consumption parameters and proposes an energy-saving transformation prediction of the energy consumption stochastic model. To do this, the author uses the idea of reverse modeling to establish a prediction stochastic model for energy-saving transformation. In this model, a genetic algorithm is used to optimize the sub-tree generation process of the gradient lifting decision tree and improve the short-term prediction accuracy of the C4.5 decision tree. The results of the studies demonstrate that this model has a greater prediction accuracy than conventional regression models and has some generalizability for various building equipment energy consumption data. The author concludes that the model is promising for predicting energy consumption and improving energy efficiency in public buildings.
Ali et al. [18] discuss that by establishing a more robust communication mechanism between consumer and supplier, Smart Grid enhances the architecture of the electrical grid. Data on customer electrical load profiles is now more readily available because of the use of smart meters. The researchers believe that the analysis of the data on electricity use is a key problem in improving and efficiently developing this new power system. Therefore, they decided that data mining techniques are the best analytical procedure to use when analyzing energy use or achieving their goal. They employed data mining approaches such as frequent patterns mining and association rule mining, clustering, classification and characterization, and outlier detection, in addition to exploratory data analysis and preprocessing. They described and assessed the strategies that are most effective for comprehending data from electrical load profiles. For instance, clustering aided them in identifying which household appliances consume more energy than others in this dataset. Peak reduction and peak analysis would both benefit from this. However, the clustering prediction result in their datasets was not very significant with 63.28% accuracy. They believe that in the future, they can enhance the results by using them in real-time or with more granular statistics like seasonal and user sociodemographic data.
Rathod and Garg [19] argue that data mining methods are employed on geographical characteristics like rivers, farms, ground, and highways to derive information about power usage regarding atmospheric temperature and physical distance. These methods are employed to identify regional power consumption patterns in a city. In addition, they discuss that different temperature and consumer groups are categorized according to how much electricity they consume using the K-means clustering approach. Using association rule analysis, rules on electricity consumption are developed to define the effects of the physical separation between natural geographic objects and various places. The approaches that the researchers followed involve pre-processing data, using data mining algorithms, and interpreting the knowledge they have found. Real datasets of over 20,000 Sangli city consumers are utilized to validate their proposed work. Ren et al. [20] conducted a study that looked at the electricity heating system efficiency of 62 apartments in an average rent price housing complex using data mining techniques. The results showed that data mining techniques are a valuable tool for analyzing huge sets of electricity performance data and shown usage patterns of residency comfort and heating operations numerically. The clustering analysis identified six unique patterns of room temperature demand, with most households falling into three of these patterns. The decision tree algorithm linked comfort demand class and heating system performance with heating electricity consumption, providing a valuable tool for constructing heating systems in average rent price housing. The room temperature patterns can be used to enhance thermostat settings and provide more accurate electricity simulations. This research shows the advantages of using data mining techniques to gain in depth into occupant behavior and increase electricity efficiency in low-income housing.
Song et al. [21] did a study about Accurate predictions scores of electricity consumption. He founded that the Accurate predictions scores of electricity consumption are critical for electricity efficiency in buildings. Despite enhancements, two major challenges remain in predicting electricity use based on residency data: a lack of consideration for variation among building residency and weak correlation between residency and electricity consumption. To address these challenges, the research faced the impact of residency characteristics on electricity prediction performance. Comparative experiments using data mining-based model techniques were used, leading to two key findings. Firstly, residency characteristics significantly impact prediction accuracy score. The GL-2 model was found to have the highest accuracy score but required longer network training. Secondly, the proposed model provided acceptable accuracy score with minimal historical data, with all results within the acceptable tolerance range value. The research advances our understanding of residency impact on electricity prediction and provides a practical solution with minimal data requirements. Liu et al. [22] proposed a framework based on data mining is suggested for extracting typical electrical load patterns TELPs and gleaning useful data from the patterns for specific buildings. Data preparation, TELP identification, and knowledge discovery are the three stages of the framework. It is suggested to use a two-step clustering analysis approach to find TELPs. This method minimizes the dimensions of daily energy consumption data, finds outliers, and combines patterns with similar characteristics to find TELPs. A comparison of the method's performance with two single-step clustering algorithms revealed its efficacy. The findings indicated that day type working, or non-working day and outside air temperature were the primary characteristics that separated TELPs. The framework offers a broad and methodical methodology for examining patterns of power use and could identify unusual electrical load profiles early on. Limitations, however, include the requirement for a more data-adaptive feature extraction approach, more framework validation with a bigger dataset, and developing subsystems. Finally, in a study conducted by Stjelja et al. [23] for building occupancy levels will be ascertained using sub-metered power and water use and machine learning techniques. A supervised data mining technique using Random Forest and an unsupervised data mining technique utilizing k-means clustering were both put to the test in this study. The study's findings demonstrated that, when utilizing the supervised technique and all available predictors, it is possible to forecast the number of people in an office using sub-metered water and power use. The training dataset should ideally be at least one to three months long. The unsupervised technique demonstrated that utilizing sub-metered office equipment power use, it is feasible to cluster the days into three occupancy levels (high, medium, and low) without the necessity for ground truth. The study found that utilizing lighting, power, and water use to gauge occupancy was not as effective as the unsupervised technique. Musleh and AlMetric proposed ensemble machine learning approaches to predict midterm electricity consumption prediction on a local dataset in Saudi Arabia [24, 25]. Based on the thorough literature review following can be concluded:
1. Data mining in the energy sector is among the hottest areas of research and promising in various ways.
2. Various algorithms have been investigated and, in many cases, Random Forest was found to be better due to its ensemble nature where decision is made by various trees consortium.
3. Most of these studies utilized categorical or class-based data, where each instance was labeled to a specific class.
4. That is why mainly it was dealt with as a classification problem.
5. The preprocessing techniques in such kind of datasets are mostly common.
However, in the current study, the dataset was not labelled. That is why we have investigated clustering approaches rather than classification. However, in the future, classification techniques can be employed on the labeled dataset.
3.1 Dataset description
The World Energy Consumption dataset in study [26], available on the “Our World in Data” website, is a comprehensive and open dataset that provides a wealth of information on energy consumption patterns around the world.
The dataset includes data on primary energy consumption, per capita energy consumption, and growth rates for various countries, as well as the energy mix and electricity mix for each country. With a temporal range of 1900 to 2021, this dataset offers a historical perspective on energy consumption trends across the globe. Additionally, the dataset includes a variety of other relevant metrics, such as data on energy efficiency and conservation measures, economic and population growth, and carbon emission. With over 22500 records, this dataset is an invaluable resource for researchers, policymakers, and anyone interested in understanding the global energy landscape. The description includes the attribute number and names, minimum and maximum values, measurement units and number of distinct values (DVs) in the dataset. After due preprocessing, it is worth noting that there are no missing values against each attribute and all attributes belong to nominal data type. The yearly consumption unit is kilowatt per hour (kWh), megawatt per hour (mWh) and terawatt per hour (tWh). Table 1 shows the dataset description which includes the attribute information and its various details like min, max and unit.
3.2 Data preprocessing
Prior to utilizing the World Energy Consumption dataset, we employed a thorough pre-processing procedure to ensure the integrity and accuracy of the data [27-32]. Specifically, we removed any missing values by replacing them with a more appropriate constant value. We also removed any countries or state federations that did not contain any data, to eliminate any potential errors, discrepancies, and inconsistencies in the dataset. Consequently, the dataset was cleaned and ready to be investigated by the data mining algorithms.
3.3 Statistical analysis
This section provides the statistical analysis of the dataset which will eventually be helpful during the modelling, designing and analysis phase [33-37]. That mainly includes:
·Mean
·Median
·Mode
·Standard deviation
·Variance
·Range
·Percentile
·Inter quartile difference.
Table 2 in the Appendix presents a complete summary of the statistical analysis of the dataset being used in the study.
Table 1. Dataset description
|
# |
Name |
Min. |
Max. |
Unit (yearly) |
DV |
|
1 |
country |
None |
None |
None |
0 |
|
2 |
year |
2000 |
2016 |
None |
0 |
|
3 |
population |
1833 |
4502955714 |
None |
3552 |
|
4 |
coal_cons_per_capita |
.000 |
36742.305 |
kWh |
1322 |
|
5 |
coal_consumption |
.000 |
32904.273 |
tWh |
1252 |
|
6 |
coal_elec_per_capita |
.000 |
8789.417 |
kWh |
1294 |
|
7 |
coal_electricity |
.00 |
6476.05 |
tWh |
944 |
|
8 |
coal_prod_per_capita |
.000 |
151662.281 |
kWh |
1217 |
|
9 |
coal_production |
.000 |
29869.480 |
tWh |
1118 |
|
10 |
electricity_generation |
.000 |
12158.511 |
tWh |
1727 |
|
11 |
energy_per_capita |
.000 |
657539.188 |
kWh |
3522 |
|
12 |
gas_consumption |
.000 |
13336.904 |
tWh |
1331 |
|
13 |
gas_elec_per_capita |
.000 |
20329.850 |
kWh |
1704 |
|
14 |
gas_electricity |
.00 |
2358.16 |
tWh |
1140 |
|
15 |
gas_energy_per_capita |
.000 |
210818.062 |
kWh |
1343 |
|
16 |
gas_prod_per_capita |
.000 |
852961.562 |
kWh |
1571 |
|
17 |
gas_production |
.000 |
12757.347 |
tWh |
1335 |
|
18 |
oil_consumption |
8.255 |
23536.893 |
tWh |
1388 |
|
19 |
oil_elec_per_capita |
.000 |
11547.416 |
tWh |
2972 |
|
20 |
oil_electricity |
.00 |
623.18 |
tWh |
673 |
|
21 |
oil_energy_per_capita |
288.5 |
147073.891 |
kWh |
1394 |
|
22 |
oil_prod_per_capita |
.000 |
745927.000 |
kWh |
1661 |
|
23 |
oil_production |
.000 |
23247.154 |
tWh |
1423 |
|
24 |
per_capita_electricity |
.000 |
56755.715 |
kWh |
3458 |
|
25 |
primary_energy_consumption |
.000 |
77189.898 |
tWh |
3303 |
Table 2. Statistical analysis of the dataset
|
Attribute |
Mean |
Median |
Mode |
Std. Dev. |
Variance |
Range |
Percentiles |
IQR |
|
|
Q1 |
Q3 |
||||||||
|
country |
Not Applicable |
Not Applicable |
Not Applicable |
Not Applicable |
Not Applicable |
Not Applicable |
Not Applicable |
Not Applicable |
Not Applicable |
|
year |
2008.0 |
2008.0 |
2000.0 |
4.9 |
24.0 |
16.0 |
2004.0 |
2012.0 |
8.0 |
|
population |
60957416.0 |
6254570.5 |
1833.0 |
319271331.4 |
101934183022086000.0 |
4502953881.0 |
916800.8 |
23595041.5 |
22678240.8 |
|
coal_cons_per_capita |
5668.8 |
5668.8 |
5668.8 |
4344.5 |
18874378.9 |
36742.3 |
5668.6 |
5668.8 |
0.2 |
|
coal_consumption |
876.4 |
876.4 |
876.4 |
2215.9 |
4910430.6 |
32904.3 |
133.2 |
876.4 |
743.2 |
|
coal_elec_per_capita |
548.0 |
0.0 |
0.0 |
1218.2 |
1483963.6 |
8789.4 |
0.0 |
399.7 |
399.7 |
|
coal_electricity |
70.1 |
0.0 |
0.0 |
415.0 |
172251.7 |
6476.1 |
0.0 |
6.0 |
6.0 |
|
coal_prod_per_capita |
2693.8 |
0.0 |
0.0 |
11490.4 |
132028888.0 |
151662.3 |
0.0 |
197.0 |
197.0 |
|
coal_production |
344.3 |
0.0 |
0.0 |
2088.5 |
4361883.9 |
29869.5 |
0.0 |
4.1 |
4.1 |
|
electricity_generation |
163.7 |
7.1 |
0.0 |
786.2 |
618104.0 |
12158.5 |
0.6 |
47.0 |
46.3 |
|
energy_per_capita |
28073.5 |
14486.9 |
28073.5 |
43492.1 |
1891566947.1 |
657539.2 |
3780.2 |
37334.4 |
33554.3 |
|
gas_consumption |
582.5 |
582.5 |
582.5 |
987.5 |
975060.1 |
13336.9 |
293.8 |
582.5 |
288.8 |
|
gas_elec_per_capita |
872.2 |
1.6 |
0.0 |
2411.1 |
5813443.9 |
20329.9 |
0.0 |
872.2 |
872.2 |
|
gas_electricity |
34.7 |
0.0 |
0.0 |
157.9 |
24932.1 |
2358.2 |
0.0 |
13.5 |
13.5 |
|
gas_energy_per_capita |
13313.2 |
13313.2 |
13313.2 |
15560.0 |
242113524.4 |
210818.1 |
9794.3 |
13313.2 |
3518.9 |
|
gas_prod_per_capita |
10977.1 |
0.0 |
0.0 |
53882.3 |
2903298694.7 |
852961.6 |
0.0 |
1493.0 |
1493.0 |
|
gas_production |
237.8 |
0.0 |
0.0 |
1055.8 |
1114719.4 |
12757.3 |
0.0 |
46.5 |
46.5 |
|
oil_consumption |
984.2 |
984.2 |
984.2 |
1722.7 |
2967821.6 |
23528.6 |
370.4 |
984.2 |
613.9 |
|
oil_elec_per_capita |
823.9 |
138.5 |
0.0 |
1790.0 |
3204042.6 |
11547.4 |
18.5 |
609.2 |
590.6 |
|
oil_electricity |
9.0 |
0.6 |
0.0 |
42.8 |
1832.8 |
623.2 |
0.1 |
4.2 |
4.1 |
|
oil_energy_per_capita |
17289.2 |
17289.2 |
17289.2 |
11921.4 |
142120600.7 |
146785.3 |
17022.0 |
17289.2 |
267.1 |
|
oil_prod_per_capita |
16984.5 |
0.0 |
0.0 |
68926.7 |
4750892323.6 |
745927.0 |
0.0 |
2661.3 |
2661.3 |
|
oil_production |
390.4 |
0.0 |
0.0 |
1697.0 |
2879766.2 |
23247.2 |
0.0 |
48.9 |
48.9 |
|
per_capita_electricity |
3548.5 |
1875.9 |
0.0 |
5039.3 |
25394655.4 |
56755.7 |
368.5 |
4989.0 |
4620.5 |
|
primary_energy_consumption |
1125.2 |
52.2 |
1125.2 |
5350.7 |
28629981.4 |
77189.9 |
7.8 |
349.5 |
341.7 |
3.4 Graphical representation of data
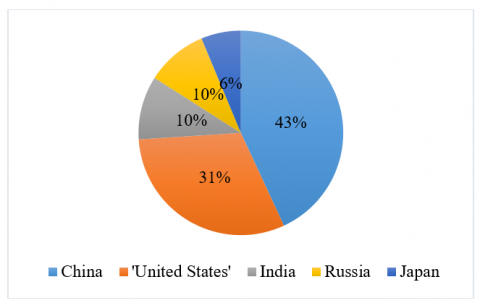
This section contains the graphical representation of various aspects of the data. Visual representation plays a pivotal role in the data mining and knowledge discovery process [38-42]. Data visualization techniques are used to demonstrate various aspects. Figure 1 presents the energy consumption period mainly ranging from year 2000 to year 2016. It shows that energy consumption has been increased significantly over the years. Figure 2 and Figure 3 present the top five countries in the world with most energy consumption and energy generation. In this regard, China, USA, India, Russia, and Japan are top of the list. The purpose behind depicting the top five countries is that they cover a significant part of the overall energy consumption around the globe. It is further crucial to see the overall impact on the energy sector around the globe. It is also evident that these countries are either tech giants or densely populated or both. That clearly reflects the major factors for energy consumption. These trends are evident that in the future this demand is increasing significantly.
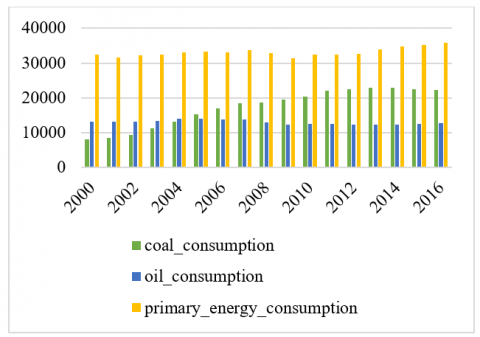
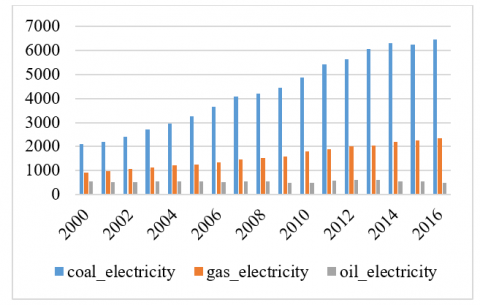
Figure 4 presents the yearly consumption comparison among various courses such as coal, oil, and energy. In this regard, primary energy consumption was more followed by coal and oil, respectively. Likewise, Figure 5 presents comparison among electricity production means. In this regard, coal-based electricity production was more than gas and oil-based production, respectively.
Figure 1. Energy consumption period
Figure 2. Top 5 countries consumption energy
Figure 3. Top 5 countries generation energy
Figure 4. Comparison among coal, oil, and energy consumption
Figure 5. Comparison among coal, gas, and oil electricity
3.5 Data mining models
Data mining models are algorithms and mathematical approaches used to extract information from data, and they play a crucial role in the field of data mining. These models can be used for a variety of tasks, including classification, clustering, association rule mining, and anomaly detection. Some of the popular data mining models are simple K-Means, and Expectation Maximization (EM). Each model has its own strengths and weaknesses and is ideal for different types of data types and implementations. Choosing a data mining model often depends on the specific problem that needs to be solved, the characteristics of the data, and the desired outcome.
4.1 Simple K-Means
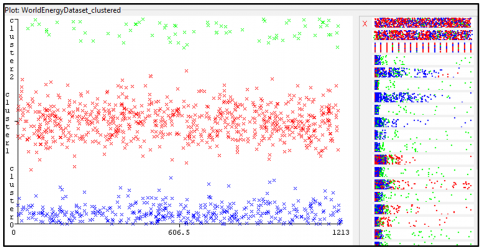
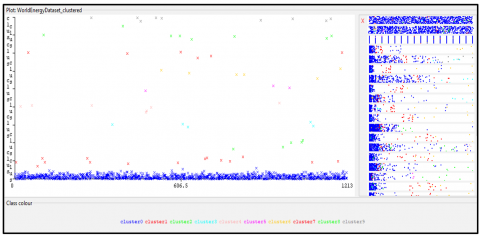
Simple K-Means clustering is a basic clustering algorithm. It is a straightforward and extensively used clustering algorithm the mechanism behind it is partitioning. It divides n pieces of data into k groups, where k is the number of clusters that the user has defined. Each item in a cluster is placed so that it is closest to the cluster's mean. The Euclidean distance is the unit of measurement used by the K-Means method to determine the distance between an object and the centroid. The process goes on until there is no net change left [43-46]. Figure 6 presents the clustering plot using a simple K-Means algorithm. Consequently, there are 10 clusters from 0 to 9 as given in the figure’s legend. Which depicts more energy consumption in the green (cluster 2), red (cluster 1), yellow (cluster 6), and blue (cluster 3) zones countries while others are on relatively lesser sides. The diagram further demonstrates the energy consumption patterns and based on their usage patterns; clusters are formed. Thicker regions present more while thinner regions present a lesser energy consumption rate.
Figure 6. Clustering plot of simple K-Means
4.2 Expectation Maximization (EM)
The Expectation Maximization (EM) algorithm is more efficient than existing algorithms in terms of data loss. The EM algorithm is proven to converge to the most likely estimate of the original distribution based on altered data. When large amounts of data are available, the EM algorithm provides good estimation of the original distribution [47-50]. Figure 7 shows the clustering output of EM algorithm. The figure demonstrates three clusters as an outcome of the algorithm, namely cluster 0, 1 and 2 represented by blue, red and green colors, respectively. Cluster 1 represents the highest energy consumption, followed by cluster 0 and finally cluster 2.
Figure 7. Clustering plot of EM
4.3 Hierarchical clustering
Hierarchical clustering is a technique for grouping data into clusters that creates a hierarchy of clusters. However, the results of this method can be reduced by the impossibility to adjust a merge or split decision once it has been made. Enhancing the quality of hierarchical clustering can be reached by combining it with other algorithms for multi-stages clustering [51-59]. Figure 8 presents the output of hierarchical clustering algorithm. Resulting in ten clusters 0-9 where cluster 0 represents the highest energy consumption country.
Figure 8. Hierarchical cluster figure
In conclusion, the application of data mining techniques demonstrates how it is possible to make wise judgments and drive positive change in the energy sector. The findings of this research highlight the significance of data-driven decision-making, which can help build a more effective energy policy and meet the challenges of the future. The world's energy sector faces significant challenges in meeting rising demand, reducing costs, and increasing energy efficiency. However, the solution to these problems may lie in the vast volumes of data available. By using data mining techniques, it is possible to examine global electricity consumption data and uncover valuable insights and trends. This research shows the favorable outcomes obtained from simple K-Means and EM algorithms applied to the dataset, in contrast to Hierarchical clustering algorithm. These insights provide valuable information for decision-making in the energy sector, enabling better cost management and a more effective energy policy. The findings from this analysis can also serve as a platform for future research and development in the field. Data-driven decision-making is crucial for the energy sector, and continued investment in data mining techniques is necessary to confront the future challenges of the industry. The development of deep learning and hybrid approaches can offer even greater insights and further contribute to positive change [60-64].
[1] Yilmaz, S., Chambers, J., Li, X., Patel, M.K. (2021). A comparative analysis of patterns of electricity use and flexibility potential of domestic and non-domestic building archetypes through data mining techniques. Journal of Physics: Conference Series, 2042(1): 012021. https://doi.org/10.1088/1742-6596/2042/1/012021
[2] Liu, J., Wang, J., Li, G., Chen, H., Shen, L., Xing, L. (2017). Evaluation of the energy performance of variable refrigerant flow systems using dynamic energy benchmarks based on data mining techniques. Applied Energy, 208: 522-539. https://doi.org/10.1016/j.apenergy.2017.09.116
[3] Gollapalli, M., Rahman, A., Hakami, O., Alhashim, M., Arab, B., Almashharwai, F., Youldash, M., Saadeldeen, A., Alturkey, A., Alkhulaifi, D. (2023). Predictive modeling of NEAR cryptocurrency pricing using deep learning: Influence of Bitcoin market movements. Mathematical Modelling of Engineering Problems, 10(6): 2255-2264. https://doi.org/10.18280/mmep.100641
[4] Alhaidari, F., Rahman, A., Zagrouba, R. (2023). Cloud of Things: Architecture, applications and challenges. Journal of Ambient Intelligence and Humanized Computing, 14(5): 5957-5975. https://doi.org/10.1007/s12652-020-02448-3
[5] Ahmad, M., Qadir, M.A., Rahman, A., Zagrouba, R., Alhaidari, F., Ali, T., Zahid, F. (2023). Enhanced query processing over semantic cache for cloud based relational databases. Journal of Ambient Intelligence and Humanized Computing, 14: 5853-5871. https://doi.org/10.1007/s12652-020-01943-x
[6] Ibrahim, N.M., Musleh, D., Khan, M.A.A., Chabani, S., Dash, S. (2022). Cloud-based smart grids: Opportunities and challenges. Biologically Inspired Techniques in Many Criteria Decision Making: Proceedings of BITMDM 2021, pp. 1-13. https://doi.org/10.1007/978-981-16-8739-6_1
[7] Mukhtar, M., Yunus, F., Li, J., Mahmood, T., Ali, Y.A.A. (2023). Future Prospects and Challenges of On-Demand Mobility Management Solutions. IEEE Access, 11: 114864-114879. https://doi.org/10.1109/ACCESS.2023.3324297
[8] Corten, K., Willems, E., Walker, S., Zeiler, W. (2019). Energy performance optimization of buildings using data mining techniques. In E3S Web of Conferences, 111: 5016.
[9] Aki, A., Reddy, D.K.M., Reddy, Y.K., Kavitha, C.R., Sasikala, T. (2017). Analyzing the real time electricity data using data mining techniques. In 2017 International Conference on Smart Technologies for Smart Nation (SmartTechCon), pp. 545-549. https://doi.org/10.1109/SmartTechCon.2017.8358431
[10] Sharma, E. (2018). Energy forecasting based on predictive data mining techniques in smart energy grids. Energy Informatics, 1(Suppl 1): 44. https://doi.org/10.1186/s42162-018-0048-9
[11] Ebrahim, A.F., Mohammed, O.A. (2018). Pre-processing of energy demand disaggregation based data mining techniques for household load demand forecasting. Inventions, 3(3): 45. https://doi.org/10.3390/inventions3030045
[12] Kim, T.Y., Cho, S.B. (2019). Predicting residential energy consumption using CNN-LSTM neural networks. Energy, 182: 72-81. https://doi.org/10.1016/j.energy.2019.05.230
[13] Wei, Y., Zhang, X., Shi, Y., Xia, L., Pan, S., Wu, J., Han, M., Zhao, X. (2018). A review of data-driven approaches for prediction and classification of building energy consumption. Renewable and Sustainable Energy Reviews, 82: 1027-1047. https://doi.org/10.1016/j.rser.2017.09.108
[14] Fan, C., Xiao, F., Wang, S. (2014). Development of prediction models for next-day building energy consumption and peak power demand using data mining techniques. Applied Energy, 127: 1-10. https://doi.org/10.1016/j.apenergy.2014.04.016
[15] Wang, J., Zhong, Z., Fan, C., Yu, B., Sun, Y. (2019). Research on energy consumption analysis and optimization of dormitory buildings based on data mining. In International Symposium on Advancement of Construction Management and Real Estate, pp. 1695-1710. https://doi.org/10.1007/978-981-15-8892-1_119
[16] Sathishkumar, V.E., Lim, J., Lee, M., Cho, K., Park, J., Shin, C., Cho, Y. (2020). Industry energy consumption prediction using data mining techniques. International Journal of Energy, Information and Communications, 11(1): 7-14. http://dx.doi.org/10.21742/ijeic.2020.11.1.02
[17] Zhao, X. (2021). Energy saving prediction method for public buildings based on data mining. In 2021 13th International Conference on Measuring Technology and Mechatronics Automation (ICMTMA), pp. 484-487. https://doi.org/10.1109/ICMTMA52658.2021.00111
[18] Ali, U., Buccella, C., Cecati, C. (2016). Households’ electricity consumption analysis with data mining techniques. In IECON 2016-42nd Annual Conference of the IEEE Industrial Electronics Society, pp. 3966-3971. https://doi.org/10.1109/IECON.2016.7793118
[19] Rathod, R.R., Garg, R.D. (2016). Regional electricity consumption analysis for consumers using data mining techniques and consumer meter reading data. International Journal of Electrical Power & Energy Systems, 78: 368-374. https://doi.org/10.1016/j.ijepes.2015.11.110
[20] Ren, X., Yan, D., Hong, T. (2015). Data mining of space heating system performance in affordable housing. Building and Environment, 89: 1-13. https://doi.org/10.1016/j.buildenv.2015.02.009
[21] Song, K., Kwon, N., Anderson, K., Park, M., Lee, H.S., Lee, S. (2017). Predicting hourly energy consumption in buildings using occupancy-related characteristics of end-user groups. Energy and Buildings, 156: 121-133. https://doi.org/10.1016/j.enbuild.2017.09.060
[22] Liu, X., Ding, Y., Tang, H., Xiao, F. (2021). A data mining-based framework for the identification of daily electricity usage patterns and anomaly detection in building electricity consumption data. Energy and Buildings, 231: 110601. https://doi.org/10.1016/j.enbuild.2020.110601
[23] Stjelja, D., Jokisalo, J., Kosonen, R. (2020). From electricity and water consumption data to information on office occupancy: A supervised and unsupervised data mining approach. Applied Sciences, 10(24): 9089. https://doi.org/10.3390/app10249089
[24] Musleh, D.A., Al Metrik, M.A. (2023). Machine learning and bagging to predict midterm electricity consumption in Saudi Arabia. Applied System Innovation, 6(4): 65. https://doi.org/10.3390/asi6040065
[25] Al Metrik, M.A., Musleh, D.A. (2022). Machine learning empowered electricity consumption prediction. Computers, Materials & Continua, 72: 1427-1444. http://dx.doi.org/10.32604/cmc.2022.025722
[26] Ritchie, H., Roser, M., Rosado, P. (2022). Energy. Our World in Data. https://ourworldindata.org/energy
[27] Ahmed, M.I.B., Saraireh, L., Rahman, A., et al. (2023). Personal protective equipment detection: A deep-learning-based sustainable approach. Sustainability, 15(18): 13990. https://doi.org/10.3390/su151813990
[28] Ahmed, M.I.B., Alabdulkarem, H., Alomair, F., et al. (2023). A deep-learning approach to driver drowsiness detection. Safety, 9(3): 65. https://doi.org/10.3390/safety9030065
[29] Musleh, D.A., Olatunji, S.O., Almajed, A.A., et al. (2023). Ensemble learning based sustainable approach to carbonate reservoirs permeability prediction. Sustainability, 15(19): 14403. https://doi.org/10.3390/su151914403
[30] Qamar, R.A., Sarfraz, M., Rahman, A., Ghauri, S.A. (2023). Multi-criterion multi-UAV task allocation under dynamic conditions. Journal of King Saud University-Computer and Information Sciences, 35(9): 101734. https://doi.org/10.1016/j.jksuci.2023.101734
[31] Aljameel, S.S., Rahman, A.U. (2023). Enhancing multi-user detection in multicarrier 5G and beyond: A space-time spreading approach with parallel interference cancellation. Mathematical Modelling of Engineering Problems, 10(4): 1207-1215. https://doi.org/10.18280/mmep.100413
[32] Ahmed, M.S., Rahman, A., AlGhamdi, F., et al. (2023). Joint diagnosis of pneumonia, COVID-19, and tuberculosis from chest X-ray images: A deep learning approach. Diagnostics, 13(15): 2562. https://doi.org/10.3390/diagnostics13152562
[33] Ahmed, M.I.B., Alotaibi, R.B., Al-Qahtani, R.A., et al. (2023). Deep learning approach to recyclable products classification: Towards sustainable waste management. Sustainability, 15(14): 11138. https://doi.org/10.3390/su151411138
[34] Farooqui, M., Rahman, A.U., Alorefan, R., et al. (2023). Food classification using deep learning: Presenting a new food segmentation dataset. Mathematical Modelling of Engineering Problems, 10(3): 1017-1024. https://doi.org/10.18280/mmep.100336
[35] Ibrahim, N.M., Gabr, D.G., Rahman, A., Musleh, D., AlKhulaifi, D., AlKharraa, M. (2023). Transfer learning approach to seed taxonomy: A wild plant case study. Big Data and Cognitive Computing, 7(3): 128. https://doi.org/10.3390/bdcc7030128
[36] Sajid, N.A., Rahman, A., Ahmad, M., Musleh, D., Basheer Ahmed, M.I., Alassaf, R., Chabani, S., Ahmed, M.S., Salam, A.A., AlKhulaifi, D. (2023). Single vs. multi-label: The issues, challenges and insights of contemporary classification schemes. Applied Sciences, 13(11): 6804. https://doi.org/10.3390/app13116804
[37] Gollapalli, M., Rahman, A., Alkharraa, M., et al. (2023). SUNFIT: A machine learning-based sustainable university field training framework for higher education. Sustainability, 15(10): 8057. https://doi.org/10.3390/su15108057
[38] Talha, M., Sarfraz, M., Rahman, A., Ghauri, S.A., Mohammad, R.M., Krishnasamy, G., Alkharraa, M. (2023). Voting-based deep convolutional neural networks (VB-DCNNs) for M-QAM and M-PSK signals classification. Electronics, 12(8): 1913. https://doi.org/10.3390/electronics12081913
[39] Khan, T.A., Fatima, A., Shahzad, T., et al. (2023). Secure IoMT for disease prediction empowered with transfer learning in healthcare 5.0, the concept and case study. IEEE Access, 11: 39418-39430. https://doi.org/10.1109/ACCESS.2023.3266156
[40] Ahmed, M.I.B., Zaghdoud, R.A., Ahmed, M.S., et al. (2023). Intelligent directional survey data analysis to improve directional data acquisition. Mathematical Modelling of Engineering Problems, 10(2): 482-490. https://doi.org/10.18280/mmep.100214
[41] Musleh, D., Alotaibi, M., Alhaidari, F., Rahman, A., Mohammad, R.M. (2023). Intrusion detection system using feature extraction with machine learning algorithms in IoT. Journal of Sensor and Actuator Networks, 12(2): 29. https://doi.org/10.3390/jsan12020029
[42] Alghamdi, A.S., Rahman, A. (2023). Data mining approach to predict success of secondary school students: A Saudi Arabian case study. Education Sciences, 13(3): 293. https://doi.org/10.3390/educsci13030293
[43] Patil, R., Deshmukh, S., Rajeswari, K. (2015). Analysis of SimpleKMeans with Multiple Dimensions using WEKA. International Journal of Computer Applications, 110(1): 14-17.
[44] Basheer Ahmed, M.I., Zaghdoud, R.A., Al-Abdulqader, M., et al. (2023). Ensemble machine learning based identification of adult epilepsy. Mathematical Modelling of Engineering Problems, 10(1): 84-92. https://doi.org/10.18280/mmep.100110
[45] Agrawal, D., Aggarwal, C.C. (2001). On the design and quantification of privacy preserving data mining algorithms. In Proceedings of the twentieth ACM SIGMOD-SIGACT-SIGART symposium on Principles of database systems, pp. 247-255. https://doi.org/10.1145/375551.375602
[46] Rani, Y., Rohil, H. (2013). A study of hierarchical clustering algorithm. International Journal of Information and Computation Technology, 2: 113.
[47] Alqarni, A., Rahman, A. (2023). Arabic Tweets-based Sentiment Analysis to investigate the impact of COVID-19 in KSA: A deep learning approach. Big Data and Cognitive Computing, 7(1): 16. https://doi.org/10.3390/bdcc7010016
[48] Sajid, N.A., Ahmad, M., Rahman, A.U., et al. (2023). A novel metadata based multi-label document classification technique. Computer Systems Science & Engineering, 46(2): 2195-2214. https://doi.org/10.32604/csse.2023.033844
[49] Qureshi, M.A., Asif, M., Anwar, S., Shaukat, U., Khan, M.A., Mosavi, A. (2023). Aspect level songs rating based upon reviews in English. Computers, Materials & Continua, 74(2): 2589. https://doi.org/10.32604/cmc.2023.032173
[50] Abbas, S., Raza, S.A., Khan, M.A., Khan, M.A., Sultan, K., Mosavi, A. (2023). Automated file labeling for heterogeneous files organization using machine learning. Computers, Materials & Continua, 74(2): 3263-3278. https://doi.org/10.32604/cmc.2023.032864
[51] Qureshi, I.A., Bhatti, K.A., Li, J., Mahmood, T., Mukhtar, M., Rehman, A. (2024). GFuCWO: A genetic fuzzy logic technique to optimize contention window of IEEE-802.15. 6 WBAN. Ain Shams Engineering Journal, 102681. https://doi.org/10.1016/j.asej.2024.102681
[52] Arooj, S., Khan, M.F., Shahzad, T., Khan, M.A., Nasir, M.U., Zubair, M., Ouahada, K. (2023). Data fusion architecture empowered with deep learning for breast cancer classification. CMC-Computers, Materials & Continua, 77(3): 2813-2831.
[53] Jan, F., Rahman, A., Busaleh, R., Alwarthan, H., Aljaser, S., Al-Towailib, S., Alshammari, S., Alhindi, K.R., Almogbil, A., Bubshait, D.A., Ahmed, M.I.B. (2023). Assessing acetabular index angle in infants: A deep learning-based novel approach. Journal of Imaging, 9(11): 242. https://doi.org/10.3390/jimaging9110242
[54] Gollapalli, M., Rahman, A., Youldash, M., Alomari, D., Alismail, S., Khawaher, F., Alkhadair, A., Aljubran, F., Alzannan, R., Alkhulaifi, D., Mahmud, M. (2023). Machine learning approach to users’ age prediction: A telecom company case study in Saudi Arabia. Mathematical Modelling of Engineering Problems, 10(5): 1619-1629. https://doi.org/10.18280/mmep.100512
[55] Dash, S., Luhach, A.K., Chilamkurti, N., Baek, S., Nam, Y. (2019). A Neuro-fuzzy approach for user behaviour classification and prediction. Journal of Cloud Computing, 8(1): 1-15. https://doi.org/10.1186/s13677-019-0144-9
[56] Mahmud, M., Lee, M., Choi, J.Y. (2020). Evolutionary-based image encryption using RNA codons truth table. Optics & Laser Technology, 121: 105818. https://doi.org/10.1016/j.optlastec.2019.105818
[57] Rahman, A.U., Abbas, S., Gollapalli, M., Ahmed, R., Aftab, S., Ahmad, M., Khan, M.A., Mosavi, A. (2022). Rainfall prediction system using machine learning fusion for smart cities. Sensors, 22(9): 3504. https://doi.org/10.3390/s22093504
[58] Rahman, A.U., Alqahtani, A., Aldhafferi, N., Nasir, M.U., Khan, M.F., Khan, M.A., Mosavi, A. (2022). Histopathologic oral cancer prediction using oral squamous cell carcinoma biopsy empowered with transfer learning. Sensors, 22(10): 3833. https://doi.org/10.3390/s22103833
[59] Rehman, A., Athar, A., Khan, M.A., Abbas, S., Fatima, A., Saeed, A. (2020). Modelling, simulation, and optimization of diabetes type II prediction using deep extreme learning machine. Journal of Ambient Intelligence and Smart Environments, 12(2): 125-138. https://doi.org/10.3233/AIS-200554
[60] Ghazal, T.M., Al Hamadi, H., Nasir, M.U., Gollapalli, M., Zubair, M., Khan, M.A., Yeun, C.Y. (2022). Supervised machine learning empowered multifactorial genetic inheritance disorder prediction. Computational Intelligence and Neuroscience, 2022: 1051388. https://doi.org/10.1155/2022/1051388
[61] Zaman, G., Mahdin, H., Hussain, K., Abawajy, J., Mostafa, S.A. (2021). An ontological framework for information extraction from diverse scientific sources. IEEE Access, 9: 42111-42124. https://doi.org/10.1109/ACCESS.2021.3063181
[62] Arooj, S., Zubair, M., Khan, M.F., Alissa, K., Khan, M.A. (2022). Breast cancer detection and classification empowered with transfer learning. Frontiers in Public Health, 10: 924432. https://doi.org/10.3389/fpubh.2022.924432
[63] Rahman, A. (2023). GRBF-NN based ambient aware realtime adaptive communication in DVB-S2. Journal of Ambient Intelligence and Humanized Computing, 14(5): 5929-5939. https://doi.org/10.1007/s12652-020-02174-w
[64] Rahman, A.U., Dash, S., Luhach, A.K. (2021). Dynamic MODCOD and power allocation in DVB-S2: A hybrid intelligent approach. Telecommunication Systems, 76(1): 49-61. https://doi.org/10.1007/s11235-020-00700-x