Muna Baldawi*![]() | Khansaa Ghazi Rasheed
| Khansaa Ghazi Rasheed![]()
© 2024 The authors. This article is published by IIETA and is licensed under the CC BY 4.0 license (http://creativecommons.org/licenses/by/4.0/).
OPEN ACCESS
Contemporary urban centers are increasingly grappling with the complexities of rapid development, leading to urban agglomerations that often outpace meticulous study and planning. This phenomenon necessitates strategic intervention to accommodate the evolving urban landscape and address the exigencies of development. The present study underscores the imperative for strategic approaches to orchestrate urban agglomerations into a coherent framework that aligns with the exigencies of technological advancements, urban expansion, and environmental sustainability. This research posits that certain modern urban conglomerates fall short in fulfilling the demands of contemporary living and necessitate regulation through advanced digital tools for measurement and analysis. Momepy, a tool that facilitates the quantitative analysis of urban morphology, is employed herein to yield geometric insights into the current state and evolution of urban form. Through Momepy, strategies are discerned that enhance or detract from urban environmental quality, thereby informing the implementation of adaptive urban strategies. In conclusion, the application of sophisticated digital analysis tools is instrumental in the identification and development of urban environmental strategies. These tools enable the delineation of effective tactics to guide the transformation of urban agglomerations into sustainable and livable spaces.
digital tools ecological sustainability, economic development, urban transformations, urban agglomeration, urban tactics
Open-source digital tools have been increasingly recognized as pivotal in accelerating the transition towards sustainable urban development and their integration into urban and regional governance is subject to ongoing scholarly examination [1]. These digital technologies have the potential to foster equitable and just urban environments by addressing the diverse needs of urban populations. They facilitate access to essential services, education, and connectivity, while also equipping citizens to face the challenges posed by climate change [2]. The physical manifestation of cities and their temporal evolution can be discerned by examining the characteristics of fundamental urban elements such as streets, buildings, and plots, which constitute the primary components of urban form, as delineated by Moudon [3]. However, the capacity to measure specific urban characteristics and morphological processes has historically been limited, offering only a narrow range of functionalities, often tailored to particular case studies.
Advancements in computational power and the refinement of morphological analyses have precipitated a shift towards more quantitative methodologies, leading to the development of urban morphological standards [4]. Tools such as Geographic Information Systems (GIS) and Momepy, an urban analysis library for Python, have emerged as instrumental in facilitating this analytical transition.
The contemporary urban landscape is marked by a problematic interplay between the elements of urban form and the overall urban fabric, characterized by fragmentation, dispersal, and the segregation of urban components. These issues underscore the complexity of spatial, functional, economic, and social relations within cities. It is acknowledged that no universal model for city planning exists, as urban characteristics are highly context-specific, although certain ubiquitous elements may be identified [5].
Previous research focusing on urban agglomeration as a developmental phenomenon has often neglected to consider agglomeration as a strategic approach to integrating the urban fabric or to propose a vision for immediate or future interventions. The experience of many cities in Iraq illustrates the consequences of war and the absence of regulatory frameworks, leading to unchecked building density and diminished open spaces. These alterations in urban landscapes necessitate a critical response.
This introduction situates the investigation within the broader context of urban development research and establishes the foundation for a detailed exploration of the roles and impacts of digital tools in urban morphological analysis and planning.
The following concepts form the basis for a theoretical framework that allows the application of tactics in urban agglomeration and provides the leading (ecological, contemporary) impacts accruing in the city now that achieve the research goal, by identifying the most important tactics that can be adopted in addressing the transformation of urban agglomerations through digital tools and their impact on the adoption of urban development.
2.1 Urban agglomerations
Many studies aim to explain urban agglomeration, they developed the concept of a "group of cities" in his book "Cities of Tomorrow" from the spatial concentration that was prevalent at the time; he pivoted on the spatial patterns of towns. He proposed a new planning paradigm with a central metropolis [6], which was the turning point. The concept finally evolved into the "Garden City" urban agglomeration paradigm [7]. Other studies described a conurbation as an area with several significant cities. As a result of population increase and physical expansion, cities and additional metropolitan areas that merge to form one developed and industrialized metropolitan area formed the concept of mega urban agglomerations in mega areas [8]. Reserchers explains urban agglomeration as a spatial representation of the post-industrial and post-modern lifestyle in the region [9].
Other studies introduced the concept of a "global city region" and applied it to study the economic growth dynamics of cities in the Americas and Asia. He found that these global city regions were equivalent to urban agglomerations, although they aimed at global economic and developmental dynamics [10].
Global city regions' spatial shape is changing. Whereas most metropolitan regions used to be centered on one or two defined significant cities, today's city regions are becoming more polycentric or multi-clustered agglomerations.
As a result, what has been happening is a complex process of decentralization and decentralization of the city region [7].
Many older established agglomerations have seen a decline in specific demographic groups and job activities, but new immigrant populations and economic functions have often preoccupied the places they departed. Simultaneously, new urban development poles are emerging in the periphery, expanding and pinning down the urban fabric in a reentered regional constellation of cities [10].
Table 1. General view of urban agglomeration studies [11]
|
Year |
Definition |
Researcher |
|
2000 |
City and regional area concentrated. |
Hu |
|
2001 |
Urbanized areas within daily commutable radius |
Potnov and Erell |
|
2001 |
Global city-region |
Scott |
|
2002 |
As a result of rapid urbanization and the transition to megalopolis |
Wang |
|
2005 |
A highly concentrated group of cities and a new economic unit for global division |
Fang |
|
2007 |
A concentrated and economically important area |
Ni |
|
2015 |
A interconnected group of cities that share common goals and fate. |
Fang |
An agreed-upon concept of urban agglomeration is still hard, Table 1 summarizes the descriptions and definitions of that urban agglomerations in 21st century of researchers.
Studies refer to a set of characteristics of urban agglomerations in addition to the mechanisms that achieve urban agglomerations, which may be different according to time and place; where we reached a procedural definition of agglomeration by reviewing studies that it is an advanced spatial structure that is self-sustaining through a concentrated density of buildings, as this convergence of urban components aims Primarily economic and environmental goals. Where the research problem indicates that there are no precise mechanisms or common treatments to achieve regular agglomerations, Table 2.
Table 2. Indictors of urban agglomeration (Researchers)
|
Variables |
Indictors |
Objective |
|
Dimension |
Respect Human scale |
Create new dimension of urban environment |
|
Volume |
Enlarge volume |
volume augmentation by agglomeration |
|
Density |
High Density |
Self-sustainable |
|
Connectivity |
Highly connection |
Highly connection |
|
Diversity |
Diversity in Dimension and functions |
Scale diversity |
2.2 Urban tactics
The tactic is described as particular steps you will use to attain a goal. Conversely, tactics are intended actions dictated by a lack of a suitable location where the technique sneaks in piecemeal; studies define tactics as the particular steps you will use to attain a goal. The tactic, on the other hand, is a deliberate action governed by the absence of a niche in which the tactic snaking gradually to chances transforming [12]; a small urban change may significantly impact the value of that region. It must be carried out correctly to succeed as an urban transformation, meeting specific requirements such as accessibility and the potential to enhance urban conditions.
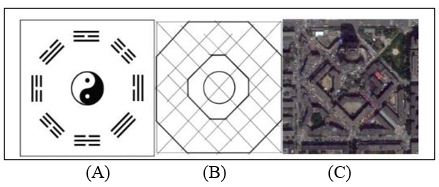
The original concept for utilizing a military approach in planning was created in the 1920s, and the design was based on the concept of "graphics Eight Diagrams" (Ba Gua), Figure 1, it relies on Western axis and circle principles to produce a shape that adheres to Chinese philosophy, where the eight-axis form supported the city's purpose. It is simple to enter into it and difficult to get out of it since they are all the same, making people feel like they are in a maze [13].
Figure 1. The Chinese eight-axis model (from left to right) (A) Eight charts; (B) The structure of South Market Street; (C) Arial image of south market [13]
After that, tactics were developed to deal with the changes in ancient cities as they transitioned from traditional cities to contemporary urban agglomerations. The implementation of tactics progressed through many phases. These interventions can be used to address existing city challenges and how to deal with them.
Studies that dealt with the conceptual and theoretical aspect of urban tactics
Previous studies that when reviewing the hierarchical system of the city, Study of Peterson and Row [14] was found that the transformation of the city at the local level and at the level of urban parts and residential enclaves where the city is read as layers expressing both continuity and discontinuity in the urban fabric where the previous layer is always material for the transformation in the next layer [14].
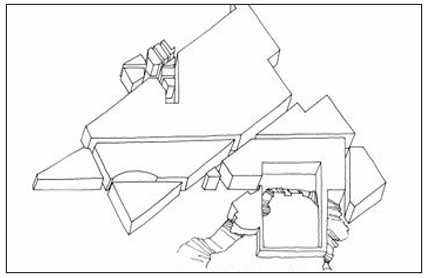
Another study, addressed the problem of urban fragmentation in Rome by analyzing the urban elements that comprise the urban environment, as well as techniques and tactics for achieving cohesiveness and linkages between these components by using Tactics of Connection that define and complement the overlapping of fields (achieve the overlapping of edges and patterns between fields) the diversity of relationships and the continuity of the fabric (all forms of continuity must extend with the center) and the urban spaces of the city to qualify the connections and transitions between the different parts of the case study Figure 2 [15].
Figure 2. Field interpenetration, (streets and edges positioned in on different orientations) [15]
The study of Araldi and Fusco [16] deals with contemporary urban design strategy and how to create a possibility for new development to revive urban regions that have experienced unstable conditions. re-stitching tactics articulate spatial constructs to build an inclusive network of connected local spaces through axial avenues and restructure, interaction with, perception, and memory of the city as an image where the visual qualities associated with urban environments are intimately linked, with the sequential change in the city's perception, memory, and identity [16].
In 2018, reserchers concentrated on the structural qualities and features of buildings to understand their ability to accommodating new facilities through the reuse tactic by elements or small blocks that form configured with larger blocks or elements as "matrix elements" of urban space, where the comparison shows the same structural and similar relationships between mass and void elements utilized in buildings, The work focused on restoring the environmental balance between the study area and its surroundings, It relied on a set of tactics:
(1) Connecting This strategic tactic works in the spaces between buildings as it reuses an urban mass by inserting a new building between the original volumes and allows the creation of new interior urban spaces, which open the urban mass for use.
(2) Gathering/Scattering This tactic works within the structural pattern by inserting spaces within existing urban spaces to reuse urban spaces.
(3) Mirroring This tactic reverses the building, juxtaposing a new duplex building with visual, functional and spatial relationships and facilities to keep the spatial character of the original building intact.
(4) Overlapping This tactic works to overlap the structural and functional planning over the original configuration to create a spatial relationship between the two levels and allow the space to move on different paths compared to the path that was originally running. It is a new system that reflects the tectonic principle of agglomeration.
(5) Carving out This tactic represents a new hierarchical organization of space, creating a large empty space for huge blocks, around which they rotate [17].
Other study proposed the re-densify tactic as an open urban strategy that can respond to changing needs in the city characterized by complex and internally inconsistent spatial structures, diverse morphologies and functions [18], by moving from the fixed to the temporary and from the large scale to the micro-scale, spatial scales were developed to provide a degree of flexibility. High adaptability allows buildings to adapt to variations in density while also being reconfigured, grown, and added to accomplish urban agglomeration, which is the study's goal. A "collective city" perfectly captures the quirkiness of this collection of towns [19].
While study of Fleischmann [20] dealt with the development of the ecological aspects of the urban environment by studying the city's local layers as a tactic or prototype that needs to be examined to give a possible response to spatial criteria, this tactic was defined as co-habitation, eco-stratigraphy's by improving functions and enhancing the structure (The Strategies of Mat-building & non-pedigreed), the human scale by defining the upper limit of building (the principle of a city in a building), a tactic based on the integration between buildings and open spaces, taking the Hanging Gardens in Babylon as an example, adaptable structures, Dynamic space and structure The framework for this tactic is the environmental infrastructure, based on Reversible space, such as 'input' or 'parasite' (architectonical parasites transform the existing structures into different living environments by high density and medium height. The study concludes that environmental layers of coexistence focus on the line of Rudofsky's unconventional architecture and Alison Smithson's theory of exclusive buildings, where functions come to improve and enrich the structure. In hybrid buildings as a coexistence tactic, the individual gains new freedoms of action through a new variable arrangement based on interconnectedness, “group patterns” 'close-kit patterns of association'. This tactic relies on the mat voids as continuous permeability (Table 3) [20].
The study area's underlying transformation must be evaluated by studying the tactics and their impact on improving the urban environment, relying on indicators, variables, and the most important tactics that were reached from the theoretical framework of the study, as the research assumes the existence of a group of tactics that require guidance so that the city's transformation into a thoughtful and organized tactic is possible.
Table 3. Indictors and objective of urban tactics in urban agglomeration
|
Tactic |
Objective |
Indictors |
|
Tactics of Transformation |
Each layer contrasts with the previous layer |
Shape |
|
Reconfigure-Concentric agglomeration |
Density |
|
|
Increase in size |
Area |
|
|
Each layer contrasts with the previous layer |
Diversity |
|
|
Tactics of Connection |
Connection between fields |
Diversity |
|
Re-stitching tactic |
Major or minor street realignment and linkage pattern |
Connectivity |
|
Reconfigure large and small urban nodes |
Shape |
|
|
Reuse tactic |
Configure blocks or larger elements of urban space |
Shape |
|
Connecting |
Add and activate a block between the original blocks |
Voulmes & Shapes |
|
Gathering/Scattering |
Activate spaces |
Diversity |
|
Mirroring |
Reviving the relationship between mass and void |
Voulmes |
|
Overlapping |
Overlap between the original layout and the addition |
Density |
|
Carving out |
Organizing and activating spaces |
Diversity |
|
Re-densify tactic |
Restructure |
Density |
|
Input or Parasite tactic |
Integration between buildings and open spaces |
Diversity |
|
Transformation in structure |
Shape |
In an urban environment placing a new spatial object in a space brings about a change in compositional properties for this place, this explains that the addition of each new building (as a new external morphological element) was introduced into its context spatial) stimulates some changes in its immediate vicinity [4].
The Urban Morphology Measuring Toolkit depend on the science of urban morphology, which is defined as the study of urban form, that relies on the study of patterns, components, processes of formation and transformation of the elements of a city, town, or urban part. Urban morphology additionally includes the analysis of planning and physical design of a city Moudon [3].
Within the urban studies, urban morphology described as the exploration of the physical form of cities in space and the way they change over time.
With the development of urban formation studies, the need for studying the characteristics of the urban form through the elements of the urban form, as Moudon [3] referred to the street, building, and neighborhood plot as the basic elements of urban composition of cities, in addition to a set of analytical structures such as axial maps.
However, the capabilities were not always available to make such measurements on a specific urban formal character or processes, such as morphological tessellation, where the components provided only a limited number of functions because they were primarily used in a specific case, but with the development of studies and measurements of morphological structures and the development of computational power, there was a greater emphasis on quantitative forms of analysis [4].
3.1 Quantitative analysis of urban form
Momepy (a Python toolkit that works to overcome the constraints of quantitative analysis of urban form by enabling a systematic analysis of urban form, broadly incorporating a set of quantifiable attributes) is the source of Momepy's development [21].
Momepy's formalistic properties allow comprehensive urban model analysis, from the level of individual buildings and plot to urban areas that could create descriptive and analytical frameworks for urban agglomerations.
In addition, Momepy is designed to be more flexible than previous toolkits, functionality is generally not limited to specific formal elements but can use analytical models) [21].
(a) Coverage area ratio
(b) Simpson’s diversity of area
Figure 3. Examples of using Momepy in urban form analysis (a) Coverage Area Ratio; (b) Simpson’s diversity of area [10]
It attempts to provide a range of tools for a systematic and comprehensive analysis of the urban form that can work with a wide range of elements, with a focus on building footprints and street networks as it works to measure the urban structure through buildings, urban spaces, streets and spatial units (Plots) where it is based by measuring the dimensions of aggregated structures, morphological elements and their parts, measuring geometric shapes that represent a wide range of morphological features, capturing the spatial distribution of elements of one type, and the relationships between different types, density, calculating the diversity of different aspects of urban form, Figure 3, the interconnection of urban street networks and generate relational elements of urban form (e.g. morphological tessellation) [22].
3.2 Morphological tessellation
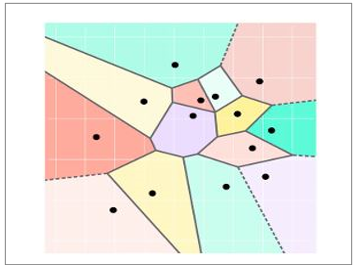
When observing an aerial photograph or map of a specific city, the eye notices the existence of a basic relationship between the buildings, their spatial configuration, and the geometry of the plot of land. This relationship is considered intuitive and is based on the idea of tessellation Voronoi [4], which ideally represents its area of influence when applied to the urban form of the city by dividing the space into cells, which explains the way in which the buildings are connected, but more precisely, as it gives a spatial meaning to the morphological impact on spatial context [23, 24].
Tessellation is an analytical feature in Mompey that is based on Verno tessellation, which was introduced in 2012. It is employed for measuring characteristics such as building density. The work for this phase took a long time and this feature is included in Mompey, example Figure 4.
Figure 4. Voronoi tessellation, each color is the area of one tessellation cell (area of effect) [24]
The purpose of using tessellation is to determine the plot, which OpenStreetMap cannot provide because it does not exist, just buildings, thus tessellation works to give plots as an analytical feature [23].
The MT uniformly covers the entire area within the selected study area, allowing the topology of the contiguous space to be captured at the plot level, as all MCs are determined from relationships with adjacencies. It is possible to think in terms of topological distance (a specific number of topological steps between cells) instead of geographic distance (the specific metric distance around elements. When thinking in terms of topological distance instead of metric, MT can be used to define new aggregate analytical units capable of capturing the area of direct influence of a building on its surrounding fabric and at the same time the influence of the surrounding fabric of the building. Because the size of each MCs depends on the resolution of the urban structure, the spatial representation of a given topological distance will be much smaller relative to the MC located at Fine-grained urban built-up area compared to coarse-grained built-up area. This is a type of information that would not be accessible with plots alone, and which allows the idea of “proximity” to be reformulated by rethinking the relationship between scale and spatial meaning, and thus Enhanced ability to capture context that can greatly expand the applicability of the models to any urban area in the world.
In this section, the process of analyzing the study area begins based on the information which was worked on using the Gis program (in case of information about the study point is not available in open street map (the free mapping program from wiki)).
Because the program works on analyzing the indicators that were reached within the theoretical framework, the following methodology is followed in analyzing the urban form of the study area.
4.1 Methodology and implementation
(1) The tool depends on the input data from the open street map, make sure that all information is available. In some cases, it is not possible to find all the information. Use mygeodata maps [23] and upload your geodata to obtain buildings and streets. Mompey cleans up any wrong points entered.
(2) This input data is implemented, tessellation works to produce a morphological cells and the boundaries of the research area (tessellation gives it to infinity).
(3) Geopands are used to measuring morphological characteristics, dimensions, shape and similarity in the shape of buildings and measuring the degree of complexity of the texture (how similar are the urban blocks), the ratio of the distance between the street units and the end point segments while Pysal do all these features or properties to connect tessellation covers and Covers area.
(4) Momepy measures the area of polygon geometry, it holds the final values, as well as the original input and any parameters that were used in the computation, in categories for each measurable character Table 4.
Table 4. Momepy Indicators API reference (docs. momepy. org)
|
Indictors |
Equation |
References |
|
compactness index |
$\left(\frac{4 \sqrt{\text { area }}}{\text { perimeter }}\right)^2$ |
[4] |
|
AreaRatio |
$\frac{\text { covering object area }}{\text { covered objext area }}$ |
[25] |
|
Equivalent RectangularIndex (ERI) |
$\begin{array}{r}\sqrt{\frac{\text { area }}{\text { area of bounding rectangle }}} \times \frac{\text { perimeter of bounding rectangle }}{\text { perimeter }}\end{array}$ |
[26] |
4.2 Start measuring
Generate blocks based on buildings, tessellation, and street network and start by the codes below (form mompey documentation) by using of the momepy, which analyzes the elements that tactics operate on as variables in urban agglomerations:
4.2.1 Case study: Al-Harithiya City-Baghdad
Al-Harithiya is one of Baghdad's major cities. Al-Kindi Street is the main street in Al-Harithiya and was once characterized by a traditional residential urban scene but after the Municipality of Baghdad's planning decision in 1983, streets were transform to commercial use, the area has been affected since that time until now, and the most affected when the commercial use extended to the inner residential streets, Al-Harithiya is one of Baghdad's major cities. Al-Kindi Street is the main street in Al-Harithiya and was once characterized by a traditional residential urban scene but after the Municipality of Baghdad's planning decision in 1983, streets were tranform to commercial use, the area has been affected since that time until now, and the most affected when the commercial use extended to the inner residential streets, Figure 4.
4.2.2 Fundamental aspects to select a case study
Despite the primary objective of building planning decisions on commercial streets to preserve the urban fabric of the residential area and arrange the commercial area, the city suffered from the following problems:
(1) At the level of urban planning, the region suffered by the unplanned division of plots of land, which reflected negatively on the region and led to a state of irregular agglomeration that needed to be restructured.
(2) At the level of horizontal dimensions, the buildings give non-uniform facades which effected the homogeneity and visual coherence adjacent buildings, well as the large differences in color, materials and texture, which lost the urban scene.
(3) At the level of vertical dimensions, the lack in urban planning decisions led to skyline irregularity and an environment of heterogeneity in the region, Commercial usage can be visible at high heights within the residential area, the most prominent landmark in the area is a hotel within the Baghdad Mall.
4.2.3 Pilot applications and use case
Cities today face many problems in their urban formation, where the existence of random settlements is thus affecting the quality of life in the urban environment. Here we find the urban formation of the study area through the elements, buildings, street networks, plots (which are difficult to obtain and are a key element in urban analysis processes) and open spaces, since urban design is within the fields of architecture, the process of describing the urban environment must be done mathematically (numerically).
(1) Dimensions are measured, which are the dimensions around the height.
(2) The size of the shape is closer to the shape of a square circle or a more complex fractal shape.
(3) Spatial distribution that requires a relationship between the elements.
(4) Density-the density of buildings.
(5) Connectivity.
(6) Diversity means diversity within the same region.
The main objective of analyzing the study area is the quantitative analysis of the urban form through the dynamic classification of the urban environment, where the tool focused on characterizing urban reform.
4.4.4 Generating morphological elements
Generate blocks based on buildings, tessellation, and street network and start by the codes below (form mompey documentation):
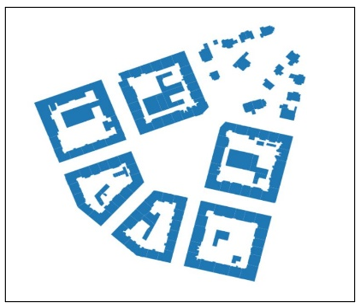
(1) Identification of building footprint
Mompey determines the coverage percentage of the area on plots using the formula above and the code below, Figure 5.
>>>buildings=gpd.read_file('F:/areas.gpkg', layer='areas')
(2) Measuring the coverage areas of building
Determining the areas of each object on each urban plot by using the formula above through the code below:
>>>buildings=gpd.read_file(momepy.datasets.get_path('C_area'), layer='buildings')
>>>buildings['area']=momepy. Area(buildings). series
(a) Buildings foot print
(b) Morphological tessellation on a sample of bubenec dataset illustrates the Voronoi tessellation applied to producing polygons
Figure 5. Examples
Source: OpenStreetMap contributors, CC BY-SA [21]
4.4.5 Generating morphometric characters
(1) Identification shapes
Mompey identify shape by Calculates the equivalent rectangular index (ERI) of each object in a given GeoDataFrame by using the code below, Figure 6.
(a) Buildings’ footprint
(b) Coverage areas
Figure 6. Generating morphological elements of case study by Momepy
blg_ERI=momepy.EquivalentRectangularIndex(buildings, areas='area')
buildings['eri']=blg_ERI.series
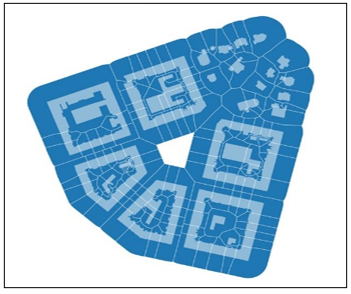
(2) Identification tessellation layer.
Mompey Identify the tessellation layer by using the codes below, Figure 7.
limit=momepy. buffered_limit(buildings, buffer=100)
tessellation=momepy. Tessellation(buildings, unique_id='OBJECTID', limit=limit)
tessellation_gdf=tessellation.tessellation
tessellation.shrink
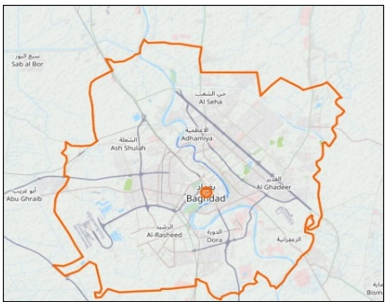
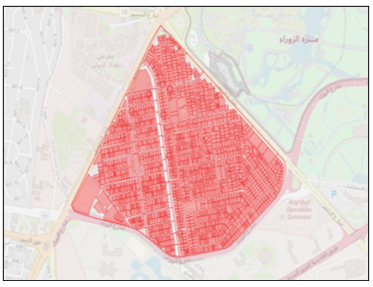
(a) Baghdad City
(b) Al-Harthiya City
Figure 7. Case study (from open street map)
After generating the Tesselation layer as an analytical feature that helps in analyzing the study area, Momepy works to analyze urban elements of the study area, such as connectivity.
4.4.6 Generating relational characters
One way to analyze urban patterns is to study the relationships between different elements of form, using Momepy to measure urban formal characteristics based on two or more GeoDataFrames:
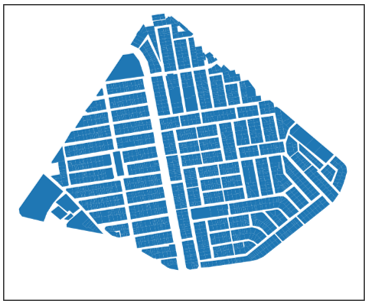
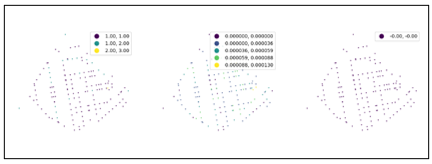
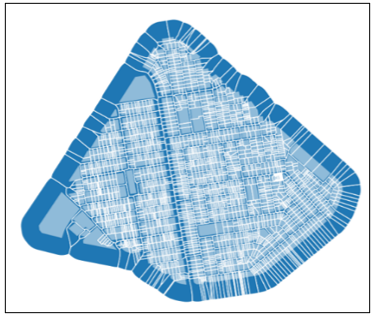
(1) Identification connectivity
We can use the codes below to identify connectivity of streets networks in the case study area (Figure 6):
graph= Momepy. gdf_to_nx(streets)
graph=momepy. node_degree(graph)
graph=momepy. closeness_centrality(graph, radius=400, distance="mm_len")
graph=momepy. meshedness(graph, radius=400, distance="mm_len")
nodes, streets=momepy. nx_to_gdf(graph)
fig, ax=plt.subplots(1, 3, figsize=(24, 12))
nodes.plot("degree", ax=ax[0], scheme="natural_breaks", legend=True, markersize=1)
nodes.plot("closeness", ax=ax[1], scheme="natural_breaks", legend=True, markersize=1, legend_kwds={"fmt": "{:.6f}"})
nodes.plot("meshedness", ax=ax[2], scheme="natural_breaks", legend=True, markersize=1)
ax[0]. set_axis_off ()
ax[1]. set_axis_off ()
ax[2]. set_axis_off ()
(2) Measuring Density
Calculate the density is a common practice in urban analytics. Momepy may measure the following types using codes below by proposing equivalent height Figure 8.
Figure 8. Connectivity layer by Momepy
Density is measured through urban area analysis, after pre-processing the building layer, the cell layer (Tessellation) will be generated. Since the study area is specific, some edge effect will appear. Some outliers will appear at the edge of the study area, and the net and gross density (Net Density) and (Gross) will be measured. Density) Studies show that development work requires comparison to how it will look and feel, so gross density must be translated into net density Donaldson.
Gross density for calculating gross density, we must first determine floor areas, then merge floor areas to tessellation using a unique ID and generate spatial weights, Figure 6.
buildings['floor_area']=momepy. FloorArea(buildings, 3). series
tessellation=tessellation. merge(buildings[['uID', 'floor_area']])
sw=momepy. sw_high(k=3, gdf=tessellation, ids='uID')
gross=momepy. Density(tessellation, values='floor_area', spatial_weights=sw, unique_id='uID')
tessellation['gross_density']=gross. Series
Gross coverage for calculating gross coverage Figure 6.
buildings['area']=momepy. Area(buildings).series
tessellation=tessellation. merge(buildings[['uID', 'area']])
coverage=momepy. Density(tessellation, values='area', spatial_weights=sw, unique_id='uID')
tessellation['gross_coverage']=coverage.series
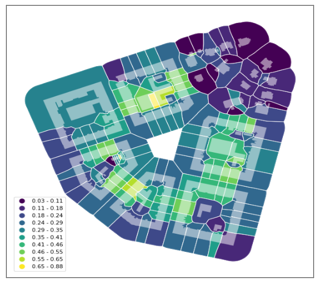
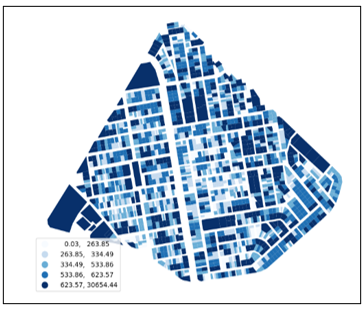
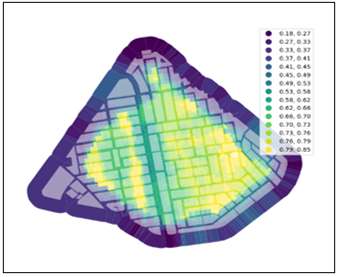
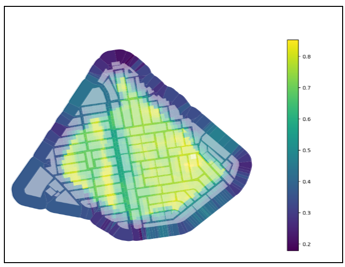
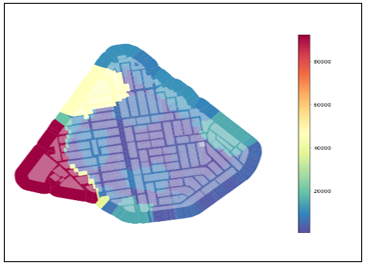
The results indicate that the coverage rate in the core area of the agglomeration or the center of the agglomeration is 80%, while on the borders of the agglomeration, the coverage rate is lower and may reach 20% due to the low percentage of dividing the blocks on one piece of land. As for the total density, values appear similar to the percentage of coverage area and represent Also, the highest percentage of density is 0.85 in the center of the agglomeration and 0.18 in the boundaries of the agglomeration. As for the net density, which represents the percentage of housing on the plot of land, high values appear, reaching 1.54 within the residential area and decrease on the main axis (Al-Kindi Street) and on the boundaries of the agglomeration due to the commercial functions. It is prevalent and extends in some streets into the residential area, as shown in the geographical chart of net density.
(3) Measuring Diversity
Mompey determines the Diversity in the region through the following codes.
The range measures the range of values indicated by spatial weights within all neighbors. However, as shown in the Figure 9, there is a significant impact of large-scale buildings, which can be seen as outliers. As a result, we can define the rng keyword parameter to limit the range considered.
area_rng=momepy. Range(tessellation, values='area', spatial_weights=sw3, unique_id='uID')
tessellation['area_rng']=area_rng.series
area_iqr=momepy. Range(tessellation, values='area', spatial_weights=sw3, unique_id='uID', rng=(25, 75))
tessellation['area_IQR']=area_iqr.series
Theil index, like the Gini index, is a measure of inequality. momepy implements the calculation using pysal's implementation of the Theil index using the codes below:
area_theil=momepy. Theil(tessellation, values='area',spatial_weights=sw3,unique_id='uID')
tessellation['area_Theil']=area_theil. series
area_id_theil=momepy. Theil(tessellation,values='area', spatial_weights=sw3,unique_id='uID',rng=(10, 90))
tessellation['area_Theil_ID']=area_id_theil.series
(a) Gross density
(b) Gross coverage
Figure 9. Density measurement
However, we must be careful in using it for continuous values, because it relies on associating values with classes. momepy uses head/tail separators (Head/Tail Breaks) Where a large number of morphometric characteristics follow a power law distribution, natural logarithm, or exponential function, the classification system divides all data values around the mean into two parts and continues the process iteratively for values, the Simpson index is based on Diversity based on dominant types (functions) Diversity of functions tends to be low when density is high.
The Simpson index is based on Diversity based on dominant types (functions) Diversity of functions tends to be low when density is high Simpson's diversity index is one of the most widely used measures of diversity. Because a substantial number of morphometric features follow a power-law distribution (for which Head/tail Breaks are created), momepy use them.
area_simpson=momepy. Simpson(tessellation, values='area', spatial_weights=sw3, unique_id='uID')
tessellation['area_simpson']=area_simpson. series
tessellation['area_simpson_q7']=momepy.Simpson(tessellation, values='area', spatial_weights=sw3,unique_id='uID', binning='quantiles', k=7). series
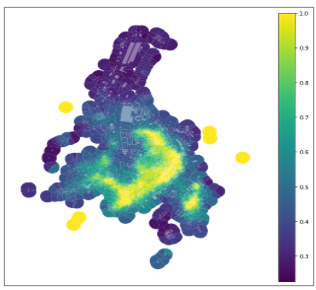
From the diversity calculation, we conclude that there is a significant effect of large blocks on all neighboring blocks, and the highest percentage of 80,000 appears in the mall and large blocks as edges of the study area, indicated in purple, which can be considered outliers. The effect can be reduced based on the interquartile range. The effect of outliers has been eliminated.
The findings from this case study show a set of considerations for the development of contemporary urban agglomerations and how to deal with them ecologically through the studies, that have been dealt with and that have evolved by measuring the following characteristics: 1) coverage areas, 2) ERI, 3) Connectivity, 4) Density, 5) Diversity:
(1) Coverage areas: The implementation of the coverage area shows that the region suffers from extremism, as indicated by the formation of a regular agglomeration in the center of the region. In terms of the agglomeration on the outer edges of the area, the agglomeration becomes random and uneven or harmonious in terms of the areas of the buildings, where a difference arises in the dimensions of the structures in relation to the general environment Figure 7(b).
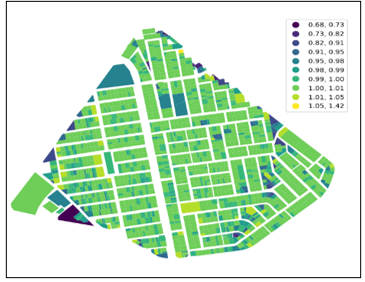
(2) ERI: Index of Parabolic Rectangles Figure 6 shows that the shape of the building in the center of the region is equivalent to its plots of property, but at the edge, the ERI dropped, which suggests that the edge's shape has grown more distinct from the overall context of the agglomeration Figure 10.
(a) Calculates the equivalent rectangular index (ERI)
(b) Tessellation layer
Figure 10. Generating morphometric characters of case study by Momepy
(3) Connectivity: The measurement of connectivity shows that the urban fabric in the study region is an easily accessible grid-iron pattern with a difference in the accessibility of main streets and residential neighborhoods, as well as the presence of specific narrow alleys in the planning of contemporary cities located on both sided of schools and institutions.
(4) Density: The density measure, as shown in the Figure 8, indicates the presence of dense concentrated agglomeration in the center of the study area, but at the edges, it indicates a state of dispersion as we move away from the agglomeration center, as shown in the Figure 9.
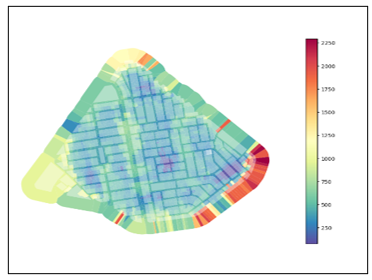
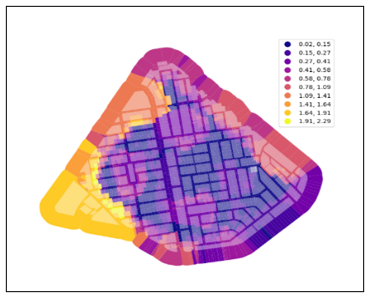
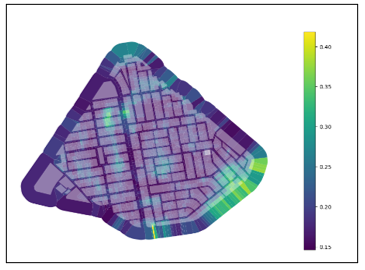
(5) Diversity: the diversity indicator was measured through several values, where it measures the range which measure the impact of high-rise buildings on the fabric and how reduce the impact of high-rise areas and raise low-lying areas, and then measuring diversity by the inequality in urban environment, as shown in the Figure 11.
(a) Range value
(b) Range effect alimentation
(c) Theil index
(d) limit theil index effect
(e) Simpson's default head/tail breaks
(f) Simpson's based on quantiles
Figure 11. Diversity measurement
The findings indicate that the city, as a contemporary urban agglomeration, requires tactics for controlling many types of elements.
(1) Achieving a biological agglomeration using mirroring tactics by enlarging the size of the buildings (double volume) on the borders of the central core (the agglomeration boundaries) while preserving the spatial character of the study area.
(2) Achieving a vital clustering system through overlapping tactics, where the relationship between mass and functions creates a spatial relationship with the original composition.
(3) Regular agglomeration can be achieved through transformation tactics that are based on increasing the net density (housing) by converting voids into quiet blocks, which is the opposite of what happens in the study area, where most of the voids are transformed into commercial uses.
(4) Achieving an ecological agglomeration by increasing the net density with human dimensions and medium heights through the tactic of ecological coexistence layers to solve the problem of an ecologically unsustainable agglomeration that suffers from weak ecological aspects, dispersion, distance of functions, and heterogeneity of heights.
(5) Weak densification tactics in residential areas, as the densification process in the study area works to absorb commercial functions only at the expense of housing.
In terms of urban design, the massive division of land plots led to an environment of agglomeration that had to be displaced in order to create green spaces, as well as returning to the previous layer of the city and recovering green spaces that had been removed due to agglomeration. Since tactics are used to change open places on the edges of the city into blocks that suit the agglomeration of output, it is vital to focus on establishing rules to re-breath the city environmentally because the transformation of open spaces on the outer edges of the city into blocks suitable for the agglomeration of production and achieve a balance in spatial weights.
It should be emptied near the edge of agglomeration, as well as the teams to reduce the impact of construction on the agglomeration and create balance by devising tactics to create a self-centered aspect in the area and reduce pollution. Through the pervious tactics, the region can be transformed into an economically sustainable agglomeration and an environmental urban environment by providing breathing opportunities for humans in cases of epidemics and diseases, confronting climate change, and reducing the negative effects of agglomeration.
Fields near edge need to be emptied, as well as some sites that lack the potential of public spaces due to issues such as ownership and spatial planning. Teams need to minimize the impact of construction on agglomeration and create balance by devising tactics to create a selfish aspect in the area and reduce pollution. Through these tactics, the region can be transformed into an economically sustainable agglomeration and an environmental urban environment by providing breathing opportunities for humans in cases of epidemics and diseases, confronting climate change, and reducing the negative effects of agglomeration.
The aim of this research is to develop self-sustaining urban agglomerations that can achieve an ecologically, economically, and contemporary urban environment, in addition to use digital analysis tools to developed approaches that can use previously applied tactics, strategies, and t important indicators and criteria for achieving self-sufficiency in most cities and contribute to reducing the impact of the agglomerated built environment on the climate.
According to the urban experience, cities must be involved with software and digital tools in order to obtain accurate results on the challenges that cities face, as it was determined through the strategies gathered through the application of Momepy codes that urban areas must be reviewed in the following aspects:
(1) In terms of shape, cities began to agglomerate randomly, and this issue must be addressed before eliminating every opportunity for the city to be treated environmentally, protect human health, and reduce pollution by Achieving a vital clustering system through overlapping tactics, where the relationship between mass and functions creates a spatial relationship with the original composition.
(2) In terms of height, the city of Baghdad in general suffers from the buildings height extremism because of a lack of regulation may control its limits and preserve neighborhoods' privacy.
(3) Density must be managed to achieve self-sustainability at a variety of dimensions and functions, as one of the benefits of agglomeration is the proximity of urban components, reducing the use of cars and encouraging walking through a cohesive urban community, but the area must be controlled because it helps reduce pollutants.
(4) In terms of diversity, which is the most prominent characteristic of the region due to the difference in heights and the lack of justice in the distribution of urban areas and blocks, this needs to be reconsidered in future studies of the region and its legislation. Laws must take into consideration this variety, which has recently become unfit for the urban area form.
Paying attention to the analysis process based on rapid procedures that suit current developments, as the reason behind choosing the tactics is so that the rates are rapid, because the changes are rapid. This research is directed towards an approach that will make it easy to accelerate cities as a case by case through numerical mathematical and engineering analysis without the need for strategies that may be achieved. Over the long term, it is difficult to control these changes.
[1] Moleiro, M., Mukherjee, A., Noennig, J.R. (2023). The TOSCA case: How open-source spatial and digital decision support tools help urban agglomerations to leapfrog towards smart sustainable cities. International Journal of E-Planning Research (IJEPR), 12(1): 1-16.
[2] Fernandez, T., Schroeder, S. (2023). GIS for sustainable urban transformation in countries with emerging economies: The case of piura in Peru. International Journal of E-Planning Research (IJEPR), 12(1): 1-20. https://doi.org/10.4018/IJEPR.319733
[3] Moudon, A.V. (1997). Urban morphology as an emerging interdisciplinary field. Urban Morphology, 1(1): 3-10. https://doi.org/10.51347/jum.v1i1.4047
[4] Fleischmann, M., Feliciotti, A., Romice, O., Porta, S. (2020). Morphological tessellation as a way of partitioning space: Improving consistency in urban morphology at the plot scale. Computers, Environment and Urban Systems, 80: 101441. https://doi.org/10.1016/j.compenvurbsys.2019.101441
[5] The social function of urban planning | roca gallery. (n.d.). http://www.rocagallery.com/the-social-function-of-urban-planning, accessed on Sep. 23, 2023.
[6] Fu, Y., Zhang, X. (2020). Mega urban agglomeration in the transformation era: Evolving theories, research typologies and governance. Cities, 105: 102813. https://doi.org/10.1016/j.cities.2020.102813
[7] Fang, C., Yu, D. (2017). Urban agglomeration: An evolving concept of an emerging phenomenon. Landscape and Urban Planning, 162: 126-136. https://doi.org/10.1016/j.landurbplan.2017.02.014
[8] Octifanny, Y., Hudalah, D. (2017). Urban agglomeration and extension in northern coast of West Java: A transformation into mega region. In IOP Conference Series: Earth and Environmental Science. IOP Publishing, 79(1): 012011. https://doi.org/10.1088/1755-1315/79/1/012011
[9] Scott, A.J., Agnew, J., Soja, E.W., Storper, M. (2001). Global city-regions: An overview. Global City Regions, Oxford University Press, Oxford.
[10] Fang, C., Yu, D. (2020). China's Urban Agglomerations. Springer, Cham. https://doi.org/10.1007/978-981-15-1551-4
[11] Demirpolat, A. (2021). Understanding de certeau's concepts of strategy and tactics in relation to the educational policy analysis. Educational Policy Analysis and Strategic Research, 16(3): 350-362.
[12] Wang, H., Newman, G., Wang, Z. (2019). Urban planning as an extension of war planning: The case of shenyang, China, 1898-1966. Journal of Contemporary Urban Affairs, 3(1): 1-12. https://doi.org/10.25034/ijcua.2018.4677
[13] Bakalchev, M., Bakalchev, V., Tasić, S. (2015). Forgetting the city: Tactics of transformation of the city in motion. Open Urban Studies and Demography Journal, 1(1). https://doi.org/10.2174/2352631901401010072
[14] Peterson, S., Row, K. (1979). Urban design tactics. Architectural Design, 49(3-4): 76-81.
[15] Deborah Middleton. (2012). Instrumental restitching and perceptual rotation: spatial recalibration strategies for monumental parks in historic cities. In Conference: Cities in Transformation Research & Design EAAE/ARCC International Conference on Architectural Research. https://www.researchgate.net/publication/315477036_Instrumental_Restitching_and_Perceptual_Rotation_Spatial_Recalibration_Strategies_for_Monumental_Parks_in_Historic_Cities.
[16] Araldi, A., Fusco, G. (2019). From the street to the metropolitan region: Pedestrian perspective in urban fabric analysis. Environment and Planning B: Urban Analytics and City Science, 46(7): 1243-1263. https://doi.org/10.1177/2399808319832612
[17] Szmytkie, R. (2008). Definicja i specyfika miast-zlepiencow. Czasopismo Geograficzne, 79(4): 355-366.
[18] Benze, A., Kutz, A., Ring, K. (2015). Conglomerate as Urban Tactic. Kuleuven.
[19] Virginia de Jorge-Huertas. (n.d.). COHABITATION ECO-STRATIGRAPHIES: Ecology and experimental habitat Hybrids.
[20] Fleischmann, M. (2019). Momepy: Urban morphology measuring toolkit. Journal of Open Source Software, 4(43): 1807. https://doi.org/10.21105/joss.01807
[21] GitHub-pysal/momepy: Urban morphology measuring toolkit. https://github.com/pysal/momepy, accessed on Jan. 24, 2024.
[22] Capturing the structure of cities with data science|martin fleischmann|university of liverpool. https://www.youtube.com/watch?v=itUX56Ks1UE, accessed on Sep. 23, 2023.
[23] Gis/cad data online map viewer|mygeodata map. (n.d.). https://mygeodata.cloud/map/, accessed on Sep. 24, 2023.
[24] Schirmer, P.M., Axhausen, K.W. (2016). A multiscale classification of urban morphology. Journal of Transport and Land Use, 9(1): 101-130. https://doi.org/10.5198/jtlu.2015.667
[25] Basaraner, M., Cetinkaya, S. (2017). Performance of shape indices and classification schemes for characterising perceptual shape complexity of building footprints in GIS. International Journal of Geographical Information Science, 31(10): 1952-1977. https://doi.org/10.1080/13658816.2017.1346257
[26] Dibble, J., Prelorendjos, A., Romice, O., Zanella, M., Strano, E., Pagel, M., Porta, S. (2019). On the origin of spaces: Morphometric foundations of urban form evolution. Environment and Planning B: Urban Analytics and City Science, 46(4): 707-730. https://doi.org/10.1177/2399808317725075