Mumin F. Hamad Al-Samarrai*![]() | Mahmood Z. Lafta
| Mahmood Z. Lafta![]() | Muath Jabbar Tarfa Al-Abbasee
| Muath Jabbar Tarfa Al-Abbasee![]() | Ola J. Muhammad
| Ola J. Muhammad![]()
© 2024 The authors. This article is published by IIETA and is licensed under the CC BY 4.0 license (http://creativecommons.org/licenses/by/4.0/).
OPEN ACCESS
A rapid, accurate, and sensitive method for the simultaneous quantification of paracetamol and phenylephrine hydrochloride was developed using RP-HPLC. The procedure utilized a NUCLEODUR® C18 separating column (250 × 4.6 mm id) with a flow rate of 0.8 mL/min and a column temperature of 25℃. The detector wavelength was set at 234 nm, and the injection volume was 20 μL. The mobile phase consisted of a mixture of acetonitrile and buffer solution (45 mM orthophosphoric acid, and the pH was adjusted to 6 using a 10% (w/v) sodium hydroxide solution) in a 52:48 v/v ratio. The method was validated with recovery percentages ranging from 99.36 to 105% for paracetamol and 99.78 to 100.8% for phenylephrine. The correlation coefficients were 0.9999 for both compounds, with linearity ranges of 2-100 µg/mL for paracetamol and 5-80 µg/mL for phenylephrine. This method has been successfully applied to the simultaneous quantification of these drugs in pharmaceutical preparations available in the local market.
paracetamol, phenylephrine, Simultaneous quantitative, RP-HPLC, chromatographic analysis
Paracetamol, also known as acetaminophen or N-(4-hydroxyphenyl)acetamide, is widely recognized for its analgesic and antipyretic properties [1, 2]. As an active ingredient in various pharmaceutical formulations, it enjoys extensive global usage due to its high efficacy, minimal side effects, and lower toxicity compared to other drugs [3]. Given its significance, numerous researchers have focused on analyzing this drug in its different forms, including tablets, syrups, and injections. Methods employed for estimating paracetamol concentrations include high-performance liquid chromatography [4-6], We observe that numerous researchers have heavily relied on optical spectroscopic methods for the quantitative estimation of various drugs [7], including those currently under investigation; flow injection analysis [8], first derivative spectroscopy [9, 10], UV-visible spectroscopy [11, 12], and electrochemical techniques [13, 14]. Figure 1 illustrates the chemical structure of paracetamol.
Figure 1. The paracetamol chemical structure
Phenylephrine hydrochloride, chemically termed as 3-[(1R)-1-hydroxy-2-(methylamino)ethyl]phenol hydrochloride, holds significant clinical importance, particularly in ophthalmology, where it is commonly utilized to enhance pupillary effects either in combination with other agents like tropicamide or when administered alone to maintain pupil dilation [15-17]. This pharmacological property makes phenylephrine a crucial component in various ophthalmic procedures and examinations, contributing to improved diagnostic accuracy and patient comfort.
Given its clinical relevance, numerous researchers have endeavored to quantify phenylephrine concentrations using various analytical techniques. Among these, UV-visible spectroscopy [18-21], derivative spectroscopy [22-24], and high-performance liquid chromatography (HPLC) [25-27] have emerged as commonly employed methods for phenylephrine quantification. Each of these techniques offers distinct advantages in terms of sensitivity, specificity, and ease of implementation, catering to the diverse needs and preferences of researchers in different analytical settings.
Figure 2 provides a visual representation of the chemical structure of phenylephrine, elucidating its molecular composition and structural characteristics. Understanding the chemical structure of phenylephrine is paramount for elucidating its pharmacological properties, mechanisms of action, and interactions with other compounds, thereby facilitating informed decision-making in clinical practice and research endeavors.
The present investigation is distinguished by an exceptionally high separation accuracy and a brief retention time. The apparent tailing, a phenomenon extensively discussed in previous studies, has been effectively addressed.
Figure 2. The chemical structure of phenylephrine hydrochloride
2.1 Materials and reagents
The standard solutions (std.) of paracetamol and phenylephrine utilized in this study were sourced from India, ensuring consistency and reliability in the reference materials employed for calibration and validation of the developed analytical method. These standard solutions, carefully selected for their purity and known concentrations, served as essential reference materials for quantification purposes, facilitating accurate determination of the target compounds in the pharmaceutical formulations under investigation.
Reagents employed in the chromatographic analysis, including acetonitrile, orthophosphoric acid, and sodium hydroxide, were procured from the renowned supplier, Sigma-Aldrich company. The use of high-quality reagents from reputable suppliers ensures the integrity and reliability of the analytical results, minimizing potential sources of variability and ensuring consistency in experimental outcomes.
Double-distilled water, renowned for its high purity and absence of impurities, was utilized throughout the experiment to prepare mobile phases, standard solutions, and rinse solutions. The use of double-distilled water helps minimize background noise and interference in chromatographic analyses, ensuring the accuracy and reproducibility of the results obtained.
The pharmaceutical formulations analyzed in this study contained 500 mg of paracetamol and 5 mg of phenylephrine per dosage unit. These formulations, sourced from the local market, represent commonly available pharmaceutical products intended for the relief of various symptoms. Analysis of these formulations using the developed RP-HPLC method provides valuable insights into the accuracy and reliability of the method in quantifying the active ingredients in real-world pharmaceutical samples.
2.2 Chromatographic conditions
A Jasco HPLC system was utilized, comprising a PD 1000 detector, an AS 3000 auto sampler, and a 3500 pump. A NUCLEODUR® C18 separator column (250 × 4.6 mm ID) ec was employed for the analysis. The operational conditions were as follows: a flow rate of 0.8 mL/min, column temperature of 25℃, a detector wavelength (λ_max) of 234 nm, and an injection volume of 20 μL. The mobile phase (MP) consisted of a 52:48 (v/v) mixture of acetonitrile and a buffer solution. The buffer solution contained 45 mM orthophosphoric acid, and the pH was adjusted to 6 using a 10% (w/v) sodium hydroxide solution )A Jenway model pH meter, specifically the 3510 pH Meter, was employed for the measurement of pH). To remove impurities, Whatman filter paper No. 40 was utilized until the prepared solutions achieved the requisite purity and measurability due to the pore size related to the expected size of impurities.
2.2.1 Solutions
The solvents utilized in this study were of HPLC grade, selected for their high purity and compatibility with chromatographic analyses. The meticulous choice of HPLC-grade solvents ensures the absence of impurities that could interfere with the accuracy and reproducibility of the analytical results. By employing solvents of superior quality, potential sources of variability are minimized, thus enhancing the reliability and robustness of the developed analytical method.
In contrast, other materials utilized in the study were procured from the local market in Iraq, reflecting the practical considerations and availability constraints often encountered in research settings. Despite their local procurement, these materials were carefully selected to meet the specific requirements of the experimental procedures while ensuring cost-effectiveness and practical feasibility.
The combination of HPLC-grade solvents and locally sourced materials underscores the pragmatic approach adopted in this research, balancing the need for analytical precision with practical considerations of accessibility and affordability. While HPLC-grade solvents guarantee the integrity of the chromatographic analysis, the utilization of locally sourced materials reflects the adaptability and resourcefulness inherent in scientific research conducted in diverse settings.
The use of locally procured materials also aligns with the principle of sustainability and support for local economies, contributing to the socio-economic development of the region. By leveraging locally available resources without compromising on the quality and integrity of the research outcomes, this study exemplifies the integration of global best practices with local context-specific considerations.
(1) Preparation of standard solutions
Paracetamol and phenylephrine standard solutions were meticulously prepared according to established protocols to facilitate calibration and validation of the developed RP-HPLC method. The preparation procedure ensured precise concentration control and reproducibility of the standard solutions, essential for accurate quantification of the target compounds.
For the preparation of the paracetamol solution, 0.1 gram of paracetamol was carefully dissolved in an appropriate volume of mobile phase solution, ensuring complete solubilization of the compound. Subsequently, the volume was adjusted to 100 mL using the same solvent in a volumetric flask of suitable capacity. This resulted in a paracetamol solution with a concentration of 1×10³ µg/mL. The prepared solution was then transferred into opaque containers and stored at laboratory temperature to maintain stability and prevent degradation.
Similarly, the phenylephrine standard solution was prepared by dissolving 0.1 gram of phenylephrine in an appropriate volume of mobile phase solution, followed by volume adjustment to 100 mL using the same solvent in a volumetric flask. This yielded a phenylephrine solution with a concentration of 1×10³ µg/mL. Like the paracetamol solution, the phenylephrine solution was also transferred to opaque containers and stored under laboratory temperature conditions to preserve its integrity and stability over time.
The meticulous preparation of standard solutions according to standardized procedures ensures the accuracy and reliability of calibration curves constructed for quantification purposes. By adhering to stringent protocols and employing precise volumetric techniques, potential sources of variability and error are minimized, thereby enhancing the robustness and reproducibility of the analytical method.
(2) Preparation of sample solution
Ten tablets containing both paracetamol (para) and phenylephrine (phe) were weighed and thoroughly crushed. An equivalent amount to one tablet (containing 500 mg of paracetamol and 5 mg of phenylephrine) was transferred to a 100 mL volumetric flask. The mixture was then dissolved in a solvent mixture of acetonitrile and buffer this combination was chosen to mitigate the risk of unintended signals coinciding with the anticipated signals for the materials under assessment. Subsequently, the solution was filtered using Whatman #40 filter paper until clear and suitable for measurement.
3.1 Optimization
The optimization of method conditions is essential for achieving accurate and efficient separation of analytes in chromatographic analyses. In this study, the optimal conditions for the analysis of phenylephrine and paracetamol were refined by altering the pH of the mobile phase, a critical parameter that significantly influences chromatographic performance.
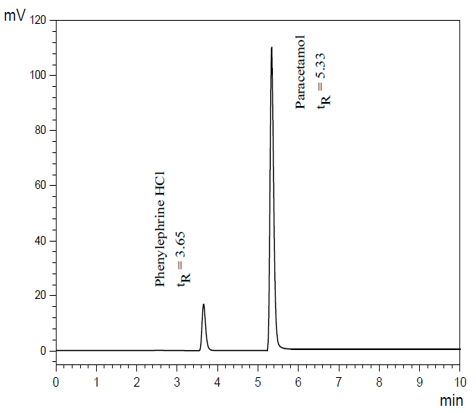
Figure 3. A typical chromatogram containing a mixture of paracetamol and phenylephrine
The mobile phase utilized throughout the study consisted of a 52:48 (v/v) mixture of acetonitrile and a buffer solution containing 45 mM orthophosphoric acid. Initially, the pH of the mobile phase was adjusted to 6 using a 10% (w/v) NaOH solution. Under these conditions, the initial peak sequence for the two drugs was observed at retention times of 3.65 min for phenylephrine and 5.33 min for paracetamol, as depicted in Figure 3. This mobile phase composition served as the baseline for subsequent experiments.
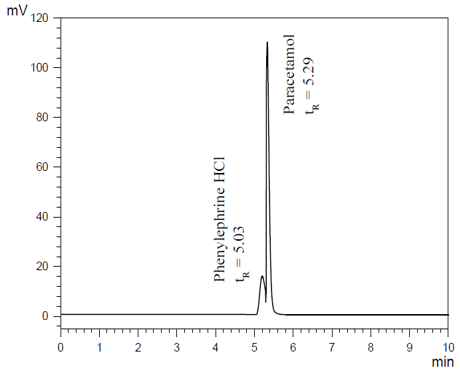
Subsequent investigations involved modifying the pH of the buffer solution in the mobile phase to evaluate its impact on chromatographic performance. Increasing the pH to 7 with a 10% NaOH solution did not alter the retention order or times of the two drugs. However, adjusting the pH to 5 using the same solution resulted in changes in retention times and peak shapes. The new retention times were observed to be 5.03 min for phenylephrine and 5.29 min for paracetamol, indicating variability in retention time and separation efficiency at pH 5, as illustrated in Figure 4.
Figure 4. Typical mobile-phase chromatogram with pH 5 showing a clear difference in retention time and peak shape for a mixture containing paracetamol and phenylephrine
Through systematic experimentation and analysis, it was determined that a pH of 6 provides the optimal conditions for achieving the desired separation efficiency and asymmetry value, as detailed in Table 1. These conditions ensure adequate resolution and peak shape for both phenylephrine and paracetamol, facilitating accurate and reproducible quantification of the drug mixture.
Table 1. Theoretical plate number and asymmetry values
|
Drugs |
pH |
N |
As |
|
Paracetamol |
5 |
2376 |
1.357 |
|
6 |
3987 |
0.934 |
|
|
Phenylephrine HCl |
5 |
798 |
1.456 |
|
6 |
1053 |
1.064 |
N = Theoretical plates
As = Asymmetry
3.2 Calibration curve
The calibration curves for paracetamol and phenylephrine were constructed to assess the linearity of the developed method across a range of concentrations. Table 2 delineates the observed linearity ranges for both drugs, providing insights into the method's ability to accurately quantify their concentrations over a wide dynamic range.
Table 2. Calibration curves results for the two drugs*
|
Drugs |
LOD (µg/mL) |
Precision (%RSD) |
Linearity (µg/mL) |
Linear Regression Equation with Coefficient of Correlation |
|
Paracetamol |
1.002 |
1.358 |
2-100 |
Y = 88573x - 53719 = 0.9999 |
|
Phenylephrine HCl |
0.504 |
0.031 |
5-80 |
Y = 5686.1x - 8010.1= 0.9999 |
*n = 3
The constructed calibration curves exhibited excellent linearity, with linear regression analysis yielding correlation coefficients of 0.9999 for both paracetamol and phenylephrine. Specifically, the linearity ranges were determined to be 2-100 µg/mL for paracetamol and 5-80 µg/mL for phenylephrine. These expansive linear ranges underscore the versatility and suitability of the developed method for quantifying varying concentrations of the target compounds with high precision and reliability.
The observed linearity across such broad concentration ranges highlights the method's robustness and efficacy in accommodating diverse sample matrices and concentration levels encountered in pharmaceutical analysis. Furthermore, the high correlation coefficients obtained for both paracetamol and phenylephrine affirm the consistency and accuracy of the method's response across the tested concentration ranges.
The establishment of well-defined calibration curves with wide linear ranges is crucial for accurate and reliable quantification of analytes in complex samples. The method's ability to maintain linearity over a broad concentration range enhances its applicability in pharmaceutical quality control, where the concentrations of active ingredients may vary significantly among different formulations.
3.3 Method accuracy
The accuracy of the proposed method was rigorously evaluated through the calculation of percentage recoverability, as detailed in Table 3. The results unequivocally demonstrate that the developed method for simultaneous determination of paracetamol and phenylephrine exhibits exceptional accuracy.
Analysis of Table 3 reveals recoverability rates ranging from 99.36% to 105% for paracetamol and 99.78% to 100.8% for phenylephrine. These recovery percentages indicate the method's ability to quantitatively retrieve the target compounds from pharmaceutical preparations with remarkable precision and consistency. The narrow range of recovery rates further underscores the method's reproducibility and reliability across different sample matrices and concentration levels.
Table 3. The Rec% tests results for the drug*
|
Drugs |
Concentration |
||
|
taken (µg/mL) |
found (µg/mL) |
Rec% |
|
|
Paracetamol |
2 |
2.10 |
105.0 |
|
60 |
59.62 |
99.36 |
|
|
Phenylephrine HCl |
5 |
5.04 |
100.8 |
|
60 |
59.87 |
99.78 |
|
*n = 3
The observed high accuracy of the proposed method holds significant implications for its practical utility in quantitative determination of paracetamol and phenylephrine in pharmaceutical formulations. The ability to accurately quantify these active ingredients is paramount for ensuring the efficacy, safety, and compliance of pharmaceutical products. Therefore, based on the robust accuracy demonstrated by the method, it can be confidently recommended for adoption in routine quality control analyses within pharmaceutical manufacturing facilities and regulatory laboratories.
3.4 Application
The applicability of the developed method was assessed through its successful implementation on various locally available pharmaceutical formulations. Table 4 presents the recoverability rates obtained for paracetamol and phenylephrine, further elucidating the method's performance in real-world sample analysis.
Analysis of Table 4 reveals recoverability rates ranging from 95.8% to 100.18% for paracetamol and 97.8% to 99.83% for phenylephrine across the tested pharmaceutical formulations. These results underscore the method's robustness and versatility in accurately quantifying the target compounds within complex matrices representative of commercial pharmaceutical products.
Table 4. Application of the method
|
Sample |
Concentration Taken (µg/mL) of Drug |
Weight* Found (mg/dosage) |
Recovery % |
RSD% |
|
Lemsip Cold & Flu Lemon/ tablet (500mg Paracetamol & 5mg phenylephrine) |
250 of Paracetamol |
500.91 |
100.18 |
1.45 |
|
5 of phenylephrine |
4.79 |
95.8 |
4.24 |
|
|
Panadol Cold & Flu plus/ tablet (500mg Paracetamol & 5mg phenylephrine) |
250 of Paracetamol |
499.17 |
99.83 |
1.98 |
|
5 of phenylephrine |
4.89 |
97.8 |
3.03 |
*n = 3
The consistently high recoverability rates attained across different formulations reaffirm the method's reliability and effectiveness in quantifying paracetamol and phenylephrine concentrations. Such uniform performance underscores the method's potential as a valuable tool for routine quality control analyses in pharmaceutical manufacturing settings.
The successful application of the developed method to locally available pharmaceutical formulations not only validate its efficacy but also highlights its practical relevance and utility in real-world analytical scenarios. By enabling accurate and reproducible determination of active ingredient concentrations, the method contributes to the assurance of product quality, efficacy, and safety in the pharmaceutical industry.
3.5 Stability of solutions
The stability of standard and sample solutions was evaluated at intervals of 12, 24, and 48 hours. Stability was determined based on the quantification of drugs in both the standard and sample solutions compared to freshly prepared standard solutions. The assay values' relative standard deviation measured up to 48 hours were 0.86% for paracetamol and 0.67% for phenylephrine, indicating that the solutions-maintained stability for 48 hours at ambient temperatures, which is room temperature and protected from light using dark bottles.
In conclusion, the developed RP-HPLC method offers an efficient means for the simultaneous estimation of paracetamol and phenylephrine in pharmaceutical preparations. Through rigorous validation procedures, this method has demonstrated remarkable accuracy and reliability, establishing itself as a valuable tool for quality control departments tasked with verifying the composition of pharmaceutical products containing both paracetamol and phenylephrine. Scrutiny of the statistical processes employed in this study reveals a high level of accuracy and agreement. The method consistently achieved accuracy within the range of 97.8% to 100.18%, indicating its precision in quantifying the target compounds. Agreement analysis further underscores the robustness of the method, with agreement values falling within the narrow range of 0.031% to 1.358%. Such close agreement between calculated and expected values reinforces confidence in the method's ability to provide reliable quantification results. Moreover, the method exhibits commendable sensitivity, as evidenced by the observed detection limit ranging from 0.504 to 1.002 µg/mL. This sensitivity underscores the method's capability to detect even trace amounts of paracetamol and phenylephrine in complex pharmaceutical matrices, thereby enhancing its utility in various analytical applications. In summary, the developed RP-HPLC method not only fulfills the essential criteria of accuracy, reliability, and sensitivity but also demonstrates practical applicability in real-world quality control scenarios. Its ability to provide precise and reliable quantification of paracetamol and phenylephrine positions it as a valuable asset for pharmaceutical analysis, contributing significantly to the assurance of product quality and compliance with regulatory standards.
[1] Thanoon, E.S. (2019). Spectrophotometric determination of paracetamol using diazotization coupling reaction. Rafidain Journal of Science, 28(2): 76-83. https://doi.org/10.33899/rjs.2019.159979
[2] Budavari, S. (1996). The Merck Index: An Envcyclopedia of Chemicals, Drugs and Biologicals (12th ed). Merck, Whitehouse Station.
[3] Penna, A., Buchanan, N. (1991). Paracetamol poisoning in children and hepatotoxicity. British Journal of Clinical Pharmacology, 32(2): 143-149. https://doi.org/10.1111/j.1365-2125.1991.tb03873.x
[4] Al-Obaidi, Z.M., Al Ani, A.A., Al-Juhaishi, A.M., Hussein, A.N. (2019). A comparative study for the quantification of paracetamol in multicomponent oral solution employing standard addition method utilized in UV-Visible spectroscopy and RP-HPLC. Journal of Pharmaceutical Sciences and Research, 11(2): 339-342.
[5] Belal, T., Awad, T., Clark, R. (2009). Determination of paracetamol and tramadol hydrochloride in pharmaceutical mixture using HPLC and GC-MS. Journal of Chromatographic Science, 47(10): 849-854. https://doi.org/10.1093/chromsci/47.10.849
[6] Pereira, F.J., Rodríguez-Cordero, A., López, R., Robles, L.C., Aller, A.J. (2021). Development and validation of an RP-HPLC-PDA method for determination of paracetamol, caffeine and tramadol hydrochloride in pharmaceutical formulations. Pharmaceuticals, 14(5): 466. https://doi.org/10.3390/ph14050466.
[7] Hanoon, I.T., Al-Samarrai, M.F.H., Lafta, M.Z. (2022). Immediate real-time estimation of a combination of drugs containing amino groups with ultraviolet spectroscopy. International Journal of Drug Delivery Technology, 12(1): 225-230.
[8] Bloomfield, M.S. (2002). A sensitive and rapid assay for 4-aminophenol in paracetamol drug and tablet formulation, by flow injection analysis with spectrophotometric detection. Talanta, 58(6): 1301-1310. https://doi.org/10.1016/s0039-9140(02)00421-6
[9] Alkhafaji, S.L., Mahood, A.M. (2019). First-order derivative and UV-spectrophotometric methods for simultaneous determination of paracetamol, ibuprofen, and caffeine in bulk and parmaceutical formulatation. Journal of Pharmaceutical Research International, 25(2): 1-14. https://doi.org/10.9734/jpri/2018/46503
[10] Ebrahimi, M., Sohrabi, M.R., Motiee, F., Davallo, M. (2021). Rapid simultaneous spectrophotometric determination of acetaminophen, phenylephrine, and guaifenesin in a cold syrup formulation based on continuous wavelet transform and first derivative transform methods. Optik, 230: 166323. https://doi.org/10.1016/j.ijleo.2021.166323
[11] Abbas, R.F., Allawi, A.G., Abdulhassan, N.M., Mahmoud, N.H. (2020). spectrophotometric determination of paracetamol using a newly synthesized chromogenic reagent 4-[(2-amino-1, 3thiazol-4-yl) amino] nitro benzene. Egyptian Journal of Chemistry, 63(12): 4681-4693. https://doi.org/10.21608/EJCHEM.2020.17136.2053
[12] Thanoon, E.S., Raheed, L.A., Hasan, I.Y. (2021). Oxidative coupling-base reaction for the indirect spectrophotometric determination of paracetamol in drug formulations. International Journal on Engineering, Science and Technology, 3(1): 72-78.
[13] Amayreh, M., Hourani, W., Hourani, M.K. (2021). Voltammetric determination of paracetamol in pharmaceutical formulations at iodine-coated polycrystalline platinum electrode. Methods and Objects of Chemical Analysis, 16(2): 103-111.
[14] Laghrib, F., Hammani, H., Farahi, A., Lahrich, S., Aboulkas, A., El Mhammedi, M.A. (2021). Electrochemical determination of paracetamol in blood and pharmaceutical formulations using activated carbon electrode. Russian Journal of Electrochemistry, 57(2021): 532-543. https://doi.org/10.1134/s1023193520120101
[15] Aljeboree, A., Alshirifi, A. (2018). Spectrophotometric determination of phenylephrine hydrochloride drug in the existence of 4-aminoantipyrine: Statistical study. International Journal of Pharmaceutical Research, 10(2018). https://doi.org/10.31838/ijpr/2018.10.04.103
[16] Aljeboree, A.M., Alshirifi, A.N. (2018). Colorimetric determination of phenylephrine hydrochloride drug using 4-Aminoantipyrine: Stability and higher sensitivity. Journal of Pharmaceutical Sciences and Research, 10(7): 1774-1779.
[17] Aljeboree, A.M., Alshirifi, A.N. (2018). Adsorption of pharmaceuticals as emerging contaminants from aqueous solutions on to friendly surfaces such as activated carbon: A review. Journal of Pharmaceutical Sciences and Research, 10(9): 2252-2257.
[18] Abbas, M.N., Mostafa, G.A. (2001). Spectrophotometric determination of phenylephrine using p-aminophenol and potassium periodate. Egyptian Journal of Chemistry, 44(1-3): 141-149.
[19] Farid, J.F., Mostafa, N.M., Fayez, Y.M., Essam, H.M. and ElTanany, B.M. (2022). Chemometric quality assessment of paracetamol and phenylephrine hydrochloride with paracetamol impurities; comparative UV-spectrophotometric implementation of four predictive models. Spectrochimica Acta Part A: Molecular and Biomolecular Spectroscopy, 265: 120308. https://doi.org/10.1016/j.saa.2021.120308
[20] Thu, N.A. (2021). Quantification of acetaminophen, caffeine and ibuprofen in solid dosage forms by UV spectroscopy coupled with multivariate analysis. Asian Journal of Pharmaceutical Analysis, 11(2): 127-132. https://doi.org/10.52711/2231-5675.2021.00022
[21] Mahmoud, A.R., Al-Healy, F.M. (2021). UV-Spectral studies on chlorpheniramine maleate in pure form and pharmaceutical preparations. Egyptian Journal of Chemistry, 64(8): 4151-4156.
[22] Aljeboree, A.M., Alshirifi, A.N. (2019). Simultaneous spectrophotometric determination of phenylephrine hydrochloride and amoxicillin via derivative spectrophotometry. International Journal of Drug Delivery Technology, 39(3): 502-508.
[23] Anandakumar, K., Veerasundari, P. (2014). Simultaneous estimation of paracetamol, ambroxol hydrochloride, levocetirizine dihydrochloride, and phenylephrine hydrochloride in combined tablet formulation by first-order derivative spectrophotometry. International Scholarly Research Notices, 2014: 248960. https://doi.org/10.1155/2014/248960
[24] Kazemipour, M., Ansari, M. (2005). Derivative spectrophotometry for simultaneous analysis of chlorpheniramine maleate, phenylephrine HCl, and phenylpropanolamine HCl in ternary mixtures and pharmaceutical dosage forms. IJPR-Iranian Journal of Pharmaceutical Research, 4(3): 147-153.
[25] Palur, K., Archakam, S.C., Koganti, B. (2020). Chemometric assisted UV spectrophotometric and RP-HPLC methods for simultaneous determination of paracetamol, diphenhydramine, caffeine and phenylephrine in tablet dosage form. Spectrochimica Acta Part A: Molecular and Biomolecular Spectroscopy, 243: 118801. https://doi.org/10.1016/j.saa.2020.118801
[26] Sonone, R., Tandel, L., Jain, V. (2021). Novel rapid isocratic RP-HPLC method for simultaneous estimation of phenylephrine hydrochloride, paracetamol, caffeine, diphenhydramine hydrochloride. Current Pharmaceutical Analysis, 17(6): 792-800. https://doi.org/10.2174/1573412916999200430091855
[27] Zafirova, M., Acevska, J., Ugrinova, L., Petrovska-Dimitrievska, G., Karchev, V., Nakov, N., Brezovska, K., Dimitrovska, A., Petkovska, R., Anastasova, L., Tonic-Ribarska, J. (2018). Development and optimization of a generic HPLC method for the simultaneous determination of common ingredients in multi component cough and cold oral drug products using chemometrics. Macedonian Pharmaceutical Bulletin, 63(1): 49-65. https://doi.org/10.33320/maced.pharm.bull.2017.63.02.006