Attipo Reisch Vanel*![]() | Aholou Cyprien Coffi
| Aholou Cyprien Coffi![]()
© 2024 The authors. This article is published by IIETA and is licensed under the CC BY 4.0 license (http://creativecommons.org/licenses/by/4.0/).
OPEN ACCESS
This study assesses the risk perception of flooding victims, sensitivity and exposure of people to flooding between November and December 2019 in Brazzaville, Congo. To achieve our objective, a questionnaire was administered to 382 people living in the zone of our research. Methodologically, an analysis of socio-economic indicators such as age, level of education, income, gender, risk exposure indicators (location, house typology, height of water, duration of flooding, etc.), sensitivity indicators (time in the area, cause of flooding, experience of flooding, type of house, etc.) as well as adaptation measures (risk response, adaption strategies, return to normal, relief and help, etc.) were done and used to highlight the extent of recovery of flood victims. Based on the findings of this study, it came out that 71.5% of those surveyed were not aware of the risks, while 28.5% had some few knowledge of the risk. The study also found that 72.2% of people living in flood-prone areas were not aware of the risks of flooding in their location. During that period, the Government of Congo provided supplies and palliatives such as food, medication, and temporary housing to some victims. Sequel to the findings of this study, it is recommended that the government of Congo (Brazzaville) works on heightening awareness regarding flood risks and provide indicators that can be used to enhance cities’ resilience against flooding.
risk perception, vulnerability, flooding, public awareness, Brazzaville, disaster management
Axiomatically, cities are vulnerable to a variety of natural hazards due to the concentration of population, infrastructure and economic activities. The level of vulnerability depends on many factors such as the location, urban planning, adherence to building codes, and emergency preparedness. Proximity to coasts or rivers amplifies the vulnerability of specific risks like hurricanes and floods, making therefore cities near these areas potentially vulnerable. Besides, it is worth mentioning that cities might also be vulnerable to the impact of changing weather patterns, storms and rising sea level, leading to more frequent and intense natural disasters. The last but not the least, unplanned urbanization, the proliferation of informal settlements and the inadequacy or absence of sanitation infrastructure further elevate vulnerability to hazards in urban environments.
According to study by Barroca et al. [1], many cities in the world are highly sensible to natural hazards. This situation sets up additional burdens on residents while increasing local and national authorities’ concerns. For the authors, these facts reveal the deficiencies in the prevention system and the vulnerability of local authorities when confronted with risks. This begs the question of the pertinence and efficiency of the implemented preventive measures. If studies on hazard are more or less abundant, resources on vulnerability are scarce. Hubert and Ledoux [2] define vulnerability as "the measure of the damaging consequences of flooding on the issues at stake" or "the fragility of a socio-economic system as a whole in the face of risk".
This study conceives flood risk as the combination of the probability of a flood event and its potential adverse consequences. In the same vein, danger represents a random natural phenomenon. Concerning risk, it is a physical event with probable or random natural event. The indicator assessing adaptive capacity considers information like poverty levels, education, gender and age. Given that, in this study, vulnerability is conceptualized as the gap between a community ability to adapt and its responsiveness and exposition to a hazard. Clearly, damage propensity is a common characteristic of vulnerability. Gleyze [3] and Leneveu and Mary Laville [4] clearly buttress this point in their research by asserting that vulnerability is associated with potential adverse effects. For studies [5-7], vulnerability is generally characterized by a propensity to cause harm.
Messner and Meyer [8] consider that, in the context of flood risk assessment, the exposure comprises two indicators, notably, the exposure to the risk (proximity to a river, elevation of the zone, frequency of flooding) and the feature of the area. This study notes that vulnerability assessment was initially limited to assessing the extent of damage caused by a particular hazard [9], but was broadened in 1980 to include three concepts: exposure, sensitivity issues and suitability [10, 11]. The sensitivity indicator assesses the impact of flood depth and duration on a specific location (e.g. a building). It also assesses the awareness and preparedness of people living in those risky areas, their ability to protect against flooding and to cope with the consequences. Concerning the adaptive capacity indicator, it takes into consideration data like poverty rate, level of education, gender and age. This study found that many researches on flood vulnerability focus only on a single component, instead of taking a holistic approach.
Several studies on vulnerability to flooding in Brazzaville focus either on socio-economic indicators alone or on loss and damage. This study fills the gap by using a holistic approach of flood risk, which involve considering and combining several elements like the probability of the occurrence of a flood and the possible negative impacts. Choosing a methodology with several indicators enables a holistic approach to be taken to vulnerability as a whole.
The expansion of Brazzaville has resulted in the emergence of impermeable surfaces, which, combined with the encroachment of major river beds increased flooding and leading to damage (resulting in the loss of property and lives). To worsen the situation, even minor rainfalls are exerting a devastating effect on the urban environment. Rainwater poses multifaceted consequences for public health, the environment, land, urban infrastructure, and economic development. As far as rainstorms are concerned, they can be violent, particularly affecting Brazzaville's outskirts districts situated in water-vulnerable areas. In addition, it has been noted that new extensions or unpaved roads frequently have small depressions along their length, accumulating water after rainstorms. The frequent use of these roads by an increasing number of vehicles, couple with irregular maintenance, likely contribute to this issue. A perfect case according to study by Louembe [12] is the modern district of Diata, in Brazzaville. In this particular district, some roads have chains of "mini-lakes" that make driving difficult after every heavy downpour.
The vulnerability of certain neighborhoods in the capital of Congo is due to natural disasters and anthropogenic action. Cross-cutting factors contributing to this vulnerability include intense rainfall, rapid growth of the urban population, unauthorized land appropriation outside the official system and various elements that exacerbate environmental risks. For instance, during the end of year 2019, torrential rains caused loss of life and material damage. In addition, houses and roads were swallowed up by rainwater while traffic was disrupted. The flooding affected some other departments in the country like Sangha, Likouala, Cuvette and Plateaux, where more than 50,000 people were homeless. According to the residents of affected areas, if such situation occurred, it is due to a weak drainage system for run-off water. This study focuses only on flooding in the city of Brazzaville in 2019 and does not pretend to examine other cities. It also assesses the vulnerability of the population to flooding. To achieve this objective, the study analyses indicators of exposure, sensitivity and adaptive capacity with the view of highlighting the level of public awareness and vulnerability to flooding.
Vulnerability analysis uses a variety of approaches. The first approach adopts a socio-economic vulnerability assessment while focusing on political and socio-economic conditions specific to certain groups of people. It is deemed that most of the time, members of communities have different levels of political power, money, formal and informal (social) capital, education, health, credit availability and other characteristics that influence their degree of vulnerability [13]. The second approach, also known as impacts analysis at times, is a biophysical approach and seeks to assess the degree of impact of a specific environmental stress on a biological and social system. According to Liverman’s study [14], the first objective is the susceptibility or degradation of biophysical circumstances. This approach is most of the time used in studies concerning the relationship between climate change and natural disasters susceptibility [15]. For study by Füssel and Klein [16], this is a risk and hazard tactic as the biophysical approach is highly instructive, yet it has some shortcomings. One of the first shortcomings is that understanding the intricate dynamics of vulnerability requires more than just evaluating biophysical characteristics as it has to side-line the way human activity and institutional factors contribute to vulnerability, making it difficult for people to cope and adapt. The third and last approach, also known as the integrated process, combines socio-economic and biophysical strategies to determine vulnerability. The holistic approach to vulnerability analysis is in line with the Intergovernmental Panel on Climate Change (IPCC) definition according to study by Füssel and Klein [16], that apprehends climate vulnerability as a combination of adaptive capacity, sensitivity and exposure. Füssel and Klein [16] point out that while adaptive capacity (broader social development) is in line with the socio-ecological approach, the risk-danger binomial (biophysical approach) is equivalent to sensitivity in the IPCC nomenclature.
This study adopts this last approach, as it is more global and incorporates all the important indicators for a complete and comprehensive analysis of the perception of risk and vulnerability to flooding.
Vulnerability = (Adaptive Capacity) - (Exposure + Sensitivity)
The analysis of this study is based on socio-economic, sensitivity, exposure and adaptation indicators. The data are collected mainly from primary and secondary sources. For the primary sources, we administered a questionnaire to 382 inhabitants of Brazzaville who live in 6 municipalities that face flooding every rainy season. The concerned municipalities are: Talangai, Madibou, Djiri, Ouenzé, Mfilou and Moungalie. To improve the reliability of the data collected, we carried out a representative sampling and ensured that the respondents of the survey were actually those affected and experienced flooding. In addition, an emphasis was put on the worst-affected alleyways in all the communes to ensure good special coverage. Finally, all information was collected through kobo collect tool and analyzed through Microsoft Excel.
The samples were identified as all the heads of household in the communes concerned by the study. The second stage units were selected on the basis of a random draw. Having identified the size (N) of the households, a sampling rate (SR) of 1/250 was applied to determine the size (n) of the sample to be used for the survey. The samples consisted of all the heads of household in the communes covered by the study. The selection of a second-level units was based on a random draw. Having identified the size (N) of the households, a sampling rate (SR) of 1/250 was applied to determine the size (n) of the sample to be used for the survey on the basis of the following formula: n = N × SR. We counted 95,526 households, and applying the above formula, we collected data from 382 households. For the sake of reliability, we ensured that respondents lived in the area before or during the 2019 floods. It should be emphasized that the entire data collection process was carried out with the respondent's consent and anonymously.
Four main variables were included in the data collection, each with its own sub-variables: socio-economic (age, gender, education, occupation, etc.); exposure (frequency of flooding, distance between home and watercourse, etc.); sensitivity (duration of flooding, height of water, knowledge of risks involved, previous experience, etc.); and recovery capacity (management techniques, return to normal, adaptation measures, assistance, etc.).
Secondary data collection was primarily based on annual fire stations reports, national environmental protection agency reports, documented reports, published studies relating to flooding in Brazzaville, official websites, local newspapers and scientific magazines. Rainfall data came from the national meteorological station of Brazzaville. Within these institutions, we collected information on the most sensitive sectors and exposed to flooding, the preventive and curative measures taken by the national authorities, the losses and damage in the city, the ways in which people adapted, etc.
Once all data were collected through kobo collect tool, data processing were carried out using the Excel software.
3.1 Study area
The main metropolitan area of the Republic of Congo is Brazzaville, which also serves as the political capital of the country. It is located on the right bank of the Congo River. Brazzaville is administratively organized into nine districts: Madibou, Moungali, Mfilou, Djiri, Makélékélé, Bacongo, Poto-poto, Ouenzé and Talangai. Brazzaville is a versatile city that welcomes a large influx of new citizens each year. It has the legal status of a department. The Congo River borders it to the east, the Pool department to the west and the Pool department to the north and south. Brazzaville's coordinates are latitude 4°16.014' south, longitude 15°16.9962' east, expressed in degrees and minutes. Currently, the population is 1,696,392 [17] and lives within its 263.9 km2 territory, resulting in a density of 5,204 people per km2. The rural flight is at the root of this urban expansion [18]. Environmental effects are also a result of population growth.
Everything that surrounds us and constitutes our living space is referred to as the urban environment. According to study by Sachs-Jeantet [19], the term "urban environment" also encompasses urban management, the democratization of management techniques, and the place of urban issues in public policy. Within the framework of our investigation, the urban environment of Brazzaville encompasses both liquid sanitation and rainfall management. There are several issues facing Brazzaville's urban environment. Some issues include, overcrowding, a problem of mobility during the rainy season, flooding, and the vulnerability of urban networks to flooding and erosion. The lack of a real master plan and uncontrolled occupation of land (especially in neighborhoods not subdivided and at the mercy of landowners and certain populations), lead to the development of erosion sites [20].
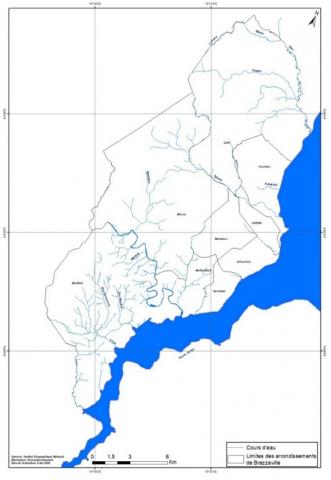
3.1.1 Hydrography
The Djiri, the Kélékélé, the Tsiémé, the Madoukou, the M'foa, the M'filou, the Djoué and the Loua are the most important rivers which cross Brazzaville from west to east. The city's hydrographic network is entirely included in the Congo River basin. The two most important rivers are the Djoué in the south, which flows more than 500 m³/second, and the Djiri in the north, which flows 300 m³/second on average. On the other hand, the Tsiémé in the center, which covers five (05) communes, is the largest watershed, comprising 6,370 ha [21].
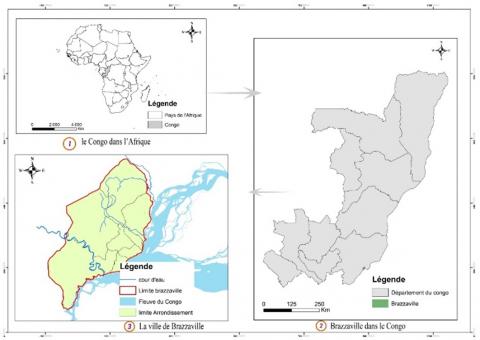
Figure 1. (1) Map of Africa; (2) Congo map; (3) Map of the city of Brazzaville
Figure 1 shows the geographical location of the Republic of Congo, whose capital is Brazzaville, within the African continent. This is the grey area on Map 1 (1). Then, on Map 2, the figure shows in green the geographical position of the city of Brazzaville, which is our study area, on the map of Congo, with an administrative breakdown of the country's various departments. And finally, in part 3, the figure shows us a map of the city of Brazzaville, with the city's various communes and all the watercourses, in the form of a blue line, that cross the city. The red line marks the city limits of Brazzaville. While the blue line inside the red boundary represents the watercourses, the blue area outside the red line represents the Congo River, which is where the watercourses fall and is the natural boundary of the eastern side of the city of Brazzaville.
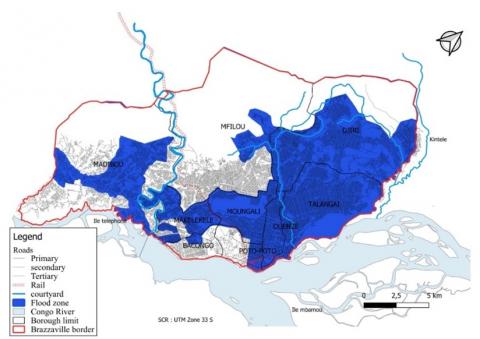
3.1.2 Urban flooding in Brazzaville in 2019
Flooding is the temporary, natural or artificial submergence of land. It is one of the most common and challenging urban development problems in Brazzaville (Figure 2). The risk of flooding stems from two factors: the water, which can leave its usual flowing bed, and people establishing settlements, buildings, equipment and activities in the alluvial space.
The rivers that serve as natural collectors (catchment areas spanning 12,510 ha and total length of 41.5 km) and various structures (collectors, outfalls, gutters) that amount 135,740 km and converge towards the Congo River and its tributaries form the foundation of Brazzaville's rainwater drainage network (Figure 3) [22].
The catchment areas of the collectors have been divided into sub-catchment areas, taking into account, on the one hand, the structuring axes such as the urban roads, and on the other hand, singularities such as buried structures or road crossings. The reason for flooding in the city's lower regions is specifically due to the obstruction in the network. Indeed, the rainwater drainage networks are inadequate, but they are also poorly maintained. To worsen the situation, there are no solid waste management systems in place, which forces residents to use riverbeds and existing sewage works as dumps.
It is possible that an area's drainage and infiltration capabilities are inadequate to remove the water that is received, leading to its accumulation. When soil becomes impermeable due to urbanization without a sufficient drainage network being established, as is the case in the city of Brazzaville, this phenomenon is made worse. In 2019, flooding affected several districts and caused socio-economic damage, mainly on urban infrastructure. More than 40% of the city's surface was under water, and the population was vulnerable to flooding.
Table 1 summarizes the situation in Brazzaville during the 2019 floods:
Table 1. Flood situation in Brazzaville
|
Primary Causes |
Heavy Rainfall |
|
Scale of flooding (1 -3) (Scale: 1 – Low; 2 – Medium; 3 – High) |
3 (High) |
|
Area affected (km2) |
105,56 |
|
Duration (days) |
10 |
|
People affected |
50 000 |
|
Damage to infrastructure |
3 (High) |
|
Registered deaths |
4 |
3.2 Socio-economic indicators
As part of the data gathering process, 382 persons were questioned; 175 women (45.81%) and 207 men (54.18%). In the selected communes, respondents' levels of education varied: 29% had a university degree, 46% had a secondary school diploma, 9% just finished basic school, and 16% had no formal education. The majority of respondents were in the unorganized sector (26.9%), commerce (12.7%), unemployed (2.5%), and agricultural workers (4.9%). Students were 9.5% of respondents, while civil servants were up to 43.5%. With 55.4% of respondents having an income less than 200,000 CFA francs and 44.6% having a minimum income of 200,000 CFA francs per month. Most of the respondents have ordinary earnings.
The socio-economic survey showed that the population has a secondary level of education, which could make it easier for local authorities to disseminate messages across when carrying out urban resilience activities to reduce population's vulnerability to flooding.
Table 2 shows the age groups of people surveyed during data collection. These age groups are subdivided into five (5) sections and range from 18 to 65 years of age. The second column gives the exact number of people surveyed by age group during data collection. Finally, the third column gives the percentages of the number of people surveyed by age group. The lowest percentage was 7.59%, or 29 respondents, corresponding to the 18 to 25 age group. The 46 to 55 age group was the most surveyed, with 136 respondents, giving a total of 35.60%.
Table 2. Age distribution
|
Age Group (years) |
Number |
Percentage (%) |
|
18 - 25 |
29 |
7.59 |
|
26 - 35 |
56 |
14.65 |
|
36 - 45 |
102 |
26.70 |
|
46 - 55 |
136 |
35.60 |
|
56 - 65 |
59 |
15.44 |
3.3 Exposure indicators
3.3.1 Location of homes in relation to watercourses
The results of the field survey show that the proximity of homes to a watercourse or the Congo River did not directly contribute to the vulnerability of homes and infrastructure during the 2019 floods. Rather, it was the inadequacy of structures to retain and evacuate run-off water that increased the risk of flooding and damage and losses. The survey further reveals that 69% of people live more than 1.5 kilometres from rivers that cross the city, the Congo River and other water points. However, 10.32% of people live less than 500 metres from a river or lagoon, while 20.68% live between 500 m and 1.5 km away. It is considered that the expansion of flood risk across the city is partly caused by cascading effects of the sewerage network across the area.
3.3.2 Damage and loss
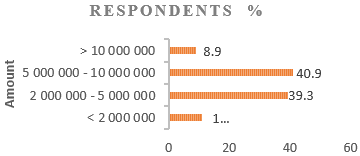
There are many factors contributing to the general housing insecure situation: insufficient decentralization of urban technical services, high building material costs, limited availability of mortgages due to high costs and resource scarcity, inadequate drainage and sewerage infrastructures, etc. Failure to adhere to building standards and the bank's required guarantees also constitutes another factor. The losses and damages incurred by the respondents to the surveys are displayed in Figure 4.
Figure 4. Losses incurred by respondents in Fcfa
Bearing in mind the state of the national economy and the income figure of the population, it came out that the losses and damage experienced by those surveyed as a result of the floods were extremely significant. This shows the magnitude and depth of the disaster.
3.3.3 Water levels and duration of flooding
Water levels following a flood can have a major impact on buildings, especially if they exceed normal or emergency levels. The framework of your home can be damaged and your floors and walls flooded. A day's prolonged immersion is more than enough to cause health problems due to the intrusion of dirty water, contamination of water and even oil leaks from tanks. The flow rate is determined by the slope of the bed and its roughness. Its speed can reach several metres per second. The real dangers depend on the fusion of flow velocity and water level.
It is acknowledged that current velocities over 0.50 m/s are risky, as people may be swept into the watercourse or hurt by items transported at fast speeds. Due to the water's height in their localities, some respondents were at risk. Indeed, 81.3% of respondents estimated that the depth of the water was one metre above ground, and 18.7% estimated that it was less than one metre (between 0.5 and 0.8).
To the question of how long it would take to recover from the effects of the floods, 31.9% of respondents estimated at least two months. In contrast, 40.2% said they had been out of the flood situation for a month or four weeks (1 month), and 27.9% said the flood situation had been gone after a fortnight (15 days).
The geographical position of the houses and the inadequacy or absence of rainwater drainage systems in certain areas have increased the population's exposure to the risk of flooding. This exposure has amplified losses and damage. Some houses that were less exposed and located farther from watercourses have succumbed to flooding due to the height of the water.
3.4 Sensitivity indicators
3.4.1 Length of stay in the city
Twenty years prior the disaster, 31.7% of the respondents were living in the area. 29.8% of respondents indicated they had been a resident for ten years. Out of this percentage, 22.9% moved there five years ago, and 15.6% had been residing there for one to four years. Only 31.7% of the people have been there for at least 20 years; hence, the lessons learned from these previous occurrences may still be relevant today.
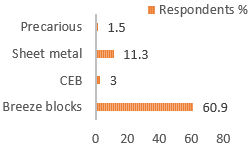
Data processing shows that 60.9% of the housing stock in the study area is made up of breeze block, 26.3% of compressed earth bricks, 11.3% of sheet metal and 1.5% of precarious materials (Figure 5).
Figure 5. Types of building materials
3.4.2 Past experience of flooding
This study argues that empirical feedback can help to meet this challenge by collecting data in the field and reconstructing the unfolding of situations and events in spatio-temporal dimensions to better understand and draw conclusions on essential and inescapable issues. Education. This point of view was also highlighted my researchers many years ago [23-28]. It is meant to function as a foundation for global risk and disaster management planning, and it can include several response components [29]. It deepens our comprehension of crisis and risk management strategies and occurrences [28]
Out of the total number of people where the survey was administered, the majority said having already experienced urban flooding in the past (71.5%). Yet, they reckon having never experienced a flooding of such magnitude. It also came out that 69.2% of respondents who experienced flooding in the past were aged between 35 and 55 years old and lived in the flooded areas for 20 years. To the other side, 42.5% of respondents who never experienced flooding in the past lived in the affected area less than 10 years.
3.4.3 Risk awareness
The following factors were identified as early warnings: low-lying areas' knowledge (1.2%), the occupation of major and minor river beds (2%), intensified rainfall in previous years (0.1%), the poor quality and inadequacy of stormwater drainage systems (14.3%), and the obstruction of drainage works. However, 72.2% of respondents claimed they were unaware of the local flooding risk. 6.1% of those surveyed chose not to respond to the query.
3.4.4 Causes and perception of flooding
The process by which people or groups identify, measure, and weigh the possible hazards connected to a given circumstance, course of action, or choice is known as risk perception. It involves the subjective judgment and interpretation of the likelihood and severity of potential negative outcomes or harm. Risk perception is influenced by a variety of factors, including psychological, social, cultural, and personal factors. According to study by Bubeck et al. [30], risk perception is the evaluation of the possibility of danger and the likelihood of outcomes, usually unfavorable ones, as seen by a community or society. According to study by Kellens et al. [31], the research of flood risk perception looks at people's awareness, feelings, and actions when they are faced with danger. It is a crucial aspect of vulnerability, and many studies demonstrated that flood preparedness has a major impact on how risk is perceived [32].
Out of those surveyed, 42.5% who had previously experienced floods perceived the hazards, whereas 71.5% of those who had never experienced flooding did not perceive any concerns. Just 10% out of the 20.68% of respondents who live between 0 and 900 metres from lagoons thought there was a chance of flooding. People's perception of the risks has not significantly increased despite being close to the lagoons. Exponential vulnerability is the outcome. Because, exponential typically refers to a mathematical concept where a quantity grows at an increasing rate proportional to its current value. Generally, vulnerability refers to the degree to which something is susceptible to harm or damage. Combining these concepts, 'exponential vulnerability' could suggest a situation where the level of vulnerability or risk is increasing rapidly or at an accelerating rate. Thus, in the context of flooding, vulnerabilities can worsen or increase over time when the risk of the environment is not perceived.
In terms of risk perception, the survey revealed the results in Table 3.
The lack of experience and knowledge of flooding has significantly increased the vulnerability of communities, because during events, they had no reflexes of the basic measures to take to minimize losses. It should also be pointed out that a lack of awareness of the risk of flooding in the area prevented communities from developing preventive measures against the risk of flooding. The inadequacy of the sanitation system also increased people's vulnerability to flooding.
Table 3. Risk perception
|
Respondents' Answer |
Percentage (%) |
|
Climate change |
28.2 |
|
River overflows |
10.5 |
|
Inadequate sewage network |
23.8 |
|
Occupation of major and minor river beds |
7.5 |
|
Poor city planning |
13.5 |
|
Poor waste management system |
7.6 |
|
Natural |
8.9 |
3.5 Recovery indicators
3.5.1 Response and adaptation measures
The first strategy to address flooding emergencies involve providing material, nutritional and medical assistance. Additionally, shelters and care facilities have to be put in place for the homeless until the waters subside. Due to a lack of internal organization, local administrations frequently did not participate in flood management. As a result, the negative effects of floods in the city were somewhat mitigated by the locals' capacity to manage the risks. Residents have coped with the floods by utilizing their knowledge. Just over 56% of respondents acknowledged the digging of culverts to facilitate precipitation drainage. Many victims of the flood received relief from the government, mainly in the form of temporary and emergency housing as well as emergency medical supplies (food, clothing, and medications). 79 % of those who received the government assistance had low incomes.
3.5.2 Risk reduction measures
We asked people affected by the floods if they had made any personal choices or taken any personal action to reduce the risk of flooding in their locality or on their plots of land. Table 4 reflects the results of the surveys.
Table 4. Measures taken by the public
|
The Measures Taken |
Percentage (%) |
|
Permanently leaving vulnerable areas |
43.5 |
|
Away from the river |
9.2 |
|
Leaving the area during the rainy season |
13.6 |
|
Better informed |
12.3 |
|
Cleaning of wastewater treatment works |
11.8 |
|
Preparing for future forecasts |
9.6 |
The majority of respondents (97%) were of the opinion that government is to blame for the vulnerability of municipalities to flooding because it is responsible for flood management. According to them, when it comes to urban flood resilience issues in particular, they are not at the forefront of sustainable urban development strategies.
Measures to reduce the vulnerability of the population have not been sufficient to improve their situation. Government assistance was also seen as insignificant by victims because they wanted a more comprehensive approach. It is important to emphasize the lack of control of urban sprawl, the destruction of plant cover and the lack of drainage facilities for rainwater can increase the vulnerability of communities.
The large number of indicators is justified by the design method adopted, which aims to respect the various approaches to the concept of vulnerability to urban flooding. The basis for this work is a local study with a shared vision of vulnerability. It should be noted that the competition between indicators, since it is important to select a limited number, reveals the objective dynamics underlying societies nowadays [1]. The approach used in this analysis, with several indicators in particular socio-economic exposure, sensitivity and adaptability, allowed us to have a system vision on the awareness of populations and the causes of vulnerabilities to the 2019 floods in Brazzaville.
Clarity about the vulnerability of individuals and communities is crucial to successful flood management, because modifying the vulnerability of exposed populations is likely to reduce the effects of dangerous disasters [32, 33]. Consequently, the danger and risk of flooding are entirely human concerns. This means that it is essential to analyze risk as consisting of the nature of the hazard and its probability, exposure, expected damage, expected fatalities, etc. [34]. Our analysis highlighted the existence of a risk as victims were not duly informed and aware of the possible danger of the zone. Consequently, they naturally occupied the vacant zones.
Urban flooding in Brazzaville is the result of a complex mix of factors, including the lack of control over urban sprawl, inadequate hydraulic structures (in this case the sewerage and rainwater drainage network), poor waste management and climate change. Brazzaville experienced exceptionally wet rainy seasons in 2019. The intense rains caused significant material damage and deaths. The degree of severity of the flooding was divergent from one place to another. The government and its partners acted swiftly. The 2019 urban flood completely reflected the vulnerability of the population due to their socio-economic characteristics, their exposure to risk, their sensitivities and their ability to recover once affected by the floods. Flood victims' perception of risk is highly dependent on the institutions that serve them and regulate urban management [35].
Many authors attribute the increasing responsibility of human activities as a major factor in the causes of flooding. According to Hewitt’s study [36], the increase in flooding in Yaoundé is not solely due to urban growth, but above all to shortcomings in urban development planning. In the same vein, study by Fogwe and Lambi [37] show that this phenomenon is accentuated by the progression of poorly controlled urbanization and by the inadequacy of sewerage networks, which no longer allow water to be managed and evacuated. Based on this observation, floods should no longer be considered as natural risks in the city, but rather as risks inherent in the growth of the city [38]. The very fact that a disaster strikes and causes damage should be interpreted as one of the manifestations of poorly managed development [39]. In the case of Brazzaville, responsibilities seem to be shared between public actors and populations. The lack of control over urban sprawl, the shortage and non-existence of sanitation infrastructure and weaknesses in the practice of urban management increase the risk of flooding. The destruction of vegetation cover, the occupation of major and minor river beds contributes to the exponential crossover of vulnerability to flooding.
Anthropogenic vulnerability indicators refer to all the actions taken by humans that increase their exposure to flooding. Population growth, often coupled with a massive rural exodus that is still active in some developing countries, has contributed to the increasing urbanization of sites at risk [40]. Study [41] shows that recurrent flooding in several Central African cities is the result of a number of factors, but mainly due to human behaviour, particularly exposure and sustained sensitivity, associated with the settlement of populations in flood-prone areas. Recent studies show that more and more towns in Central Africa are facing flooding problems as a result of environmental degradation [42, 43]. Adding the poor ability to adapt to flood risks as is the case in Brazzaville or the lack of combined sensitivity to exposure and sensitivity has caused several losses and damages
This research completes the existing literature in the sense that the analysis of vulnerability to flooding cannot focus exclusively on socio-economic indicators or on loss and damage, but it must be systematic in order to better understand the problem in its complexity and comprehensiveness. It also helps to understand the link between urban management, communication and risk management.
The capital of Congo has been for long facing flooding issues, and this is well-known. As population is increasing in major areas, there is a need for urban space for housing.
Surfaces are no longer permeable to water due to urban growth, structures impede natural drainage systems, and heavy rainfall during the rainy seasons puts people at risk of flooding. The primary vulnerabilities of communities and their populations have been identified through the examination of vulnerability to floods based on socio-economic indicators, exposure and sensitivity indicators, and adaptation methods. These adjustments are necessary to achieve sustainable urban growth. This vulnerability is explained by a lack of awareness of the risks of flooding, occupation of major and minor river beds, not to mention the insufficient and non-existence of stormwater drainage infrastructure in some areas. Beyond the systemic approach to flood vulnerability analysis that this research brings, it also contributes to the understanding of tryptic awareness, urban management and risk. It recommends better participation of populations and national authorities in urban risk management practices to ensure resilient and sustainable cities.
The author is deeply grateful to the World Bank for funding this research through CERViDA (Regional Centre for Sustainable Cities in Africa) and to the Association of Universities of Africa. Funding number IDA 5360 TG.
[1] Barroca, B., Pottier, N., Lefort, E. (2005). Analyse et évaluation de la vulnérabilité aux inondations du bassin de l’Orge aval. Septièmes Rencontres de Théo Quant, 12.
[2] Hubert, G., Ledoux, B. (2015). Le coût du risque L'évaluation des impacts socio-économiques des inondations. Presses de l'Ecole Nationale des Ponts et Chaussées, 240.
[3] Gleyze, J.F. (2002). Introduction au risque. Rapport interne de l ‘Institut de Géograpgie National, Laboratoire Cogit. http://recherche.ign.fr/labos/cogit/pdf/RAPPORTS/Gleyze_rapport_risque.pdf, accessed on Jan. 23, 2024.
[4] Leneveu, J., Mary Laville, M. (2012). La perception et l’évaluation des risques d’un point de vue psychologique: Note de recherche. VertigO, 12(1).
[5] d'Ercole, R., Thouret, J.C., Dollfus, O., Asté, J.P. (1994). Les vulnérabilités des sociétés et des espaces urbanisés: Concepts, typologie, modes d'analyse. Revue de Géographie Alpine/Journal of Alpine Research, 82(4): 87-96.
[6] Ledoux, B. (2006). La Gestion Du Risque Inondation. Éditions Tec & Doc.
[7] Meschinet de Richemond, N., Reghezza, M. (2010). La gestion du risque en France: Contre ou avec le territoire? Annales de Géographie, 3: 248-267. https://doi.org/10.3917/ag.673.0248
[8] Messner, F., Meyer, V. (2006). Flood damage, vulnerability and risk perception–challenges for flood damage research. Flood Risk Management: Hazards, Vulnerability and Mitigation Measures, 149-167.
[9] Reghezza, M. (2006). Réflexions autour de la vulnérabilité métropolitaine: La metropole Parisienne face au risque de crue centennale. Géographie. Université de Nanterre.
[10] Turner, M.G., Romme, W.H., Tinker, D.B. (2003). Surprises and lessons from the 1988 Yellowstone fires. Frontiers in Ecology and the Environment, 1(7): 351-358. https://doi.org/10.1890/1540-9295(2003)001[0351:SALFTY]2.0.CO;2
[11] Brooks, N. (2003). Vulnerability, risk and adaptation: A conceptual framework. Tyndall Centre for Climate Change Research Working Paper, 38(38): 1-16.
[12] Louembe, D. (1986) Problème de drainage des eaux pluviales sur le site de Brazzaville, ORSTOM, AGECO. Mission francaise de coopération et action culturelle. Congo, Brazzaville.
[13] Deressa, T., Hassan, R.M., Ringler, C. (2008). Measuring Ethiopian Farmers’ Vulnerability to Climate Change across Regional States. IFPRI Discussion Paper, Washington.
[14] Liverman, D.M. (1990). Vulnerability to global environmental change. In: Kasperson, R.E., et al., Understanding Global Environmental Change, pp. 27-44. Center for Technology, Environment, and Development, Clark University, Worcester.
[15] Hewitt, K. (1995). Excluded perspectives in the social construction of disaster. International Journal of Mass Emergencies & Disasters, 13(3): 317-339. https://doi.org/10.1177/028072709501300307
[16] Füssel, H.M., Klein, R.J.T. (2006). Climate change vulnerability assessments: An evolution of conceptual thinking. Climatic Change, 75: 301-329. https://doi.org/10.1007/s10584-006-0329-3
[17] Institut National de la Statistique - INS Congo. https://rcongo.opendataforafrica.org/data#source=Institut+National+de+la+Statistique+-+INS+Congo, accessed on Feb. 22, 2024.
[18] Vanel, A.R., Innocent, E.J., Coffi, A.C. (2023). Analysis of cascading effects on key urban networks during flooding in Brazzaville, Congo. International Journal of Sustainable Development and Planning, 18(11): 3467-3475. https://doi.org/10.18280/ijsdp.181112
[19] Sachs-Jeantet, C. (1995). Managing social transformations in cities: A challenge to social sciences. MOST Discussion Paper Series.
[20] Kevin, N.H., Feng, L.J. (2014). La gestion de l'environnement urbain a brazzaville: Problemes et perspectives. European Scientific Journal, 10(29).
[21] Mambou, J.R., Elenga, H. (2023). Erosions, inondations et mauvais drainage des eaux pluviales à Brazzaville: Quelles solutions dans le cadre d’un réaménagement durable de la ville à l’horizon 2030? European Scientific Journal, 19(20). https://doi.org/10.19044/esj.2023.v19n20p205
[22] Ferras, R., Volle, J.P. (1991). Environnement et recherche urbaine. REED Stretie Info, febrero. Ministère de l'Environnement, París.
[23] Kifouala, M.M. (2019). Vulnérabilité du site urbain de Brazzaville (République du Congo) face à la menace climatique et à la pression démographique. Afrique Science, 15(6): 206-217.
[24] Moatty, A., Gaillard, J., Vinet, F. (2017). Du désastre au développement : Les enjeux de la reconstruction post-catastrophe. Annales de géographie, 714: 169-194. https://doi.org/10.3917/ag.714.0169
[25] Crozier, D., Jouannic, G., Tran Duc Minh, C., Kolli, Z., Matagne, E., Arbizzi, S. (2016). Reconstruire un territoire moins vulnérable après une inondation. Une fenêtre d’opportunité encore difficilement mobilisable. Espace populations sociétés. Space Populations Societies. https://doi.org/10.4000/eps.7033
[26] Pottier, A. (2016). Comment l’environnement transforme-t-il la discipline économique? Annales des Mines - Responsabilité et Environnement, 83: 45-49. https://doi.org/10.3917/re1.083.0045
[27] Moatty, A., Gaillard, J.C., Vinet, F. (2017). Du désastre au développement: Les enjeux de la reconstruction post-catastrophe. Annales de Géographie, 714: 169-194.
[28] Rey, T., Le De, L., Leone, F., Gilbert, D. (2017). An integrative approach to understand vulnerability and resilience post-disaster: The 2015 cyclone Pam in urban Vanuatu as case study. Disaster Prevention and Management: An International Journal, 26(3): 259-275. https://doi.org/10.1108/DPM-07-2016-0137
[29] Koumassi, D. (2019). Caracterisation spatiale du risque d’inondation dans le bassin versant de la volta au benin. Le Changement Climatique, la variabilité et les risques climatiques, 211.
[30] Bubeck, P., Botzen, W.J.W., Aerts, J.C. (2012). A review of risk perceptions and other factors that influence flood mitigation behavior. Risk Analysis: An International Journal, 32(9): 1481-1495. https://doi.org/10.1111/j.1539-6924.2011.01783.x
[31] Kellens, W., Zaalberg, R., Neutens, T., Vanneuville, W., De Maeyer, P. (2011). An analysis of the public perception of flood risk on the Belgian coast. Risk Analysis: An International Journal, 31(7): 1055-1068. https://doi.org/10.1111/j.1539-6924.2010.01571.x
[32] Miceli, R., Sotgiu, I., Settanni, M. (2008). Disaster preparedness and perception of flood risk: A study in an alpine valley in Italy. Journal of Environmental Psychology, 28(2): 164-173. https://doi.org/10.1016/j.jenvp.2007.10.006
[33] Bankoff, G. (2001). Rendering the world unsafe: ‘vulnerability’as western discourse. Disasters, 25(1): 19-35. https://doi.org/10.1111/1467-7717.00159
[34] Hewitt, K. (1983). Interpretations of Calamity: From the Viewpoint of Human Ecology. Allen and Unwin, London.
[35] Klijn, F., Samuels, P., Van Os, A. (2008). Towards flood risk management in the EU: State of affairs with examples from various European countries. International Journal of River Basin Management, 6(4): 307-321. https://doi.org/10.1080/15715124.2008.9635358
[36] Hewitt, K. (1995). Excluded perspectives in the social construction of disaster. International Journal of Mass Emergencies & Disasters, 13(3): 317-339. https://doi.org/10.1177/028072709501300307
[37] Fogwe, Z.N., Lambi, C.M. (2001). Combating inundation in some major Cameroonian cities: An appraisal of indigenous strategies. Environmental Issues: Problems and Prospects. University of Buea, Unique Printers, Bamenda.
[38] La prévention des risques liés aux inondations au Cameroun. https://fpae-cameroun.org/wp-content/uploads/2015/11/ENJEUX-16.pdf, accessed on Feb. 23, 2024.
[39] Tesso, G., Emana, B., Ketema, M. (2012). Analysis of vulnerability and resilience to climate change induced shocks in North Shewa, Ethiopia. Agricultural Sciences, 3(6): 871-888. https://doi.org/10.4236/as.2012.36
[40] Mbadinga, I., Indjieley, M., Maloba, M. (2019). Quelques indicateurs de vulnerabilite aux inondations dans le bassin-versant de l’ogooué à lambaréné. Le Changement Climatique, la variabilité et les risques climatiques, 217-222.
[41] Rapport Annuel 2010. https://unhabitat.org/rapport-annuel-2010, accessed on Feb. 23, 2024.
[42] Vandecasteele, I., Makanzu, F., Ntombi, A., Ozer, P., Moeyersons, J., Trefois, P. (2011). The increasing threat of natural hazards in Central Africa: The case of urban megagullies. In YES Africa Symposium/23rd Colloquium for African Geology.
[43] Vandecasteele, I., Moeyersons, J., Trefois, P. (2010). An assessment of the spatial and temporal distribution of natural hazards in Central Africa. African Palaeoenvironments and Geomorphic Landscape Evolution, 30: 279-300.