Sensory Analysis of Butterfly Pea (Clitoria ternatea L.) Flower Tea Drink Using Central Composite Design

Juanda*![]() | Sri Hartuti
| Sri Hartuti![]()
© 2024 The authors. This article is published by IIETA and is licensed under the CC BY 4.0 license (http://creativecommons.org/licenses/by/4.0/).
OPEN ACCESS
Butterfly pea (Clitoria ternatea L.) flower tea is a functional drink that is helpful in improving nutrition and health. The level of preference for the tea drink needs to be studied; thus, the accurate product formula can be obtained in its postharvest handling and processing. This research aimed to optimize the microwave-dried pea flower tea drink using the central composite design (CCD) method. The treatment factors studied were microwave power and drying time, with the treatment response as a sensory test of butterfly pea flower tea, including colour, aroma, taste, and aftertaste. The results of CCD analysis show that microwave power and drying time significantly affect the colour, aroma, and taste of butterfly pea tea but have no significant effect on the aftertaste. The optimum sensory formula was obtained at microwave power (X1) of 180 watts and drying time (X2) of 17 minutes, with a prediction of colour of 5.8 ≈ 6 (likes), aroma of 5.1 ≈ 5 (somewhat like), taste of 5 .03 ≈ 5 (somewhat like) and aftertaste of 4.05 ≈ 4 (neutral).
clitoria, ternatea, sensory, colour, aroma, taste, aftertaste, CCD
Butterfly pea flower (Clitoria ternatea L.) contains numerous antioxidants and bioactive compounds that function to reduce stress, antiproliferative, and anti-inflammatory activities [1-4]. The flower is used in functional drinks, such as ready-to-serve drinks, syrups, and powders [5].
Tea is a popular functional beverage in the community [6, 7]. Tea has health benefits [8, 9] as it has various active components of high antioxidant and mineral contents [5]. Serving this drink is relatively straightforward: boiling or brewing [5]. Tea processing generally involves the process of oxidizing ingredients and molecules, stopping oxidation, and forming tea through a drying process [4].
Drying is essential for food processing and storage [10]. Drying is one of the processes that affect the tea produced [11, 12], starting in terms of colour, aroma, taste, and active compounds contained in the tea [10, 11]. Optimal drying conditions are essential for quality maintenance during food processing [11]. Drying is one of the stages of post-harvest handling, as it helps prevent the breakdown of enzymes and the growth of microorganisms while preserving the essential characteristics of plant products [13]. Drying also aims to remove moisture content up to 95-97% to maximize shelf life [14]. Drying using microwave ovens has very successful applications in food processing, especially in maintaining the quality of foodstuffs [15-17]. Even the usage of microwaves is considered to minimize energy consumption [17, 18].
The consumer's acceptance of the butterfly pea flower tea drink can be determined through sensory tests. Sensory tests are useful and help improve the quality of final products [19]. The sensory analysis is a test that uses the five senses (sight, smell, taste, touch, and hearing) of panellists to examine the characteristics of food (texture, taste, taste, appearance, smell, etc.) [20, 21].
Based on the background, it is necessary to determine the optimum condition of the parameters that affect the sensory parameters of butterfly pea flower tea drink dried using a microwave. One of the optimization methods that can be used to determine the quality of food products is the central composite design (CCD) method [6, 22-27]. Therefore, sensory optimization of butterfly pea flower tea drinks using CCD should be done to determine the optimal condition of the microwave power and drying time treatment factors.
2.1 Research tools and materials
The equipment utilized comprised a 20L Samsung ME731K microwave, a desiccator, a watch glass, an analytical balance, a pot, a heater, a tray, a measuring cup, heat-resistant gloves, a camera, and several sensory tools (stationery, questionnaires, and code paper). In addition, butterfly pea blossoms, distilled water, crackers, and tissues were utilized.
2.2 Research procedure
The steps in this research were divided into several stages, including sample preparation, drying, production of butterfly pea flower tea drinks, sensory tests, and data analysis using the CCD method. The sensory analysis of flower tea drinks with CCD was conducted using MINITAB 19 software.
The harvested butterfly pea flowers were then sorted, washed, and drained. The flowers that had been sorted and cleaned were placed on the shelf and left to wither for 4 hours at room temperature. Furthermore, the flowers are dried using a microwave with various microwave power of 100, 180, and 300 watts, with various times of 7, 12, and 17 minutes, according to the prescribed treatment. Each treatment used a sample of 10g of butterfly pea flowers.
Furthermore, 1 gram of dried butterfly pea flowers was brewed using 250 ml of boiling water (100℃) for 7 minutes, then filtered and prepared as a sample for sensory test. The sensory test method used is the hedonic test, which is a sensory analysis test method that can determine the level of preference [21] and differences in the quality of a product [28]. The sensory test of the flower tea drinks was carried out sensorily to determine the level of liking and difference in the quality of tea drinks obtained based on differences in microwave power treatment and drying time determined based on a numerical scale of colour, aroma, taste, and aftertaste characteristics. The scales used (in numeric) were very like (7), like (6), somewhat like (5), neutral (4), somewhat dislike (3), dislike (2), and strongly dislike (1) [6, 29].
Table 1. Levels of variation of treatment factors
|
Variable (X) |
Levels |
||
|
Low |
Medium |
High |
|
|
Microwave power, X1 (watt) |
100 |
180 |
300 |
|
Drying time, X2 (minutes) |
7 |
12 |
17 |
This research used an experimental design of the response surface method with a two-factor CCD design. The aim is to determine the optimal conditions of the effect of microwave power treatment and drying time on the sensory quality of the butterfly pea flower tea produced. The levels of variation of treatment factors and treatment codes are shown in Table 1. The optimum conditions of the treatment response were obtained based on mathematical equations with second-order polynomial models that are generally formed, as shown in Eq. (1) [6, 22].
$Y=\beta_0+\beta_1 X_1+\beta_2 X_2+\beta_{11} X_1^2+\beta_{22} X_2^2+\beta_{12} X_1 X_2$ (1)
where, Y is the value of the treatment response (colour, aroma, taste, and aftertaste), βo is the intercept/constant, β1 and β2 are the linear coefficients, β11 and β22 are the quadratic coefficients, β12 is the treatment interaction coefficient. X1 represents microwave power, and X2 represents drying time.
The research results are optimum sensory quality characteristics of the butterfly pea flower tea drinks assessed based on colour, aroma, taste, and aftertaste. Sensory properties function as an assessment of food ingredients to determine whether a product is accepted [19]. An indicator in determining whether a product is acceptable is the sensation received, including colour, aroma, taste, and aftertaste [20, 23, 30]. The results of sensory analyses performed by panellists for the 13 treatment combinations performed are presented in Table 2.
Table 2. Response value of treatment based on central composite design (CCD)
|
Treatment |
Factor Limits and Levels Treatment (X) |
Treatment Response (Y) |
||||
|
X1 |
X2 |
Y1 |
Y2 |
Y3 |
Y4 |
|
|
1 |
180 |
12 |
5 |
4 |
4 |
4 |
|
2 |
180 |
12 |
4 |
4 |
4 |
4 |
|
3 |
300 |
12 |
5 |
3 |
3 |
4 |
|
4 |
180 |
12 |
5 |
4 |
4 |
4 |
|
5 |
300 |
17 |
5 |
4 |
3 |
4 |
|
6 |
300 |
7 |
5 |
4 |
4 |
5 |
|
7 |
100 |
12 |
4 |
4 |
4 |
5 |
|
8 |
180 |
12 |
5 |
5 |
5 |
5 |
|
9 |
180 |
12 |
5 |
4 |
5 |
4 |
|
10 |
100 |
7 |
3 |
4 |
4 |
5 |
|
11 |
180 |
7 |
5 |
5 |
5 |
6 |
|
12 |
180 |
17 |
6 |
5 |
5 |
4 |
|
13 |
100 |
17 |
5 |
5 |
5 |
4 |
Note: X1 = microwave power (watt), X2 = drying time (minutes), Y1 = colour, Y2 = aroma, Y3 = taste, Y4 = aftertaste, treatment response score (very like (7), like (6), somewhat like (5), neutral (4), somewhat dislike (3), dislike (2), and strongly dislike (1)).
Sensory analysis is helpful in new product development [19, 20] including butterfly pea flower tea drinks. The CCD method was used to determine the effect of microwave drying treatment factors on sensory characteristics assessed based on the panellists' preference for butterfly pea flower tea drinks. The regression equation, significance, lack of fit, and R2 value of the CCD method analysis results for each response are shown in Table 3.
3.1 Colour
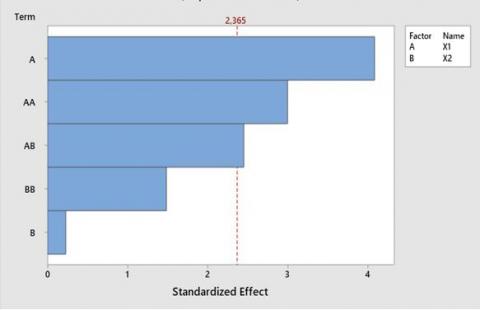
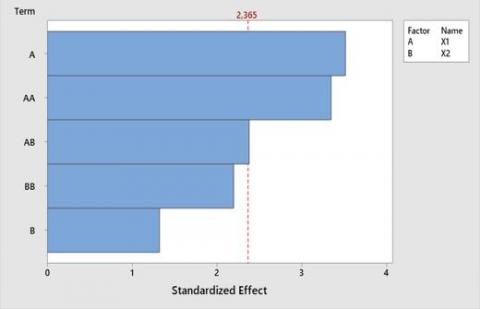
Colour is an essential factor in determining a food product's quality and level of acceptance [6], including butterfly pea flower tea. Table 3 indicates that the significance value (p < 0.05) is 0.016, which means that factors X1 and X1 significantly affect the colour of butterfly pea flower tea. The p-value from the lack of fit test is 0.656, which is more than the α=5% percentile. This indicates that there is no lack of fit, meaning that the data is in line with the projected model. The model's final R2 value for the colour parameter is 0.818. This indicates that the butterfly pea flower tea's colour is influenced by the treatment parameters X1 and X2 by 81.8%.
The Pareto diagram illustrates the absolute magnitude of the standard effect, the highest to lowest effect [31, 32]. The Pareto diagram in Figure 1 was used to investigate whether the treatment factor had a positive or negative effect on the colour of the tea drink. The Pareto diagram shows that the microwave power factor (X1) has the most effect on the panellists' preference for the colour of the flower tea drink. In contrast, the drying time (X2) has a minor effect on the panellists' preference for the colour of the flower tea drink.
Table 3. Analysis of CCD models for sensory characteristics of butterfly pea flower tea
|
Response |
Regression Equation (Uncoded Units) |
Significance (p<0.05) |
Lack of Fit (p<0.05) |
R² |
|
Colour (Y1) |
Y1 = - 0,45 + 0,0476 X1 - 0,057 X2 - 0,000077 X12 + 0,01448 X22 - 0,000987 X1*X2 (2) |
0.016 |
0.656 |
0,818 |
|
Aroma (Y2) |
Y2 = 5,10 + 0,0296 X1 - 0,622 X2 - 0,000068 X12 + 0,03103 X22 - 0,000461 X1*X2 (3) |
0.035 |
0.799 |
0.767 |
|
Taste (Y3) |
Y3 = 2,70 + 0,0422 X1 - 0,339 X2 - 0,000088 X12 + 0,0221 X22 - 0,000987 X1*X2 (4) |
0.019 |
0.995 |
0,668 |
|
Aftertaste (Y4) |
Y4 = 8,53 - 0,0003 X1 - 0,543 X2 - 0,000006 X12 + 0,0166 X22 + 0,000066 X1*X2 (5) |
0.137 |
0.280 |
0,636 |
Note: X1 = microwave power (watt), X2 = drying time (minutes).
Figure 1. Pareto chart of standardized effects for the CCD model for the colour of butterfly pea flower tea drink (Y1)
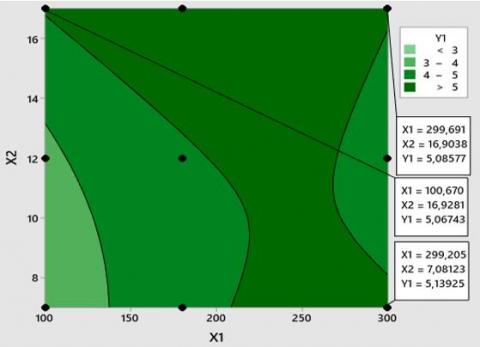
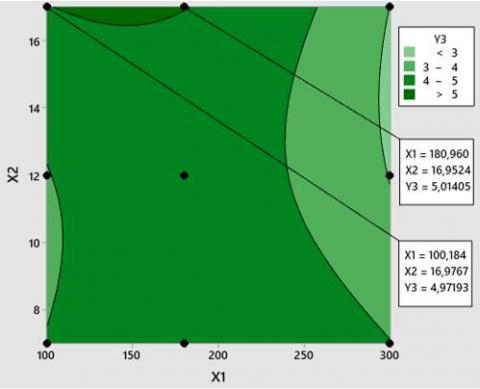
The pattern of consumer acceptance of the butterfly pea flower tea drink colour is shown in Figure 2, where the highest value of the tea drink colour is 5 (somewhat like), and the lowest colour value is 3 (somewhat dislike). The results indicate that panellists prefer the bright blue butterfly pea flower tea drink. The tea's colour will affect the product's appearance as the product's overall appearance is important to attract consumers and develop expectations before consumption [19].
Figure 2. Contour plot of the relationship of the colour of butterfly pea flower tea (Y1) to variations in microwave power (X1) and drying time (X2)
3.2 Aroma
Aroma is one of the most essential sensory factors used to assess a food product's acceptability. Customers can determine the contents of a product and its suitability for eating by smelling it. The human nose's sense of smell can be used to assess a food product's deliciousness based on its scent [33].
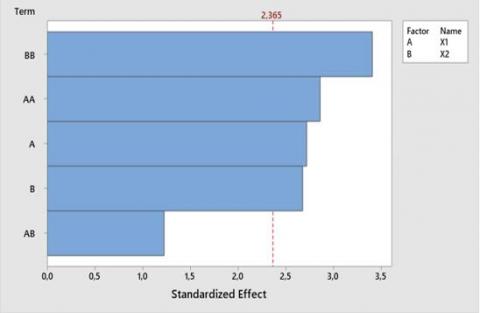
Table 3 shows the results of CCD analysis of the aroma of the butterfly pea flower tea, where the model significance obtained is 0.035, smaller than α = 5% (p < 0.05), which means that X₁ and X₂ factors have a significant effect on the aroma of butterfly pea flower tea. While the lack of fit value obtained by 0.799 is larger than α=5% (not significant). The R2 value of the model of the aroma characteristics of butterfly pea flower tea obtained was 0.767, which means that the treatment factors X1 and X2 only have an influence of 76.7% on the aroma of butterfly pea flower tea. Other factors still affect the aroma of butterfly pea flower tea by 23.3%. In addition to microwave power and drying time, other factors can still affect the aroma of butterfly pea flower tea, including tea steeping temperature, the number of butterfly pea flowers used, and various other things.
Figure 3. Pareto chart of standardized effects for the CCD model for the aroma of butterfly pea flower tea drink (Y2)
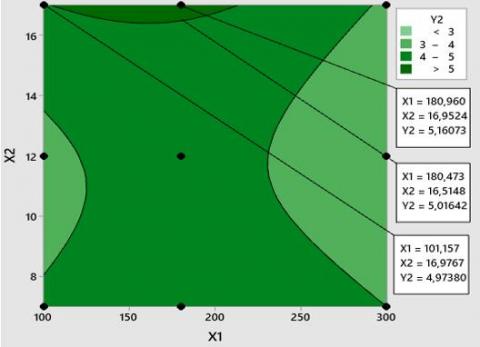
Figure 4. Contour plot of the relationship of the aroma of butterfly pea flower tea (Y2) to variations in microwave power (X1) and drying time (X2)
The Pareto diagram from the CCD model analysis for the aroma of the flower tea drink shows that the quadratic factor of drying time (X2) has the most significant influence on the panellists' preference for the aroma of the flower tea drink, as shown in Figure 3.
Visualization of contour plots of the highest level of acceptance of the aroma of butterfly pea flower tea was obtained at a score of 5 (somewhat like). In contrast, the lowest level of acceptance of the aroma of the tea was obtained at a score of 3 (somewhat dislike), as shown in Figure 4.
3.3 Taste
Taste determines the panellists' acceptance of the resulting product [6]. The results of CCD analysis of the taste of the butterfly pea flower tea (Table 3) show that the model significance is 0.019, smaller than α = 5% (p < 0.05), which means that factors X1 and X2 have a significant effect on the taste of butterfly pea flower tea. At the same time, the lack of fit value obtained is 0.995 (not significant). The R² value of the model of the taste characteristics of butterfly pea flower tea obtained was 0.668; this means that the treatment factors X1 and X2 have an influence of 66.80% on the taste of butterfly pea flower tea, and there are still other factors that affect the taste of butterfly pea flower tea by 33.20%. In addition to X1 and X2 factors, there are still other factors that can affect the taste of butterfly pea flower tea, such as the ratio of the number of butterfly pea flowers and water, brewing time as well as other additives in the butterfly pea flower tea drink, such as sugar, honey, or lemon juice.
The butterfly pea flowers have a slightly bland taste and tend to be slightly sour. A few factors, including chemical compounds, processing temperature, concentration, and other taste component interactions, often affect the product mind of a food product [33].
The results of CCD model analysis for the taste of butterfly pea flower tea drink show that the microwave power factor (X1) has the greatest influence, followed by the quadratic microwave power factor (X12) and the interaction of microwave power factor and drying time (X1X2). Furthermore, quadratic drying time (X22) and drying time (X2) has the least influence on panelists' preference for the taste of butterfly pea flower tea drink, as shown in Figure 5.
Figure 5. Pareto chart of standardized effects for the CCD model for the taste of butterfly pea flower tea drink (Y3)
Figure 6. Contour plot of the relationship of the taste of butterfly pea flower tea (Y3) to variations in microwave power (X1) and drying time (X2)
Figure 6 shows that consumer acceptance of the highest taste of butterfly pea flower tea obtained was at a score of 5 (somewhat like), and the lowest score obtained was 3 (somewhat dislike). The results show that panellists preferred the flower tea drink, which was dried at a drying time of ± 17 minutes and microwave power of 100-180 watts. Suppose the microwave power of > 180 watts causes the panellists' preference for the taste of the butterfly pea flower tea drink to decrease. In that case, the drying process of fresh butterfly pea flowers at that temperature causes some of the tips of the petals to be slightly charred. It causes the taste of the flowers to change slightly, resulting in lower consumer ratings. In addition, high microwave power causes high drying air temperatures that can affect the composition of bioactive substances in the flowers.
3.4 Aftertaste
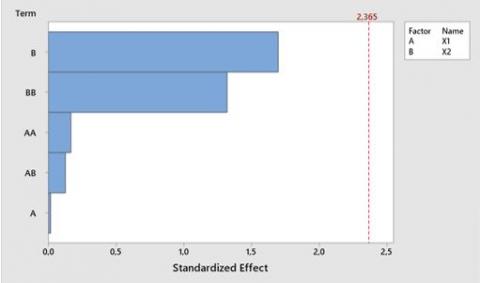
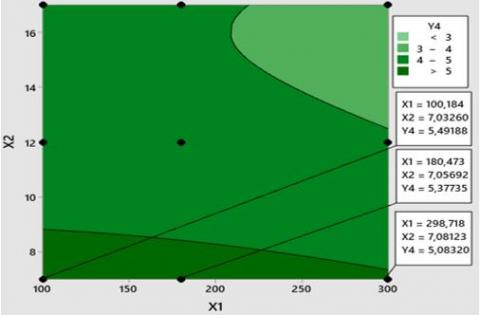
The pleasant taste and aroma that linger in the back of the mouth after the drink is swallowed or spat out is known as the aftertaste [6]. CCD analysis of the aftertaste of butterfly pea flower tea (Table 3) shows that the model significance is 0.137 and larger than α = 5% (p < 0.05), which means that factors X1 and X2 did not have a significant effect on the aftertaste of butterfly pea flower tea. While the lack of fit value obtained was 0.280, larger than α=5%, which also means it is insignificant. The flower tea aftertaste model has an R² of 0.636. This means that the treatment factor (microwave power and drying time) only has a 63.6% influence on the aftertaste of the flower tea drink. The Pareto diagram (Figure 7) shows that linear and quadratic drying time treatment factors significantly affect the aftertaste assessment of the flower beverage. In contrast, the microwave power treatment factor has a minor effect on the aftertaste value of the flower tea drink. Furthermore, from the results of the contour plot analysis (Figure 8), it was found that the highest aftertaste value obtained was 5.5 ≈ 6 (like), while the lowest aftertaste value obtained was 3 (somewhat dislike).
Figure 7. Pareto chart of standardized effects for the CCD model for the aftertaste of butterfly pea flower tea drink (Y3)
Figure 8. Contour plot of the relationship between the aftertaste of the butterfly pea flower tea drink (Y4) to the variation of microwave power (X1) and the variation of drying time (X2)
3.5 Optimization of butterfly pea flower tea sensory
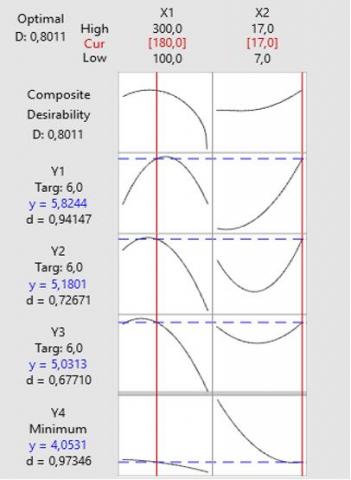
After obtaining the mathematical model for each response, the optimization was carried out. The optimization aimed to find the best composition of treatment factors X1 and X2 for sensory butterfly pea flower tea. The determination of the lower, mean, and upper values for each response is shown in Table 4, and the results of optimizing the composition of each treatment factor for the responses are shown in Table 5, with an average composite desirability value of 0.802. The detailed formula for each response and the desirability level of each response is as shown in Figure 9.
The design of sensory optimization of butterfly pea flower tea was selected on the target colour, aroma, and taste, namely 6 (likes) with a successive level of importance of 4; 4; 5, then the minimum aftertaste response is 4, with an importance level of 3, as shown in Table 4.
Furthermore, the optimal formula obtained includes a microwave power treatment factor of 180 watts, a drying time of 17 minutes, and the optimal response values of colour is 5.8 ≈ 6 (likes), aroma is 5.1 ≈ 5 (somewhat like), taste is 5.03 ≈ 5 (somewhat like), and aftertaste is 4 (neutral).
Figure 9. Optimal sensory solution of pea butterfly flower tea
Table 4. The sensory optimization design of butterfly pea flower tea using CCD
|
Response |
Goal |
Lower |
Target |
Upper |
Weight |
Importance |
|
Y1 |
Target |
3 |
6 |
6.6 |
1 |
4 |
|
Y2 |
Target |
3 |
6 |
6.6 |
1 |
4 |
|
Y3 |
Target |
3 |
6 |
6.6 |
1 |
5 |
|
Y4 |
Minimum |
|
4 |
6.0 |
1 |
3 |
Note: Y1 = colour, Y2 = aroma, Y3 = taste, Y4 = aftertaste.
Table 5. The optimum sensory formula of microwave-dried butterfly pea flower tea
|
Solution |
X1 |
X2 |
Y1 Fit |
Y2 Fit |
Y3 Fit |
Y4 Fit |
Composite Desirability |
|
1 |
180 |
17 |
5.82441 |
5.18013 |
5.03131 |
4.05309 |
0.801089 |
Note: X1 = microwave power (watt), X2 = drying time (minutes), Y1 = colour, Y2 = aroma, Y3 = taste, Y4 = aftertaste.
The results showed that the optimization data can be applied to the drying of butterfly pea flowers, where the butterfly pea flowers produced not only have good sensory quality, but also have good physical characteristics, well dried butterfly pea flowers, and can be stored for a long time. In addition to sensory quality, drying butterfly pea flowers using a microwave is also expected to be able to maintain its antioxidant content, so further research needs to be carried out to determine the physical and chemical quality of dried butterfly pea flowers produced as raw materials for healthy drinks.
The results of CCD analysis show that microwave power and drying time significantly affect the colour, aroma, and taste of butterfly pea flower tea but do not significantly affect the aftertaste of butterfly pea flower tea. The optimum sensory formula was obtained at microwave power (X1) of 180 watts and drying time (X2) of 17 minutes, with predictions of the colour of 5.8 ≈ 6 (likes), aroma of 5.1 ≈ 5 (somewhat like), taste of 5.03 ≈ 5 (somewhat like) and aftertaste of 4.05 ≈ 4 (neutral).
The authors would like to thank LPPM USK, Akbar Rizki Maulana, Sri Vivit Wahyuni, Nurul Fadillah, and all parties who have helped this research project.
[1] Goh, S.E., Kwong, P.J., Ng, C.L., Ng, W.J., Ee, K.Y. (2021). Antioxidant-rich Clitoria ternatea L. flower and its benefits in improving murine reproductive performance. Food Science and Technology, 42: e25921. https://doi.org/10.1590/fst.25921
[2] Lakshan, S.A., Jayanath, N.Y., Abeysekera, W.P., Abeysekera, W.K. (2019). A commercial potential blue pea (Clitoria ternatea L.) flower extract incorporated beverage having functional properties. Evidence-Based Complementary and Alternative Medicine, 2019: 2916914. https://doi.org/10.1155/2019/2916914
[3] Purnamayanti, A., Gondokesumo, M.E., Budipramana, K. (2022). Potential application of clitoria ternatea in cancer treatment. Pharmaceutical Sciences and Research, 9(3): 109-124.
[4] Barman, P., Kar, S. (2023). Clitoria ternatea: A low-cost noble blue tea in India. Journal of Survey in Fisheries Sciences, 10(1S):6128-38.
[5] Pamela, V.Y., Kusumasari, S., Meindrawan, B. (2021). Development of functional beverages from herbs: Aspect of nutrition, processing and safety. IOP Conference Series: Earth and Environmental Science, 715: 012067. https://doi.org/10.1088/1755-1315/715/1/012067
[6] Agustina, R., Hartuti, S. (2022). Optimization of sensory characteristics of bilimbi tea drink (Averrhoa Tea). IOP Conference Series: Earth and Environmental Science, 1116: 012066. https://doi.org/10.1088/1755-1315/1116/1/012066
[7] Nurmilah, S., Utama, G.L. (2022). A review on current trend of next generation of teas. Food Research, 6(5): 412-424. https://doi.org/10.26656/fr.2017.6(5).486
[8] Marpaung, A.M. (2020). Tinjauan manfaat bunga telang (clitoria ternatea l.) bagi kesehatan manusia. Journal of Functional Food and Nutraceutical, 63-85.
[9] Wang, C., Han, J., Pu, Y., Wang, X. (2022). Tea (Camellia sinensis): A review of nutritional composition, potential applications, and Omics Research. Applied Sciences, 12(12): 5874. https://doi.org/10.3390/app12125874
[10] Ye, S., Wang, Z., Shen, J., Shao, Q., Fang, H., Zheng, B., Younis, A. (2019). Sensory qualities, aroma components, and bioactive compounds of Anoectochilus roxburghii (Wall.) Lindl. as affected by different drying methods. Industrial Crops and Products, 134: 80-88. https://doi.org/10.1016/j.indcrop.2019.03.063
[11] Shi, L., Gu, Y., Wu, D., Wu, X., Grierson, D., Tu, Y., Wu, Y. (2019). Hot air drying of tea flowers: Effect of experimental temperatures on drying kinetics, bioactive compounds and quality attributes. International Journal of Food Science & Technology, 54(2): 526-535. https://doi.org/10.1111/ijfs.13967
[12] Sari, D.K., Affandi, D.R., Prabawa, S. (2020). Pengaruh waktu dan suhu pengeringan terhadap karakteristik teh daun tin (Ficus carica L.). Jurnal Teknologi Hasil Pertanian, 12(2): 68-77.
[13] Yuan, J., Hao, L.J., Wu, G., Wang, S., Duan, J.A., Xie, G.Y., Qin, M.J. (2015). Effects of drying methods on the phytochemicals contents and antioxidant properties of chrysanthemum flower heads harvested at two developmental stages. Journal of Functional Foods, 19: 786-795. https://doi.org/10.1016/j.jff.2015.10.008
[14] Naheed, Z., Barech, A.R., Sajid, M., Khan, N.A., Hussain, R. (2007). Effect of rolling, fermentation and drying on the quality of black tea. Sarhad Journal of Agriculture, 23(3): 577.
[15] Khodifad, B.C., Dhamsaniya, N.K. (2020). Drying of food materials by microwave energy-A review. International Journal of Current Microbiology and Applied Sciences, 9(5): 1950-1973. https://doi.org/10.20546/ijcmas.2020.905.223
[16] Aprea, E. (2020). Special issue “Volatile compounds and smell chemicals (odor and aroma) of food”. Molecules, 25(17): 3811. https://doi.org/10.3390/molecules25173811
[17] Khathir, R., Agustina, R., Hartuti, S., Fahmi, Z. (2020). Improving fermented virgin coconut oil quality by using microwave heating. IOP Conference Series: Earth and Environmental Science, 425: 012068. https://doi.org/10.1088/1755-1315/425/1/012068
[18] Khathir, R., Hartuti, S., Yunita, Y., Maulana, A.R., Anita, A. (2023). The effect of microwave heating on quality properties of coconut oil. In AIP Conference Proceedings, 2596: 040002. https://doi.org/10.1063/5.0118793
[19] Fiorentini, M., Kinchla, A.J., Nolden, A.A. (2020). Role of sensory evaluation in consumer acceptance of plant-based meat analogs and meat extenders: A scoping review. Foods, 9(9): 1334. https://doi.org/10.3390/foods9091334
[20] Ruiz-Capillas, C., Herrero, A.M. (2021). Sensory analysis and consumer research in new product development. Foods, 10(3): 582. https://doi.org/10.3390/foods10030582
[21] Yang, J., Lee, J. (2019). Application of sensory descriptive analysis and consumer studies to investigate traditional and authentic foods: A review. Foods, 8(2): 54. https://doi.org/10.3390/foods8020054
[22] Juanda, J., Agustina, R., Hartuti, S., Natasya, S. (2023). Optimum sensory formulation of bilimbi jam (Averrhoa bilimbi L.). IOP Conference Series: Earth and Environmental Science, 1183: 012111. https://doi.org/10.1088/1755-1315/1183/1/012111
[23] Roudi, A.M., Salem, S., Abedini, M., Maslahati, A., Imran, M. (2021). Response surface methodology (RSM)-based prediction and optimization of the fenton process in landfill leachate decolorization. Processes, 9(12): 2284. https://doi.org/10.3390/pr9122284
[24] Asadzadeh, F., Maleki-Kaklar, M., Soiltanalinejad, N., Shabani, F. (2018). Central composite design optimization of Zinc removal from contaminated soil, using citric acid as biodegradable chelant. Scientific Reports, 8(1): 2633. https://doi.org/10.1038/s41598-018-20942-9
[25] Fauzi, R.A., Widyasanti, A., Dwiratna, S., Perwitasari, N., Nurhasanah, S. (2022). Optimization of drying process on antioxidant activity of butterfly pea (clitoria ternatea) by using response surface methodology. Jurnal Teknologi Pertanian, 23(1). https://doi.org/10.21776/ub.jtp.2022.023.01.2
[26] Golpour, I., Kaveh, M., Blanco-Marigorta, A.M., Marcos, J.D., Guiné, R.P., Chayjan, R.A., Khalife, E., Karami, H. (2022). Multi-response design optimisation of a combined fluidised bed-infrared dryer for terebinth (Pistacia atlantica L.) fruit drying process based on energy and exergy assessments by applying RSM-CCD modelling. Sustainability, 14(22): 15220. https://doi.org/10.3390/su142215220
[27] Akter, F., Akther, S., Sultana, A., Rahman, M.M., Deb, U.K. (2022). Optimization of drying parameters for total phenolic content of papaya using response surface methodology. International Journal of Food Science, 2022: 4819725. https://doi.org/10.1155/2022/4819725
[28] Fadhil, R., Muzaifa, M., Juliadi, D. (2022). The product acceptance preferences of gayo arabica coffee brewing with additional fruit and spices variants. Mathematical Modelling of Engineering Problems, 9(6): 1659–1668, 2022. https://doi.org/10.18280/MMEP.090627
[29] Lawless, H.T., Heymann, H. (1999). Sensory Evaluation of Food. Springer, New York. https://doi.org/10.1007/978-1-4615-7843-7
[30] Singh-Ackbarali, D., Maharaj, R. (2014). Sensory evaluation as a tool in determining acceptability of innovative products developed by undergraduate students in food science and technology at the University of Trinidad and Tobago. Journal of Curriculum and Teaching, 3(1): 10-27.
[31] Hamzah, A.H., Akroot, A., Jaber, J.A. (2022). Analytical investigation of biodiesel mixed levels and operation factors’ effects on engine performance by RCM. International Journal of Design and Nature and Ecodynamics, 17(6):863-73. https://doi.org/10.18280/ijdne.170606
[32] Mostefa, B., Kaddour, R., Mimoun, Y., Embarek, D., Amar, K. (2021). Optimization of the stability and reliability of rotor system by the methodology of design experiments. Mathematical Modelling of Engineering Problems, 8(2): 302-314. https://doi.org/10.18280/mmep.080219
[33] Sipahutar, Y.H., Suryanto, M.R., Ramli, H.K., Pratama, R.B., Panjaitan, T.F. (2020). Organoleptic quality of whiteleg shrimp (litopenaeus vannamei) cultivated from intensive and traditional pond at Bulukumba district, South Sulawesi. IOP Conference Series: Earth and Environmental Science, 564: 012040. https://doi.org/10.1088/1755-1315/564/1/012040