Estimating the Economic Value of Carbon Sequestration by Sago Palm (Metroxylon sagu Rottb.) in Thailand

Malimas Jariyapong![]() | Saowalak Roongtawanreongsri*
| Saowalak Roongtawanreongsri*![]() | Buncha Somboonsuke
| Buncha Somboonsuke
© 2023 IIETA. This article is published by IIETA and is licensed under the CC BY 4.0 license (http://creativecommons.org/licenses/by/4.0/).
OPEN ACCESS
This study seeks to quantify the carbon sequestration values of sago palm plantations in southern Thailand, an essential yet economically overlooked component in climate change mitigation strategies on agricultural land. This overlooked aspect emphasizes the importance of living trees and soil carbon stocks. Firstly, carbon sequestration in living trees was determined using growth predictions from prior studies, coupled with an allometric equation to estimate both above-ground (AGB) and below-ground biomass (BGB). Secondly, the soil organic carbon (SOC) stock was computed utilizing the core method to calculate bulk density and organic carbon, following Walkley and Black’s methodology. A total of ten soil samples were collected from sago palm plantations for this purpose. The carbon sequestration value was derived from the sum of carbon dioxide (CO2) sequestration in living trees and the SOC stock in the soil, subsequently multiplied by the prevailing price of carbon trading in Thailand's official carbon market. Our results corroborate that sago palm plantations can sequester CO2 uninterruptedly for 50 years, eliminating the need for replanting. The carbon sequestration values in living trees were found to increase annually and remain consistent from the tenth year onwards, with an average carbon sequestration value ranging from 1,571-20,046 Baht ha-1 y-1 (42-581 USD) (based on the exchange rate from Baht to USD as of April 10, 2023). Notably, the Thang Poon 1 sago palm plantation demonstrated the highest SOC stock sequestration value of 79,173 Baht ha-1 y-1, thereby yielding the highest Net Present Value (NPV) compared to other plantations. These findings can aid in shaping policy recommendations for optimal farming management practices to augment both financial returns and ecosystem service benefits. Our study underscores the importance of understanding the benefits of sago palm cultivation compared to monoculture crops, which can inform more sustainable decision-making processes amongst agriculturalists and policymakers, particularly in selecting plant species with the highest potential for climate change mitigation.
biomass increment, carbon sequestration, climate change mitigation, converted wetland, ecosystem services, peatland, regulating services, soil organic carbon (SOC) stock
Agricultural land serves as a significant yet paradoxical contributor to both carbon dioxide (CO2) sequestration and release into the atmosphere [1]. The cyclical nature of CO2 in the atmosphere is predominantly driven by the activities of living trees, animals, and soil processes, including plant photosynthesis, respiration, and the microbial decomposition of dead organic matter [2]. Regrettably, the accelerated releases of CO2 have been largely attributed to contemporary intensive agricultural land management practices such as monoculture crop cultivation, which directly exacerbate CO2 releases through burning, tilling, and fertilizer use [3]. In 2019, the agricultural and forestry sectors were responsible for approximately 8.7 Gt CO2 y-1 emissions, surpassing other sectors and largely originating from deforestation and land-use changes, as noted by the IPCC [4]. Consequently, exploring methodologies for CO2 storage in agricultural land surfaces as a critical issue [1].
Sustainable agriculture emerges as a potential approach to ameliorate CO2 emissions from agricultural practice. This approach encapsulates both emission reduction and increased sequestration strategies, including fertilizer management and livestock reduction [5], as well as the preservation of dead organic matter and harvested products. Given the substantial and permanent carbon storage on agricultural lands in the form of living biomass and soil organic matter, appropriate agriculture management practices can facilitate long-term CO2 capture on land [1].
The sago palm, Metroxylon sagu Rottb., has been promoted as a commercial agricultural crop in Indonesia and Malaysia [6, 7], given its capacity to support food security and its positive impact on environmental sustainability. The starch derived from sago palm serves as a valuable raw material for various industries [8], including food, pharmaceuticals, and environmentally friendly plastics [9]. Furthermore, sago palm cultivation offers the unique advantage of thriving in swamp peat environments, where other crops may struggle, due to its lack of reliance on groundwater drainage [10, 11] or the use of pesticides to combat weeds and pests [12].
In terms of providing regulating services (the benefits people obtain from an ecosystem, such as climate regulation, water regulation, erosion regulation, water purification, or disease control and in this paper, the focused regulating services are carbon sequestration and stock [13]), research has demonstrated that sago palm cultivation can significantly curtail CO2 emissions compared to other commercial crops. For instance, a study by Hergoualc’h and Verchot [14] found that sago palm released lower level of CO2 from heterotrophic soil respiration (8.6 Mg CO2eq ha-1 y-1) than rice (36.1 Mg CO2eq ha-1 y-1) and oil palm (30.4 Mg CO2eq ha -1 y-1), while Uda et al. [7] found that sago palm plantations provide zero CO2. Additionally, Bintoro et al. [15] found that sago palm can absorb CO2 through photosynthesis at a higher rate than other crops such as sugarcane, corn, and cassava, which were 289, 225, 216, and 168 mt of CO2 ha-1 y-1, respectively. Thus, advocating for sago palm cultivation as a commercial crop can provide superior regulating services compared to other crops, particularly on agricultural land in swamp areas.
Previous studies reviews showed that most studies have focused on the amount of sago palms’ absorption and emission of CO2, especially those numbers are often in the form of the annual amount. There appears to be a lack of research on the monetary value of carbon sequestration by sago palms, except for Orentlicher [16], who studied the social cost of CO2 emission values from draining sago palms over 52 years. Additionally, Naim et al. [17] highlighted the unique property of sago palms, which do not require replanting as the parent palm automatically germinates suckers. This natural characteristic provides direct benefits by saving biomass and organic carbon loss in terms of harvested products, which could ultimately impact the net benefit of the ecosystem. However, no study to date has explored the direct and indirect net benefits of the monetary value of sago palm cultivation. Such value is crucial in incentivizing farmers to optimize sago palm cultivation, potentially leading to increased productivity and ecosystem services. Further, the carbon sequestration value of sago palm could be instrumental in shaping future GHG reduction policies.
This current study endeavors to fill this research gap by estimating the value of carbon sequestration by sago palm plantations in southern Thailand over a 50-year period, accounting for both the living biomass and soil organic carbon stock (SOC stock - the amount of carbon in a soil sample relative to the total mineral content and known bulk density) [18]. The findings of this study may contribute significantly to the literature on ecosystem service valuation, specifically carbon sequestration and carbon stock regulating services, in terms of calculation steps, required data for the calculation, and the resulting value. Meanwhile, the study reaffirms the substantial benefits of sago palm as a commercial crop, a topic that has been given less attention in existing literature. Furthermore, it could provide valuable insights for developing effective strategies for wetland use, GHG emissions reduction, climate change mitigation, and enhanced ecosystem and environmental benefits.
2.1 Study area and sample sites
The Sago palm plantation in this study is situated around the Thale Noi non-hunting area and Khuan Kreng swamp forest within the 2-kilometre boundary in Nakhon Si Thammarat, Phatthalung and Songkhla provinces in Southern Thailand (Figure 1). The coordinates of the plantations range from 7°37'18.862" to 8°26'6.202" N and 99°41'949" to 100°22'3.36" E [19] (Figure 1). The region experiences an average annual rainfall of 1,500-2,700 mm [20].
Figure 1. Location of sago palm cultivation practices
Our surveys and interviews revealed that only a few households in the area continuously utilize sago palms. All sago plantations in this study have existed for more than 30 years and occupy an area of less than three rai per household (one rai is approximately 0.40 acres or 0.16 hectares). To estimate the carbon sequestration value per hectare per year, we collected data from ten sago palm plantations that have an area of over one rai and continuously generate income from utilizing sago palm.
2.2 Sago palm cultivation characteristics
Thailand does not promote sago palm as a commercial crop, therefore, sago farmers typically plant and allow it to grow naturally near their houses, canals, rivers, or small fen, with flooding occurring almost year-round. This practice does not involve intensive management, with only sucker pruning, cutting off the leaf crown, and weeding around the tree’s base for convenient access. As a result, each farm is unable to accurately count the exact number of mother palms and their suckers. However, through interviews with farmers, it has been inferred that the average number of clumps per farm can be determined from the annual harvesting and selling of mature trunks, which can be harvested approximately ten years after transplanting, with an average of 75-80 trunks ha-1 y-1. The selling price of these trunks was determined by the distance from transport, with an average price of 300-600 Baht per trunk. Sago leaves, on the other hand, are typically harvested between years four and seven after transplanting, as farmers need the trunk to fully accumulate starch until the harvest year. These leaves are sold with a yearly contract, with an average fixed price of 3,000-5,000 Baht per farm.
2.3 Carbon sequestration estimation
This study examines the carbon sequestration of sago palms from two sources: living trees and soil organic carbon stock. It will be explained thoroughly in the subsequent sections.
2.3.1 Carbon sequestration in a living tree
To calculate carbon sequestration in a living tree, a tree’s biomass needed to be determined to derive the carbon stock. Then, the carbon stock will be multiplied with a conversion factor to derive the carbon sequestration.
Determination of biomass. The tree biomass varies based on the growth rate. The annual growth rate represents a biomass increment of living trees, which takes up CO2 during photosynthesis. Annual biomass (above- and below-ground) can be computed using allometric equations. The annual biomass will then be used to calculate the increment biomass for 50 years.
We used Eq. (1) and Eq. (2) to calculate the above-ground and below-ground biomass, respectively.
SAB = 6.666 + 12.826 × (h)0.5 × ln (h) (1)
The above-ground biomass estimation was derived from the allometric equation for the tropical palm by Pearson et al. [21], where SAB is the sago palm above-ground biomass (kg), and h is the total height (m).
SBB = SAB × 0.41 (2)
The below-ground biomass was calculated by the root/shoot ratio for the tropical palm, which is 0.41 [22], where SBB is the sago palm below-ground biomass (kg), SAB is the sago palm above-ground biomass (kg), and 0.41 is the root-to-shoot ratio in the tropical palm. Sago Palm Growth Prediction. The parameter needed in the above-ground biomass allometric equation is tree height. Therefore, the height of sago palm trees over 50 years needs to be predicted. A previous study [23] generated a linear mixed-effect model for sago palm growth predictions. This model was based on biometrics data collected from mother sago palms planted at an experimental plot in the Pikulthong Peat Swamp Forest Research Station. Our growth prediction model relied on the diameter and age of the palms as independent variables to forecast their height growth rate. Notably, most palms do not experience significant changes in their diameter, so biomass is typically estimated solely based on height [21]. The growth prediction models are Eq. (3) and Eq. (4):
Young sago palms (2-5 years) Height = 0.003 + 0.321(Age) + 0.030(D) + Z (0.232) (3)
Mature sago palms (6-20 years) Height = -2.515 + 0.681(Age) + 0.050(D) + Z (1.9618) (4)
where, D is diameter, Z is the ID whose value is one if the observation was coming from stratum 1, and 0 if not.
Determination of the number of sago palm trees. The number of sago palm trees per clump per year for 50 years is needed to determine the total annual sago palm’s above and below-ground biomass. As previously mentioned, the sago farms in this study faced a challenge in accurately counting the number of palms within a clump. To overcome this obstacle, this study adopted the sago palm sucker management pattern of Malaysia (Figure 2) [11] to determine the number of sago palm trees per clump.
Redraw with permission by authors from “The Sago Palm: The Food and Environmental Challenges of the 21st Century” (p. 178) by H. Ando, 2015, Trans Pacific Press, Copyright 2015 by Kyoto University Press and Trans Pacific Press.
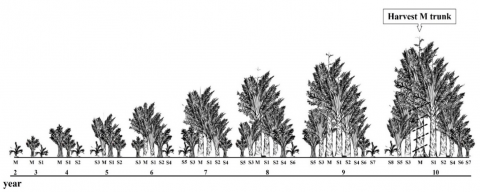
Figure 2 illustrates the sago palm suckers management technique, which involves keeping 6-8 new suckers per clump for continuous harvesting every year [11]. As a result, each clump contains palms of varying ages, and the number of palms increases every year. The counting of planting years began in year 2, as growth rate data for sago palms were unavailable in year one, and only the mother trunk was counted. During year 3 of planting, numerous suckers emerged from the mother trunk, but they were continuously pruned, and only one was kept per year (S1-S8). By year 10, the mature mother trunk was harvested, while the kept suckers continued to grow for harvesting in the following year. This practice allowed for the proliferation of suckers, eliminating the need for replanting.
Determination of Biomass Increment. The sum of tree biomass was used to determine the annual biomass increment based on age and growth rate for 50 years Eq. (5):
SBI = (SBy+1) – SBy (5)
where, SBI is the sago palm biomass increment (kg), SB is the sago palm biomass (kg), and y is the year.
The biomass increment per clump was calculated based on the sago palm sucker management pattern. Table 1 displays the number of mother trunks and suckers of sago palms in different years. The total biomass increment per clump varies depending on the number of suckers, which have different growth rates each year. As a result, the amount of biomass increment per clump gradually increases with the emergence of new suckers. This increment begins to accumulate from the third year and remains steady until year 9, with the amount of biomass increment remaining constant even after the mother trunk is harvested from each clump for up to 50 years. To calculate the biomass increment of sago palm per clump, refer to Eq. (6):
SBIC = MBIy+SBIi……+ SBIj (6)
where, SBIC is the sago palm biomass increment per clump (kg), MBI is the biomass increment of mother sago palm (kg), SBI is the biomass increment of sucker (kg), i and j are the number of suckers which be kept according to the planting year, and y is the year.
Table 1. Sago palm management pattern for estimating biomass increment
|
Year |
Age of Mother Sago Palm and Suckers in a Clump |
Total of Suckers per Clump in Each Year |
||||||||
|
M |
S1 |
S2 |
S3 |
S4 |
S5 |
S6 |
S7 |
S8 |
||
|
12 |
0 |
0 |
0 |
0 |
0 |
0 |
0 |
0 |
0 |
0 |
|
2 |
2 |
0 |
0 |
0 |
0 |
0 |
0 |
0 |
0 |
1 |
|
3 |
3 |
2 |
0 |
0 |
0 |
0 |
0 |
0 |
0 |
2 |
|
4 |
4 |
3 |
2 |
0 |
0 |
0 |
0 |
0 |
0 |
3 |
|
5 |
5 |
4 |
3 |
2 |
0 |
0 |
0 |
0 |
0 |
4 |
|
6 |
6 |
5 |
4 |
3 |
2 |
0 |
0 |
0 |
0 |
5 |
|
7 |
7 |
6 |
5 |
4 |
3 |
2 |
0 |
0 |
0 |
6 |
|
8 |
8 |
7 |
6 |
5 |
4 |
3 |
2 |
0 |
0 |
7 |
|
9 |
9 |
8 |
7 |
6 |
5 |
4 |
3 |
2 |
0 |
8 |
|
10 |
har1 |
9 |
8 |
7 |
6 |
5 |
4 |
3 |
2 |
8 |
|
… |
… |
… |
… |
… |
… |
… |
… |
… |
… |
… |
|
50 |
har |
9 |
8 |
7 |
6 |
5 |
4 |
3 |
2 |
8 |
Note: 1. har is harvest. 2. Year one is zero because there is no biometrics data on the sago palm; therefore, we start counting year two as the first year of transplanting. 3. The figures 0-9 in the table are the ages of the palm.
Determination of carbon stock. Carbon stock in sago palm biomass was estimated by the carbon conversion for the tropical palm, which is 41.30 per cent of total biomass [20], as in Eq. (7):
CIy = SBIy × 0.413 (7)
where, CI is the carbon stock increment yearly (kgCO2), SBI is the sago palm biomass increment per clump (kg), and y is the year.
2.3.2 Carbon sequestration in soil
Soil sample collection. As previously mentioned, the sago palm plantation area has some limitations, so we collected ten soil samples from the sago palm plantations that spanned over one Rai (0.16 ha) and were free from flooding following the recommendation by FAO [18] for soil density analysis that the samples should not be underwater or too humid. To ensure accuracy, soil samples were collected from three random sampling points, resulting in a total of nine sampling points in each plot. Disturbed soil samples were collected at a depth of 0-30 cm, while undisturbed soil samples were collected at a depth of 30 cm using a soil core with a diameter and height of 5 cm for bulk density analysis. The soil samples were tightly packed in plastic bags with labels attached before being sent to the Central Analysis Center of the Faculty of Natural Resource, Prince of Songkla University, for analysis. Soil organic carbon content was analyzed using the Walkley and Black method [24], while bulk density was determined using the core method [25]. Soil texture was determined using the [26].
Soil organic carbon stock calculation. Soil organic carbon stock was calculated following the FAO [18]:
SOC stock = OC × BD × D × 0.001 (8)
where, SOC stock is the soil organic carbon stock (kg C ha-1), OC is organic carbon (%), BD is bulk density (g cm -3), D is soil depth (cm), and 0.001 is the factor for converting kg C ha-1 to ton C ha-1.
Although the CO2 sequestration in a living tree was estimated using the prediction model, the calculation of an annual soil carbon stock cannot be predicted because the distribution of SOC stock in the soil is varied due to location, temperature, moisture in soil [27] and time [28], making it unable to predict the SOC stock trend [18]. Therefore, this study assumes that the SOC stock for the studied year remains constant for the next 50 years.
2.3.3 Total carbon sequestration of sago palm
Then, the yearly carbon stock increments in a living palm and SOC stock is used to calculate the CO2 sequestration by multiplying the estimated amount of carbon stock by the CO2 conversion factor of 3.67 [2], as in Eq. (9):
CO2 sequestration = (CI living tree + SOC stock) × 3.67 (9)
where, CI living tree is the yearly carbon stock increments in a living tree (kgCO2), SOC stock is the soil organic carbon stock (kg C ha-1).
2.4 Estimation of the carbon sequestration value
The CO2 sequestration in a living tree and soil value was calculated by the carbon trading price of the forest, agriculture, and other land use sectors in Thailand, which is the official price for trading in the carbon market in Thailand under the Thailand Voluntary Emission Reduction Program (T-VER) [29], which was average at 1900 Baht/ton CO2eq. In this study, the sago palm plantation has existed for more than 30 years; thus, the planting period was set for 50 years.
CO2 sequestration value = (SOC stock + CO2 sequestration) × carbon price (10)
To determine the net present value (NPV), the discount rate of 6.8% of the Bank for Agriculture and Agricultural Cooperatives [30]. This bank rate was chosen to reflect the actual circumstances of farmers, as this Bank is the primary institution utilized by the majority of agriculturalists for their financial loans.
Table 2 presents the predicted annual biomass of living sago palms between the ages of two and 20 years from the prediction model. The total biomass ranged from 6.87 to 184.15 tons. Notably, there was a sharp increase in biomass from ages two to eight, followed by a slight and steady increase from ages nine to 12 and a slight decrease at age 13. These findings suggest that sago palms between the ages of two and eight are more effective at absorbing CO2 from the atmosphere and storing it in their biomass than those between ages nine and 20. It is apparent that the annual tree growth rate affects this value, as the sago palm rapidly grows to form the trunk in the first 1-5 years of transplanting. After the trunk formation process is completed, the growth rate stabilizes within 6-17 years of transplanting [31].
Table 2. Per trunk annual total biomass, biomass increment, carbon stock increment, and CO2 sequestration of living sago palm from years 1-20
|
Age |
Total H (m) |
AGB (kg) |
BGB (kg) |
Total Biomass (kg) |
Biomass Increment (kg) |
C Stock Increment (kgC) |
CO2 Sequestration (kgCO2eq) |
|
1 |
0 |
0.00 |
0.00 |
0.00 |
0.00 |
0.00 |
0.00 |
|
2 |
0.86 |
4.87 |
2.00 |
6.87 |
6.87 |
2.82 |
10.34 |
|
3 |
1.24 |
9.74 |
3.99 |
13.73 |
6.86 |
2.81 |
10.32 |
|
4 |
1.70 |
15.54 |
6.37 |
21.91 |
8.18 |
3.35 |
12.31 |
|
5 |
2.28 |
22.63 |
9.28 |
31.91 |
9.99 |
4.10 |
15.04 |
|
6 |
2.94 |
30.38 |
12.46 |
42.84 |
10.93 |
4.48 |
16.45 |
|
7 |
3.83 |
40.37 |
16.55 |
56.93 |
14.09 |
5.78 |
21.20 |
|
8 |
5.07 |
53.55 |
21.95 |
75.50 |
18.58 |
7.62 |
27.95 |
|
9 |
5.92 |
62.16 |
25.49 |
87.65 |
12.15 |
4.98 |
18.28 |
|
10 |
6.67 |
69.52 |
28.51 |
98.03 |
10.38 |
4.26 |
15.62 |
|
11 |
7.43 |
76.78 |
31.48 |
108.26 |
10.23 |
4.20 |
15.40 |
|
12 |
8.23 |
84.22 |
34.53 |
118.75 |
10.49 |
4.30 |
15.79 |
|
13 |
8.97 |
90.94 |
37.29 |
128.23 |
9.47 |
3.88 |
14.26 |
|
14 |
9.67 |
97.17 |
39.84 |
137.00 |
8.78 |
3.60 |
13.20 |
|
15 |
10.49 |
104.31 |
42.77 |
147.07 |
10.07 |
4.13 |
15.15 |
|
16 |
10.98 |
108.50 |
44.49 |
152.99 |
5.91 |
2.42 |
8.90 |
|
17 |
11.82 |
115.57 |
47.39 |
162.96 |
9.97 |
4.09 |
15.01 |
|
18 |
12.38 |
120.21 |
49.29 |
169.50 |
6.54 |
2.68 |
9.84 |
|
19 |
13.02 |
125.44 |
51.43 |
176.88 |
7.38 |
3.02 |
11.10 |
|
20 |
13.66 |
130.60 |
53.55 |
184.15 |
7.27 |
2.98 |
10.95 |
Table 3. Per clump and hectare total biomass increment, carbon stock, CO2 sequestration, and CO2 sequestration values of living sago palm at different ages
|
Year |
Biomass Increment in a Clump |
Per Clump |
Per hectare (80 clumps) |
||||||||||||||
|
Total biomass increment (kg) |
Total biomass increment (ton) |
C stock (ton C) |
CO2 sequestration (ton CO2eq) |
Total Biomass increment (ton) |
C stock (ton C) |
CO2 sequestration (ton CO2eq) |
Value2 (Baht) |
||||||||||
|
M |
S1 |
S2 |
S3 |
S4 |
S5 |
S6 |
S7 |
S8 |
|||||||||
|
1 |
0 |
0 |
0 |
0 |
0 |
0 |
0 |
0 |
0 |
0 |
0 |
0 |
0 |
0 |
0 |
0 |
0 |
|
2 |
6.9 |
0 |
0 |
0 |
0 |
0 |
0 |
0 |
0 |
6.9 |
0.007 |
0.003 |
0.01 |
0.6 |
0.2 |
0.83 |
1,571 |
|
3 |
6.9 |
6.9 |
0 |
0 |
0 |
0 |
0 |
0 |
0 |
13.8 |
0.014 |
0.006 |
0.02 |
1.1 |
0.5 |
1.65 |
3,140 |
|
4 |
8.2 |
6.9 |
6.9 |
0 |
0 |
0 |
0 |
0 |
0 |
21.9 |
0.022 |
0.009 |
0.03 |
1.8 |
0.7 |
2.64 |
5,011 |
|
5 |
10 |
8.1 |
6.9 |
6.9 |
0 |
0 |
0 |
0 |
0 |
31.9 |
0.032 |
0.013 |
0.05 |
2.6 |
1.0 |
3.84 |
7,298 |
|
6 |
10.8 |
10 |
8.2 |
6.9 |
6.9 |
0 |
0 |
0 |
0 |
42.8 |
0.043 |
0.018 |
0.06 |
3.4 |
1.4 |
5.16 |
9,798 |
|
7 |
14.1 |
10.8 |
10 |
8.2 |
6.9 |
6.9 |
0 |
0 |
0 |
56.9 |
0.057 |
0.023 |
0.09 |
4.6 |
1.9 |
6.85 |
13,020 |
|
8 |
18.6 |
14.1 |
10.8 |
10 |
8.2 |
6.9 |
6.9 |
0 |
0 |
75.5 |
0.076 |
0.031 |
0.11 |
6.0 |
2.5 |
9.09 |
17,267 |
|
9 |
12.2 |
18.6 |
14.1 |
10.9 |
10 |
8.2 |
6.9 |
6.9 |
0 |
87.7 |
0.088 |
0.036 |
0.13 |
7.0 |
2.9 |
10.55 |
20,046 |
|
10 |
har1 |
12.2 |
18.6 |
14.1 |
10.9 |
10 |
8.2 |
6.9 |
6.9 |
87.7 |
0.088 |
0.036 |
0.13 |
7.0 |
2.9 |
10.55 |
20,046 |
|
… |
… |
… |
… |
… |
… |
… |
… |
… |
… |
… |
… |
… |
|
… |
… |
… |
… |
|
50 |
har |
12.2 |
18.6 |
14.1 |
10.9 |
10 |
8.2 |
6.9 |
6.9 |
87.7 |
0.088 |
0.036 |
0.13 |
7.0 |
2.9 |
10.55 |
20,046 |
Note: 1. har is harvest. 2. The value is not discounted to the present value.
On average, each clump can absorb 0.01-0.13 tons of CO2eq, while each hectare can absorb 0.83-10.55 tons of CO2eq. This CO2 sequestration translates to an average value of 20-251 Baht (0.57-7.27 USD) per clump and 1,571-20,047 Baht (42.71-581.23 USD) per hectare, as shown in Table 3. Therefore, the sago palm has the remarkable ability to absorb CO2 from the atmosphere for 50 years without the need for replanting.
Table 4 summarizes the soil carbon stock in various soil textures where sago palms grow. The results indicate that the sago palm plantation in Thang Poon 1 and Khao Pra Bat 2 sites have the highest SOC stock at 11.35 and 7.88 tons ha-1, respectively, while the sago palm plantation in Thang Poon 2 site has the lowest SOC stock at 2.97 tons ha-1. The main reason is the various ecology of sago palm growing areas. The largest SOC stocks from Thang Pooon 1 and Khao Pra Bat 2 sites are where the sago palms grow in the water logging environment (41.67 and 28.93 ton CO2eq), while other sago farm sites grow near the canal with lower carbon stocks (2.97-11.53 ton CO2eq). These different values may be due to the difference in ecology. The ecological benefit of the fen is that it can store large amounts of carbon and regulate water flow [32].
The total CO2 sequestration value in this study was calculated based on the sum of carbon sequestration in a living tree and soil (Table 5). The findings suggest that after 50 years of sago palm planting, the highest NPV was observed in the sago palm plantation in Thang Poon 1, which was 1,373,911 Baht (39,835 USD). Conversely, the lowest NPV was found in the sago palm plantation in Thang Poon 2, which was 294,372 Baht (8,534.99 USD). The reason for this phenomenon is the same as discussed above. These results demonstrate that promoting sago palm as a commercial crop can provide ecosystem service in both quantities and values of CO2 sequestration, which continuously increases from year two of planting and maintains its potential until 50 years.
This study estimated sago palms’ carbon sequestration value, including the biomass increments in a living tree and the soil carbon stock, particularly in peat soil areas. The result showed that the value of carbon sequestration increases from years 2-10 of planting and remains constant until year 50. However, there are limitations to this research, particularly in relation to the CO2 sequestration valuation of living sago in the long term. Because previous studies have focused on the relationship between biomass and the potential for starch accumulation in trunk pith but did not directly estimate carbon storage and sequestration, it is difficult to compare the findings of this study with others, particularly in terms of ecosystem service values.
Previous research has studied carbon stock and CO2 sequestration in living sago palms. However, the comparison in Table 6 shows that carbon stock and CO2 sequestration differ from other areas, which may be due to differences in methodology. For example, Bintoro et al. [15] studied CO2 absorption through the photosynthesis process, while Peng and Malek [33] estimated carbon increment at a rate of 2.6 t C ha-1 y-1 every year, and Watanabe et al. [34] estimated carbon stock by dry weight technique from five sago palm samples at different ages in a clump. On the contrary, this study used growth prediction generated from annual biometrics data by the linear mixed-effect model.
Table 4. Soil organic matter (OM), soil organic carbon (OC), and soil organic carbon (SOC) stock at different sago palm plantation sites
|
Sample Sites |
Soil Texture |
OM (%) |
OC (%) |
SOC (ton C ha-1) |
CO2 Sequestration (ton CO2eq ha-1) |
Value (Baht ha-1 yr-1) |
|
Panang Tung 1 |
clay loam |
4.84 |
2.82 |
3.14 |
11.53 |
21,907 |
|
Panang Tung 2 |
clay loam |
3.49 |
2.03 |
2.88 |
10.58 |
20,102 |
|
Kreng 1 |
loam |
2.23 |
1.30 |
1.73 |
6.35 |
12,065 |
|
Kreng 2 |
loam |
1.87 |
1.09 |
1.49 |
5.46 |
10,374 |
|
Cha-at 1 |
loam |
1.78 |
1.04 |
1.53 |
5.62 |
10,678 |
|
Cha-at 2 |
loam |
3.28 |
1.91 |
2.07 |
7.60 |
14,440 |
|
Khao Pra Bat 1 |
clay loam |
2.35 |
1.37 |
1.56 |
5.71 |
10,849 |
|
Khao Pra Bat 2 |
silt clay loam |
13.52 |
7.86 |
7.88 |
28.93 |
54,967 |
|
Thang Poon 1 |
silt clay loam |
18.11 |
10.53 |
11.35 |
41.67 |
79,173 |
|
Thang Poon 2 |
loamy sand |
2.25 |
1.31 |
0.81 |
2.97 |
5,643 |
Table 5. Total carbon sequestration value and the NPV (50 years) of sago palm at different plantation sites of different ages
|
Year |
1 |
2 |
3 |
4 |
5 |
6 |
7 |
8 |
9 |
10 |
50 |
NPV (Baht ha-1) |
|
Panang Tung 1 |
0 |
23,478 |
25,047 |
26,918 |
29,205 |
31,705 |
34,927 |
39,174 |
41,953 |
41,953 |
41,953 |
547,255 |
|
Panang Tung 2 |
0 |
21,575 |
23,045 |
24,799 |
26,944 |
29,287 |
32,308 |
36,290 |
38,895 |
38,895 |
38,895 |
506,653 |
|
Kreng 1 |
0 |
13,538 |
15,008 |
16,762 |
18,907 |
21,250 |
24,271 |
28,253 |
30,858 |
30,858 |
30,858 |
388,657 |
|
Kreng 2 |
0 |
11,847 |
13,317 |
15,071 |
17,216 |
19,559 |
22,580 |
26,562 |
29,167 |
29,167 |
29,167 |
363,293 |
|
Cha-uat 1 |
0 |
12,151 |
13,621 |
15,375 |
17,520 |
19,863 |
22,884 |
26,866 |
29,471 |
29,471 |
29,471 |
368,293 |
|
Cha-uat 2 |
0 |
15,913 |
17,383 |
19,137 |
21,282 |
23,625 |
26,646 |
30,628 |
33,233 |
33,233 |
33,233 |
423,526 |
|
Khao Pra Bat 1 |
0 |
12,322 |
13,792 |
15,546 |
17,691 |
20,034 |
23,055 |
27,037 |
29,642 |
29,642 |
29,642 |
370,804 |
|
Khao Pra Bat 2 |
0 |
56,440 |
57,910 |
59,664 |
61,809 |
64,152 |
67,173 |
71,155 |
73,760 |
73,760 |
73,760 |
1,018,527 |
|
Thang Poon 1 |
0 |
80,646 |
82,116 |
83,870 |
86,015 |
88,358 |
91,379 |
95,361 |
97,966 |
97,966 |
97,966 |
1,373,910 |
|
Thang Poon 2 |
0 |
7,116 |
8,586 |
10,340 |
12,485 |
14,828 |
17,849 |
21,831 |
24,436 |
24,436 |
24,436 |
294,371 |
Another valuable regulating service from sago palm plantations is the SOC stock in the soil. Previous research has not directly studied its presence in sago palm plantations; only some studies focused on organic matter (OM) and organic carbon (OC), the main components used in SOC stock calculation [18]. Hence, we compared the OM and OC content of sago palm plantations in other similar areas (Table 6), particularly that of Narathiwat in southern Thailand, where sago palms have grown naturally for over 30 years without any sucker pruning, pest control, weed management, or fertilizer application [35]. This study’s results are lower than others, probably due to the difference in peat depth, ecology and soil microorganism activity. These factors affect carbon storage in soil [36]. Such practices may positively impact long-term SOC stock and provide more benefits in regulating nutrient cycling and primary productivity [1]. However, the SOC stock in sago palm planting data is still lacking, particularly considering SOC sequestration in monetary terms. Therefore, further research is needed to fully understand the potential benefits of sago palm plantations regarding SOC sequestration and the economic value of this service.
Although there is no research on the sago palm value of CO2 sequestration to compare with this study, there is work done on other commercial crops. Compared with rubber monocultures in the year 25 of planting, sago palm has a higher value of CO2 sequestration from living biomass, which was 581.23 USD, compared to 565.8 USD for rubber monocultures [37]. Furthermore, in year 26 of planting, sago palm plantations continue to provide CO2 sequestration value, while rubber monoculture requires replanting. This replanting process results in biomass carbon loss from the wood harvesting process, which affects the soil’s accumulated organic carbon during the harvested year [38]. However, the wood product of rubber trees is considered a provisioning service (products obtained from ecosystems including food, materials, fiber, fuel, and genetic resources [13]) that can provide direct income for farmers in the year 25 [37] and may affect the net present value of the direct benefit. The need to study the cost-benefit of both direct and indirect income covering the replanting year is evident in order to compare the highest benefit of each commercial crop planting more clearly.
This research results also suggest that the economic value of both living biomass and SOC stock of sago palm plantations should be considered together, as previous research usually studies the value of biomass or SOC stock separately, although they are both linked to the primary carbon pool. Particularly, the fact that sago palms do not require replanting means less tillage, a practice that often disturbs the soil decomposition process [39]. This no-replanting practice can be economically advantageous for farmers. Therefore, it is crucial to consider the environmental benefits of sago palm cultivation in the cost-benefit analysis of crop planting and compare it with other cash crops, which can help develop an environmentally friendly commercial crop system in the future.
The limitation of this study lies in SOC stock data to assess carbon sequestration covering a period of 50 years. As per the FAO guidelines [18], changes in SOC stock should be monitored and measured every 4-5 years. Since this study was time-limited, we could only use the SOC stock quantification of the data collection year, which may have led to an overestimation of the values. Future research should be carried out to either collect the annual SOC stock or formulate a model to predict one so that the 50-year SOC stock can be estimated with more precision and, thus, a more accurate value of carbon sequestration.
Table 6. Carbon stock compared with other areas
|
|
This Study |
Other Studies |
Location |
Sources |
|
Living Sago Palm |
||||
|
CO2 Sequestration |
0.90-11.47 t CO2 ha-1 y-1 |
289 mt CO2 ha-1 y-1 |
Papua, Indonesia |
Bintoro et al. [15] |
|
Carbon stock |
0.25-3.13 t C ha-1 y-1 |
1-4 t C ha-1 y-1 |
Sarawak, Malaysia |
Watanabe et al. [34] |
|
|
|
25.8-31.1 t C y-1 |
Sarawak, Malaysia |
Peng and Malek [33] |
|
SOC Stock |
||||
|
Organic Carbon (%) |
1.01-10.53 |
4.4 -12.3 |
Narathiwat, Thailand |
Nozaki et al. [40] |
|
Organic matter (%) |
1.78-18.1 |
19.1-28.7 |
South of Thailand |
Anugoolprasert et al. [35] |
Sago palm plantations can absorb CO2 from the atmosphere and store it in living trees and soil long-term. The double benefit is that they provide these continuous indirect benefits for farmers and the ecosystem without the need for replanting. As such, sago palm plantations should be promoted as an environmentally friendly crop, particularly in agricultural land converted from wetlands. The research results provide insight that supports the policy of the Land Development Department [41] by presenting tangible net present value information currently lacking. Additionally, this information can be utilized by relevant government agencies in land use planning and zoning to safeguard vulnerable areas from drainage. However, further research is necessary to determine the specific land suitability before finalizing these zones, as any utilization of the converted wetlands should be carefully studied, considering both direct and indirect benefits, and always prefer environmentally friendly alternatives. Also, future research should focus on more comprehensive data on SOC stock, carbon sequestration and emission values compared to other commercial crops. Data should be gathered in actual years for a certain period to cover all variations of activities and other factors, such as temperature, moisture, and farm management, and develop accurate models to predict the SOC stock in the studied areas. Besides, research should be conducted to compare the net present value of benefits from different crops. Such analysis should consider factors such as data availability on production costs, productivity, product price, harvest years, and value of ecosystem services. Furthermore, sago palm farmers can apply and benefit from the Thailand Voluntary Emission Reduction Program. This opportunity can be an incentive for farmers to adopt more environmentally friendly practices in converted wetlands, thereby contributing to sustainability efforts and climate change mitigation.
We gratefully acknowledge the financial support provided by the Agricultural Research Development Agency and the National Science and Technology Development Agency for this research. We appreciate the Trans-Pacific Press Co., Ltd. and the Japan Academic Association for Copyright Clearance for granting us permission to recreate Figure 2 in our work. We would also like to express our sincere gratitude to the sago farmers and the Environmental Economic Research Unit at Prince of Songkla University for their invaluable assistance in encouraging and supporting this research, particularly the collection of soil sampling data. Their contributions have been instrumental in the success of this study.
[1] Angelo, M.J., Plesis, A.D. (2019). Climate Change and Land: An IPCC Special Report on Climate Change, Desertification, Land Degradation, Sustainable Land Management, Food Security, And Greenhouse Gas Fluxes in Terrestrial Ecosystems. Edward Elgar Publishing. https://doi.org/10.4337/9781784710644
[2] Penman, J., Gytarsky, M., Hiraishi, T., et al. (2003). Good practice guidance for land use, land-use change and forestry. Institute for Global Environmental Strategies (IGES) for the IPCC. https://www.ipcc-nggip.iges.or.jp/public/gpglulucf/gpglulucf_files/GPG_LULUCF_FULL.pdf.
[3] Adewale, C., Higgins, S., Granatstein, D., Stöckle, C.O., Carlson, B.R., Zaher, U.E., Carpenter-Boggs, L. (2016). Identifying hotspots in the carbon footprint of a small scale organic vegetable farm. Agricultural Systems, 149: 112-121. https://doi.org/10.1016/j.agsy.2016.09.004
[4] Shukla, P.R., Skea, J., Reisinger, A., et al. (2022). Summary for Policymaker. In Climate change 2022: Mitigation of climate change. Cambridge University Press, Cambridge, UK. https://doi.org/10.1017/9781009157926.001
[5] Mcdonald, H., Frelih-Larsen, A., Lóránt, A., Duin, L., Andersen, S.P., Costa, G., Bradley, H. (2021). Carbon farming making agriculture fit for 2030. Policy Department for Economic, Scientific and Quality of Life Policies, Directorate-General for Internal Policies, European Parliament, Luxembourg. https://op.europa.eu/en/publication-detail/-/publication/c99a667b-9dc5-11ec-83e1-01aa75ed71a1/language-en/format-PDF/source-283910826.
[6] Timisela, N.R., Siahaya, W.A., Hehanussa, M.M., Polnaya, F.J. (2022). Condition of plantation and development strategy of sago garden. International Journal of Sustainable Development and Planning, 17(2): 421-432. https://doi.org/10.18280/ijsdp.170207
[7] Uda, S.K., Hein, L., Adventa, A. (2020). Towards better use of Indonesian peatlands with paludiculture and low-drainage food crops. Wetlands Ecology and Management, 28(3): 509-526. https://doi.org/10.1007/s11273-020-09728-x
[8] Rajakal, J.P., Andiappan, V., Wan, Y.K. (2021). A Pareto multi-objective optimization for sustainable expansion in sago plantations. Chemical Engineering Transactions, 83: 157-162. https://doi.org/10.3303/CET2183027
[9] Bintoro, M.H., Pratama, A.J., Iqbal, M.N., Ahmad, F., Saputra, H.K.H., Bintoro, I.A., Ayulia, L. (2020). Mix farming based on sago palm in Meranti Island District, Riau Province, Indonesia. Alınteri Zirai Bilimler Dergisi, 35: 106-112. https://doi.org/10.28955/alinterizbd
[10] Syahza, A., Suwondo, Bakce, D., Nasrul, B., Mustofa, R. (2020). Utilization of peatlands based on local wisdom and community welfare in Riau Province, Indonesia. International Journal of Sustainable Development and Planning, 15(7): 1119-1126. https://doi.org/10.18280/ijsdp.150716
[11] Ando, H. (2015). Cultivation and management. The sago palm: The food and environmental challenges of the 21st century, 157-198.
[12] Lim, L.W.K., Chung, H.H., Hussain, H., Bujang, K. (2019). Sago palm (Metroxylon sagu Rottb.): Now and beyond. Pertanika Journal of Tropical Agricultural Science, 42(2): 435-451.
[13] MA. (2005). Ecosystems And Human Well-Being: Systhesis. Island Press. Washington, DC. https://www.millenniumassessment.org/documents/document.356.aspx.pdf.
[14] Hergoualc’h, K., Verchot, L.V. (2014). Greenhouse gas emission factors for land use and land-use change in Southeast Asian peatlands. Mitigation and Adaptation Strategies for Global Change, 19: 789-807. https://doi.org/10.1007/s11027-013-9511-x
[15] Bintoro, M.H., Nurulhaq, M.I., Pratama, A.J., Ahmad, F., Ayulia, L. (2018). Growing area of sago palm and its environment. Sago Palm, 17-29. https://doi.org/10.1007/978-981-10-5269-9_2
[16] Orentlicher, N. (2019). Carbon, palm and peat: Assessing the environmental and economic sustainability of sago for the carbon emissions reduction of Indonesian peatlands. Unpublished MSc Thesis. Wageningen University. https://edepot.wur.nl/525114.
[17] Naim, H.M., Yaakub, A.N., Awang Hamdan, D.A. (2016). Commercialization of Sago through estate plantation scheme in Sarawak: The way forward. International Journal of Agronomy, 8319542. https://doi.org/10.1155/2016/8319542
[18] FAO. (2018). Measuring and modelling soil carbon stocks and stock changes in livestock production systems - Guidelines for assessment (Draft for public review). Food and Agriculture Organization of the United Nations. https://www.fao.org/3/ca2934en/CA2934EN.pdf.
[19] Khampeera, A. (2017). Spatial analysis of drought in Kuan Kreng peat swamp for peatland fire management using geo-information technology. Doctoral dissertation. Prince of Songkla University. https://kb.psu.ac.th/psukb/handle/2016/11421.
[20] National hydroinformatics data center. (2023). Annual average rainfall report. https://www.thaiwater.net/weather/rainfall.
[21] Pearson, T., Walker, S., Brown, S. (2005). Sourcebook for land use, land-use change and forestry projects. Winrock International and the BioCarbon Fund of the World Bank, 21(3): 64. https://winrock.org/wp-content/uploads/2016/03/Winrock-BioCarbon_Fund_Sourcebook-compressed.pdf.
[22] Sripraram, D., Puangjit, L., Diloksamphan, S., Teechantuek, S., Jamwong, N., Thaophimai, L., Sungthong, T. (2010). Guidelines for plant potential for promotion under the forest sector clean development mechanism program. Argsorn Siam Press. https://www.tgo.or.th/2020/index.php/th/post/คู่มือศักย.
[23] Jariyapong, M., Roongtawanreongsri, S., Romyen, A., Somboonsuke, B. (2021). Growth prediction of sago palm (Metroxylon sagu) in Thailand using the linear mixed-effect model. Biodiversitas, 22(12): 5293-5301. https://doi.org/10.13057/biodiv/d221209
[24] Walkley, A., Black, J.A. (1934). An examination of the dichromate method for determining soil organic matter and a proposed modification of the chromic acid titration method. Soil Science, 37(1): 29-38. https://doi.org/10.1097/00010694-193401000-00003
[25] Blake, G.R., Hartge, K.H. (1986). Bulk Density. In: Methods of soil analysis. Part I. Physical and mineralogical methods. American Society of Agronomy, Soil Science Society of America and Madison, 365-375.
[26] Lesa Project Thailand. (2004). Soil texture. http://www.lesa.biz/earth/lithosphere/soil/soil-texture, accessed on Mar. 17, 2022.
[27] Roslee, R., Rahim, S.A., Mohd, W., Idris, R. (2016). Soil carbon sequestration in different ages of oil palm plantations. American-Eurasian Journal of Agriculture & Environment, 16(5): 1004-1007. https://doi.org/10.5829/idosi.aejaes.2016.16.5.103134
[28] Daud, N.N.N., Chinenyenwa, A.S., Rhys, T.H., Ken, L., Lee, H. (2019). Carbon sequestration in malaysian oil palm plantations – An overview. Environmental Science and Engineering, 3: 49-56. https://doi.org/10.1007/978-981-13-2227-3_6
[29] Thailand greenhouse gas management organization. (2022). Carbon credit trading price. http://carbonmarket.tgo.or.th/.
[30] Bank for agriculture and agricultural cooperatives (2020). Interest rates for prime customers year 2023. https://www.baac.or.th/th/index.php?cover_page=1.
[31] Nabeya, K., Nakamura, S., Nakamura, T., Fujii, A., Watanabe, M., Nakajima, T., Nitta, Y., Goto, Y. (2015). Growth behavior of sago palm (Metroxylon sagu Rottb.) from transplantation to trunk formation. Plant Production Science, 18(2): 209-217. https://doi.org/10.1626/pps.18.209
[32] Keddy, P.A. (2010). Wetland Ecology Principle and Conservation (2nd ed.). Cambridge University.
[33] Peng, E.K., Malek, M.A. (2018). Biomass carbon stock change from major crops cultivated on agricultural land in Sarawak. International Journal of Civil Engineering and Technology (IJCIET), 9(11): 728-736.
[34] Watanabe, A., Makabe, S., Ando, H., Kakuda, K., Donn, S., Mohd, Z.A., Melling, L. (2016). Carbon cycle sago palm cultivation system in tropical peatland. In Proceedings of the 15th International Peat Congress, Malaysia 2016, pp. 256-259. https://peatlands.org/assets/uploads/2019/06/ipc16p256-259a136watanabemakabe.etal_.pdf.
[35] Anugoolprasert, O., Ehara, H., Kinoshita, S., Chutimanukul, P., Prathumyot, W., Chakhatrakan, S. (2012). Nutrient accumulation in plant tissues of sago palm in the rosette stage at different levels of soil pH in South Thailand. Sago Palm, 20: 22-28.
[36] Department of land development. (2016). Carbon Sequestration of Benchmark Northeast Thailand. Soil Resources Survey and Research Division, Department of Land Development. https://oer.learn.in.th/search_detail/result/113494.
[37] Nattharom, N., Roongtawanreongsri, S., Bumrungsri, S. (2021). The economic value of ecosystem services of rubber-based agroforest plantations in South Thailand. Journal of Sustainability Science and Management, 16(5): 247-262. https://doi.org/10.46754/JSSM.2021.07.016
[38] Zhang, L., Sun, Y., Song, T., Xu, J. (2019). Harvested wood products as a carbon sink in China, 1900-2016. International Journal of Environmental Research and Public Health, 16(3): 1-13. https://doi.org/10.3390/ijerph16030445
[39] Martinsen, V., Shitumbanuma, V., Mulder, J., Ritz, C., Cornelissen, G. (2017). Effects of hand-hoe tilled conservation farming on soil quality and carbon stocks under on-farm conditions in Zambia. Agriculture, Ecosystems & Environment, 241: 168-178. https://doi.org/10.1016/j.agee.2017.03.010
[40] Nozaki, K., Nuyim, T., Shinano, T., Hamada, S., Ito, H., Matsui, H., Osaki, M. (2004). Starch properties of the sago palm (Metroxylon sagu Rottb.) in different soils. Plant Foods for Human Nutrition, 59: 85-92. https://www.doc-developpement-durable.org/file/Culture/Culture-plantes-alimentaires/FICHES_PLANTES/sagoutier/DifferentSoilsStarchPropertiesOfTheSagoPalm.pdf.
[41] Land development department. (2022). Soil organic problem management. https://www.ldd.go.th/Web_Soil/organic.htm.