Aniek Iriany![]() | Indah Prihartini*
| Indah Prihartini*![]() | Aulia Zakia
| Aulia Zakia![]() | Mahmudi | Erfan Dani Septia
| Mahmudi | Erfan Dani Septia![]() | F.A.R. Farahdina
| F.A.R. Farahdina![]() | Faridlotul Hasanah
| Faridlotul Hasanah![]()
© 2023 IIETA. This article is published by IIETA and is licensed under the CC BY 4.0 license (http://creativecommons.org/licenses/by/4.0/).
OPEN ACCESS
The progressive decrease in rice production in Indonesia is associated with soil infertility, resulting in inhibited plant growth. This study investigated the impact of bioactivators on soil properties and the growth and yield of two rice (Oryza sativa L.) varieties, namely Inpari 32 and IR 64. A factorial nesting design was implemented, taking into account two primary factors: the dose of bioactivator (ranging from 10-30 ml/l, applied pre- or post-plowing) and the rice variety. Two control conditions, namely inorganic and organic fertilizers, were also included. The results demonstrated that both the rice variety and bioactivator application significantly influenced various plant and soil parameters, such as plant height, clump diameter, number of tillers per clump, root length, plant fresh and dry weight, yield, and soil properties. While the control treatments of inorganic and organic fertilizers yielded superior results in terms of clump diameter and number of tillers, bioactivator application resulted in longer roots and higher biomass across both rice varieties. Notably, the application of a 10 ml dose of bioactivator prior to plowing, specifically on the Inpari 32 variety, was found to improve plant dry weight and fresh weight more effectively than the control and other treatments. Moreover, post-plowing application of a 20 ml/l bioactivator concentration increased soil water content, the potential of C-organic, and P2O5. These findings suggest that bioactivator application could be an effective strategy for enhancing soil fertility and rice crop productivity, thereby addressing the ongoing decrease in rice production in Indonesia.
bioactivator, biofertilizer, soil fertility, sustainable agriculture
Rice is a staple food for 97% of Indonesia's population, thereby playing an integral role in the country's food security. If the increase in national rice demand is not balanced with sufficient rice production, it is feared that the rice supply for the community will not be fulfilled. Despite the country's agricultural land spanning 7.75 million hectares in 2017, a steady decrease has been noted, with the figure plummeting to 7.1 million hectares in subsequent years. Concurrently, the total rice production in 2020 was recorded at approximately 54.65 million tons, reflecting a marginal increase of 45.17 thousand tons (0.08 percent) compared to the previous year. Although a modest annual increase in crop productivity was observed, the yield of 5.2 tons/ha is still considered low.
Rice cultivation plays a pivotal role in fulfilling food demands in Indonesia. In the pursuit of enhancing productivity and rice yields, the utilization of bioactivators has become a focal point of research. Bioactivators are substances that influence plant growth and soil properties through beneficial microbial activities. However, specific research addressing the effects of varying bioactivator application rates on the growth, harvest yields, and soil properties of two rice varieties in Indonesia remains limited.
Farmers grapple with challenges beyond the selection of superior rice varieties, encompassing soil fertility issues and pest invasions. The common recourse to these predicaments has been the use of chemical fertilizers and pesticides, which, while boosting production and curbing pest attacks, can, in the long term, detrimentally affect soil fertility both physically and chemically, and also biologically [1, 2]. Additionally, plant resistance remains insufficient as the nutrient supply predominantly consists of macro minerals, whereas plants require micro minerals for secondary metabolism, necessary for the production of active compounds that shield plants from pests and diseases.
In light of these challenges, biofertilizers have emerged as a potential solution to enhance rice productivity [3-8]. Bioactivators, a type of biofertilizer, have been found to improve soil quality and promote plant growth and yield through mechanisms such as nutrient release, phytohormone production, and alleviation of biotic and abiotic stress [9]. These bioactivators harbor active ingredients including lignolytic, cellulosic, phosphate and potassium solvents, phytate decomposers, tannins, and lignins, as well as decomposers of organochlorine, organophosphate and carbamate pesticides. Many bacteria can coexist and establish mutualistic relationships that benefit both the soil and plant [10-14]. Thus, the utilization of complex-based biological fertilizers is anticipated to enhance soil quality and stimulate rice growth [15]. In this study, two popular rice varieties in Indonesia, Inpari 32 and IR 64, were chosen.
Despite existing studies on the application of bioactivators in agriculture, a knowledge gap persists concerning the effects of different bioactivator application rates on the growth, yield, and soil properties of specific rice varieties, especially within the Indonesian agricultural context. In addition, there is limited research explicitly examining the implications of bioactivator treatments on the physical, chemical, and biological attributes of soil in relation to rice cultivation.
In response to the increasing food demand and the necessity of maximizing agricultural productivity, this study aims to bridge the aforementioned knowledge gaps. Through the exploration of the impacts of varying bioactivator dosages on the growth and quality of two rice varieties (Oryza sativa L.) harvests, and their effects on soil quality, this research seeks to provide a more comprehensive understanding of the interplay between bioactivators and soil, and how this can shape an optimal environment for rice cultivation. By offering novel insights into efforts aimed at boosting agricultural productivity and environmental sustainability in Indonesia, this study can provide practical guidance to farmers in selecting optimal bioactivator dosages to enhance rice growth and yields, while concurrently preserving soil health and fertility.
This experiment was conducted in Sumberpucung, Malang, East Java, Indonesia. The bioactivator used in this study was commersiallized bioactivator namely Mobilin (produced by CV. Agro Gemilang, Indonesia) which is contains bacteria consortium (10 cfu) categorized as lignolitic, cellulolitic, nutrients (phosphorus and potassium) solubilizing bacteria, and pesticide (organochlorin, organophosphate, and carbamate) solubilizing bacteria; macro- and micro- nutrients; and active compound such as terpenoid and alkaloid.
2.1 Experimental design
This research was carried out using a nested factorial design with two factors, i.e., bioactivator application dose and rice variety. The first factor was application of several bioactivator dose which applied two weeks before plowing (BP) or two days after plowing (AP) and two controls, i.e., inorganic fertilizer (IF/P7) (Urea, SP 36, and KCl with dose of 45 kg N/ha, 72 kg P2O5/ha, and 45 kg K2O/ha) and organic fertilizer (OF/P8) (manure with dose of 20 kg/ha). There were three bioactivator dose, i.e., 10, 20, and 30 ml/l (equal to 2.8 l/ha, 5.6 l/ha, and 8.4 l/ha, respectively). The treatments were namely P1 and P2 with dose of 10 ml/l, P3 and P4 with dose of 20 ml/l, and P5 and P6 with dose of 30 ml/l which was applied before (P2, P4, and P6) or after (P1, P3, and P5) plowing. The second factor was two local rice varieties namely Inpari 32 and IR 64. So, the treatment combination was 16 and repeated 4 times.
2.2 Observed variables
The observed variables consisted of soil chemical properties (determined before (Table 1) and after treatments), growth and yield components of rice. The chemical soil properties included pH, soil organic carbon (%), total nitrogen (%), P2O5 (mg/100 g), and K2O (mg/100 g). The growth variables observed were plant height, clump diameter, number of tillers per clump, root length, plant fresh weight and plant dry weight (biomass). The yield and its related component of paddy variables were potential yield (ton/ha; multiply the weight grain harvest per clump by expected clump number, e.g., 88), yield (ton/ha; actual yield of grain harvest), number of grains per panicle, number of filled grains, number of empty grains, filled grains (%), empty grains (%), and length of panicle (cm).
Table 1. Soil chemical properties before treatments
|
Soil Chemical Properties |
Analysis Method |
Value ± SD |
|
pH |
H2O (1:5) KCl (1:5) Electrometry (pH Meter) |
6.74±0.23 5.29±0.21 |
|
Organic C (%) |
Walkley & Black; Spectrophotometer |
3.10±0.19 |
|
Total N (%) |
Kjeldahl; Titrimetric |
0.35±0.03 |
|
P2O5 (mg/100 g) |
HCl 25%; Spectrophotometer |
47.88±9.06 |
|
K2O (mg/100 g) |
HCl 25%; Spectrophotometer |
87.38±9.64 |
2.3 Data analysis
Data analysis used analysis of variance (ANOVA), if it had a significant effect, it was continued with the further test of HSD (Tukey) with a level of 5% to compare the effect of each treatment. The software used to start from entering raw data and processing raw data is Microsoft Excel.
Figure 1. Plant height of two rice varieties under different bioactivator treatment
The Inpari 32 variety with a dose of 30 ml/l of bioactivator after plowing showed the best response to plant height (Figure 1), although at weeks 10 to 13 the treatment of the IR 64 control variety of manure showed the highest response to plant height, but it was still not significantly different from the response given by the variety. Inpari 32 dose of 30 ml/l after plowing.
The response of the clump diameter of inpari 32 and IR 64 varieties was influenced by the high number of tillers in the control treatment of manure (OF/P8), so that the diameter of the clump was also high (Table 2 and Table 3). The application of organic fertilizer made from chicken manure had a good effect on the number of tillers per clump in the treatment of manure, the content of chicken manure which contains potassium and phosphate nutrients is quite high. Nutrient K has an important role in the process of opening and closing stomata in plants, so that the process of entering and leaving carbon dioxide is also affected, with the entry of carbon dioxide smoothly, it is able to launch the photosynthesis process. affects the process of energy absorption from sunlight which functions in the photosynthesis process, due to the smooth process of photosynthesis, the energy produced also becomes a lot and helps plants to do cell division for the process of forming new tillers [16]. It can also be seen in the results of soil analysis that there was an increase in P2O5 in the P8 treatment.
Table 2. Clump diameter of two paddy varieties under different fertilizer treatment
|
Treatment |
5 WAP |
7 WAP |
9 WAP |
11 WAP |
13 WAP |
|
Inpari 32 |
|||||
|
10 AP |
26.83 a |
57.69 cd |
56.93 de |
53.68 b |
51.04 ab |
|
10 BP |
27.58 a |
59.70 cd |
54.10 abcd |
52.00 ab |
49.46 ab |
|
20 AP |
29.50 a |
60.92 d |
56.64 cde |
54.38 b |
51.80 ab |
|
20 BP |
27.79 a |
59.40 cd |
55.45 bcde |
54.08 b |
51.28 ab |
|
30 AP |
30.92 a |
58.45 cd |
55.98 bcde |
54.36 b |
51.11 ab |
|
30 BP |
24.08 a |
52.23 abcd |
51.37 abc |
52.63 ab |
50.43 ab |
|
IF |
38.31 b |
48.40 ab |
49.82 a |
50.88 ab |
50.88 ab |
|
OF |
39.20 bc |
48.23 a |
50.51 ab |
50.95 ab |
52.00 ab |
|
IR 64 |
|||||
|
10 AP |
42.95 bcde |
56.99 abcd |
53.15 abcd |
54.50 b |
54.50 b |
|
10 BP |
41.13 bcd |
53.83 abcd |
52.42 abcd |
52.77 ab |
52.77 ab |
|
20 AP |
45.87 cde |
52.69 abcd |
53.09 abcd |
46.73 a |
46.73 a |
|
20 BP |
47.18 de |
59.49 cd |
53.80 abcd |
49.65 ab |
49.65 ab |
|
30 AP |
46.52 cde |
58.20 cd |
57.43 de |
51.77 ab |
51.77 ab |
|
30 BP |
45.23 bcde |
57.63 bcd |
55.82 bcde |
51.59 ab |
51.59 ab |
|
IF |
44.53 bcde |
51.02 abc |
56.41 cde |
64.46 c |
67.13 c |
|
OF |
48.59 e |
54.83 abcd |
60.37 e |
69.37 c |
72.21 c |
|
HSD α 5% |
7.36 |
9.28 |
5.51 |
6.86 |
6.78 |
Note: Numbers followed by the same letter in the same column and treatment are not significantly different based on the HSD test at 5% level, WAP = week after planting. AP: after plowing, BP: before plowing, IF: inorganic fertilizer, OF: organic fertilizer.
Table 3. Number of tillers per clump of two rice varieties under different fertilizer treatment
|
Treatment |
5 WAP |
7 WAP |
9 WAP |
11 WAP |
13 WAP |
|||||
|
Inpari 32 |
||||||||||
|
10 AP |
28.29 |
ab |
45.88 |
cdef |
47.83 |
def |
44.58 |
c |
41.04 |
ef |
|
10 BP |
29.54 |
ab |
48.42 |
f |
44.92 |
cde |
41.50 |
c |
38.33 |
bcdef |
|
20 AP |
30.50 |
ab |
47.38 |
ef |
47.08 |
def |
43.42 |
c |
40.13 |
def |
|
20 BP |
28.96 |
ab |
46.75 |
def |
45.08 |
cde |
42.25 |
c |
39.25 |
cdef |
|
30 AP |
30.79 |
ab |
46.13 |
cdef |
43.88 |
cd |
40.67 |
bc |
37.58 |
bcdef |
|
30 BP |
23.13 |
a |
39.46 |
abcd |
43.38 |
cd |
39.83 |
bc |
37.42 |
bcde |
|
IF |
45.54 |
d |
49.54 |
f |
51.04 |
ef |
51.58 |
d |
51.71 |
g |
|
OF |
47.67 |
d |
50.50 |
f |
52.13 |
f |
52.00 |
d |
52.00 |
g |
|
IR 64 |
||||||||||
|
10 AP |
32.41 |
b |
35.71 |
ab |
32.27 |
a |
32.27 |
a |
32.27 |
ab |
|
10 BP |
32.46 |
b |
32.29 |
a |
30.88 |
a |
30.88 |
a |
30.88 |
a |
|
20 AP |
32.83 |
b |
34.54 |
ab |
32.50 |
a |
32.50 |
a |
32.50 |
ab |
|
20 BP |
31.92 |
b |
38.33 |
abc |
34.46 |
ab |
34.46 |
ab |
34.46 |
abcd |
|
30 AP |
32.33 |
b |
37.21 |
ab |
33.08 |
a |
33.08 |
a |
33.08 |
abc |
|
30 BP |
29.50 |
ab |
35.50 |
ab |
30.83 |
a |
30.83 |
a |
30.83 |
a |
|
IF |
33.71 |
bc |
40.46 |
bcde |
39.92 |
bc |
39.92 |
bc |
39.92 |
def |
|
OF |
41.46 |
cd |
47.54 |
ef |
44.00 |
cd |
44.00 |
c |
44.00 |
f |
|
HSD α 5% |
7.92 |
|
7.87 |
|
6.69 |
|
6.67 |
|
6.48 |
|
Note: Numbers followed by the same letter in the same column and treatment are not significantly different based on the HSD test at 5% level, WAP = week after planting. AP: after plowing, BP: before plowing, IF: inorganic fertilizer, OF: organic fertilizer.
According to the study [17], the bigger biomass or canopy above ground, the higher photosynthate produce will be and so do yield components. The number of panicles per clump can be determined based on the vegetative phase. During the vegetative period, if the number of tillers in a cump excess the optimum value, it will negatively correlate with productive tillers. This is caused by soil fertility factors that affect the number of productive tillers, and have an impact on the photosynthesis process in which affect the number of tillers per clump in rice plants.
Application of bioactivator at a dose of 20 ml/l before plowing in both varieties showed the highest effect on the response of root length, plant wet weight and plant dry weight (Table 4). The addition of a dose of more than 20 ml/l tends to cause a decrease in root length, wet weight and dry weight of the plant. This can be due to the available nutrients are very readily available. The dose of 20 ml/l is thought to be the optimum point for giving the dose of bioactivator. In line with the previos research, the dose of biological fertilizers at 20 g/plot on all types of organic fertilizers showed the best results on the wet weight of the canopy, but tended to decrease when the dose of biological fertilizers was increased to 30 g/plot. Root length, wet weight and dry weight of plants are strongly influenced by the elements of N, P and K and water content. There is an increase in biomass because at that concentration plants absorb more water and nutrients, nutrients stimulate the development of organs in plants such as roots, so that plants can absorb more nutrients and water, then photosynthetic activity will increase and affect the increase in wet weight and dry weight of plants.
Table 4. Root length, biomass fresh weight, and biomass dry weight of two paddy varieties under different fertilizer treatment at the end of observation
|
Treatment |
Root Length (cm) |
Fresh Weight of Biomass (g) |
Dry Weight of Biomass (g) |
|||
|
Inpari 32 |
||||||
|
10 AP |
23.06 |
bc |
268.75 |
abc |
61.33 |
b |
|
10 BP |
23.73 |
c |
255.00 |
abc |
61.25 |
b |
|
20 AP |
22.46 |
abc |
272.09 |
abc |
72.59 |
b |
|
20 BP |
21.49 |
abc |
281.67 |
abc |
74.59 |
b |
|
30 AP |
19.01 |
abc |
234.17 |
ab |
61.08 |
b |
|
30 BP |
18.04 |
a |
241.25 |
abc |
62.34 |
b |
|
IF |
20.67 |
abc |
214.17 |
ab |
30.84 |
a |
|
OF |
22.00 |
abc |
208.34 |
a |
29.33 |
a |
|
IR 64 |
||||||
|
10 AP |
18.56 |
ab |
290.83 |
abc |
70.70 |
b |
|
10 BP |
20.54 |
abc |
205.42 |
a |
59.30 |
b |
|
20 AP |
21.20 |
abc |
247.08 |
abc |
66.75 |
b |
|
20 BP |
19.68 |
abc |
325.42 |
c |
72.50 |
b |
|
30 AP |
18.67 |
ab |
302.08 |
bc |
66.50 |
b |
|
30 BP |
19.38 |
abc |
254.17 |
abc |
67.17 |
b |
|
IF |
20.42 |
abc |
265.00 |
abc |
34.58 |
a |
|
OF |
19.75 |
abc |
248.75 |
abc |
25.00 |
a |
|
HSD α 5% |
4.91 |
|
90.18 |
|
16.75 |
|
Note: Numbers followed by the same letter in the same column and treatment are not significantly different based on the HSD test at 5% level, WAP = week after planting. AP: after plowing, BP: before plowing, IF: inorganic fertilizer, OF: organic fertilizer.
The application of NPK fertilizer which is easily absorbed by plants has an effect on the generative phase of plants (Table 5 and Figure 2), on average the NPK control treatment was able to give better results than other treatments, because the nutrients N, P, and K provided were able to support plants in the generative phase. Nitrogen fertilizer is one of the most important factors that influence rice grain quality [18-25]. Furthermore, sufficient nitrogen rate remarkably increased grain yield and quality [26]. Beside nitrogen, phosphorus has important role as energy storage and transfer within plant [27]. Phosphate has a function in transporting energy from the results of plant metabolism, stimulating root growth, flowering, seed formation and cell division; Potassium has a function in the photosynthesis process, transporting products from assimilation, water, minerals and enzymes, able to increase plant immunity to disease, and Nitrogen has a function in stimulating growth in plants to synthesize amino acids and proteins in plants [19, 28-31].
Table 5. Yield components of two paddy varieties under different fertilizer treatment
|
Treatment |
Length of Panicle (cm) |
Number of Grains per Panicle |
Number of Filled Grains |
Number of Empty Grains |
|
Inpari 32 |
||||
|
10 AP |
20.31 a |
131.56 abc |
109.67 cdef |
21.89 a |
|
10 BP |
20.84 ab |
136.83 abc |
114.64 def |
22.19 a |
|
20 AP |
20.48 a |
136.53 abc |
113.17 def |
23.36 a |
|
20 BP |
21.15 ab |
129.53 abc |
105.86 bcdef |
23.67 a |
|
30 AP |
20.89 ab |
115.64 a |
94.44 abcd |
21.20 a |
|
30 BP |
21.11 ab |
127.22 abc |
103.39 abcde |
23.83 a |
|
IF |
22.56 bcd |
143.00 bc |
123.47 ef |
19.53 a |
|
OF |
20.25 a |
130.75 abc |
111.67 cdef |
19.08 a |
|
IR 64 |
||||
|
10 AP |
24.56 d |
130.17 abc |
86.67 ab |
43.50 bc |
|
10 BP |
24.28 d |
126.67 abc |
81.67 a |
45.00 bc |
|
20 AP |
24.39 d |
125.08 ab |
93.25 abcd |
31.83 ab |
|
20 BP |
23.32 cd |
145.25 bc |
102.83 abcde |
42.42 bc |
|
30 AP |
24.24 cd |
145.92 bc |
89.33 abc |
56.42 c |
|
30 BP |
23.80 cd |
144.17 bc |
99.33 abcd |
44.83 bc |
|
IF |
23.37 cd |
149.33 c |
127.42 f |
21.92 a |
|
OF |
22.22 abc |
129.00 abc |
110.42 cdef |
18.58 a |
|
HSD α 5% |
2.01 |
23.49 |
22.91 |
15.99 |
Note: Numbers followed by the same letter in the same column and treatment are not significantly different based on the HSD test at 5% level, WAP = week after planting. AP: after plowing, BP: before plowing, IF: inorganic fertilizer, OF: organic fertilizer.
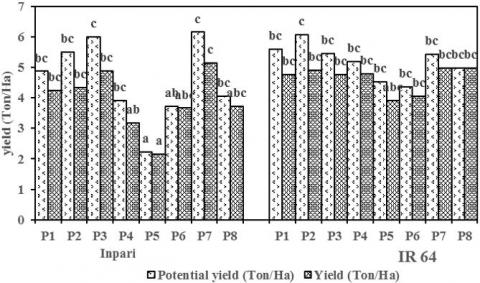
Figure 2. Yield variables of two paddy varieties under different fertilizer treatment
The results of soil analysis showed an increase in P2O5 in the NPK control treatment so that during the ripening phase the rice got sufficient nutrients and the percentage of grain containing it became high. It will affect the yield components. The correlation between yield components of rice is widely studied [32, 33]. It was reported that several yield components of rice have significant correlation and can be used as selection criteria for improving grain yield [34]. Panicle length has an effect on the number of grains per panicle, the number of filled grains, and the percentage of filled grains. An increase in panicle length is able to support an increase in the number of grains, because the longer a panicle is, the biomass in the plant increases, which in turn will increase the number of filled grains per panicle. The high yield of grain containing per panicle affects the dry grain weight. The growth of the number of panicles on rice plants will affect the yield of dry grain production at different densities. This is in line with the statement of study [19] which said that the greater the weight of the dry grain harvested, the higher the productivity.
The results of soil analysis (Table 6) showed that the bioactivator treatment on average was able to increase the C-Organic number in the soil and was able to maintain soil pH in a near neutral condition. The synthesized soil microbes were able to attach soil grains into soil aggregates. The roles of organic matter in soil fertility are (1) mineralized organic matter which will release the nutrients needed by plants completely, but in relatively small amounts, (2) increase the ability of the soil to hold water so that it can provide more water (3) the life of microorganisms the soil becomes better.
Table 6. Soil chemical properties under different fertilizer treatment
|
Treatment |
pHH2O |
pHKCl |
Organic C |
Total N |
P2O5 |
K2O |
|
Inorganic fertilizer |
6.50 |
5.10 |
2.84 a |
0.32 a |
58.25 b |
82.25 c |
|
Organic fertilizer |
6.60 |
4.90 |
3.20 a |
0.34 a |
63.25 c |
85.50 c |
|
P1 |
7.00 |
5.68 |
3.40 b* |
0.36 a |
67.00 c |
70.00 c |
|
P2 |
6.98 |
5.58 |
3.40 b |
0.35 a |
53.75 b |
67.75 c |
|
P3 |
7.05 |
5.60 |
3.37 b* |
0.48 a |
56.50 b |
84.00 c |
|
P4 |
7.00 |
5.80* |
3.30 b |
0.25 a |
46.75 b |
85.25 c |
|
P5 |
6.65 |
5.53 |
3.32 b |
0.36 a |
112.25 c |
102.50 c |
|
P6 |
6.48 |
5.33 |
2.97 a |
0.33 a |
68.75 c |
100.50 c |
Notes: P1 (10 ml/l, after plowing); P2 (10 ml/l, before plowing); P3 (20 ml/l, after plowing); P4 (20 ml/l, before plowing); P5 (30 ml/l, after plowing); P6 (30 ml/l, before plowing). * Significantly different based on before-after analysis (paired t-test α 5%).
The results of soil N-Total analysis in plot P4 decreased from high to medium. There are several factors that affect the uptake of N and P in plants, namely the time of application in the rainy season which can affect the availability of N and P in plants. This is what causes even though at a dose of 20 ml before plowing the number of filled grains per panicle is high, the percentage of empty grain is also high so that the yield is low. Plant growth at a dose of 30 ml after and before plowing went well, but during the generative phase, plots P5 and P6 were still waterlogged so that plant growth was hampered. Flooded rice fields have anaerobic conditions so that nutrients in the soil cannot be absorbed optimally.
The results of the soil analysis showed that the 30 ml dose plots after and before the plow, the available K2O tended to be more than the others, this was because the land in waterlogged conditions was able to increase the availability of Kexchangable because in flooded land the redox potential of the soil decreased, so the solubility of Fe2+ and Mn2+ increase, these cations can replace the adsorbed K so that K is released into the soil solution.
Varieties and application of bioactivator significantly affected plant height, clump diameter, number of tillers per clump, root length, wet and dry weight of plants, yield and soil properties. The control treatment of inorganic and organic fertilizer showed better perfomance on clump diameter and number of tillers but application of bioactivator produced longer root and higher biomass on both rice varieties. The application of 10 ml dose of bioactivator before plowing on the Inpari 32 variety was able to affect the dry weight and fresh weight of the plant better than the control and other treatments. Application of bioactivator with a concentration of 20 ml/l after plowing was able to increase soil water content, C-organic and P2O5 potential also maintain the soil reaction near to netral than control.
In an effort to enhance the efficiency and sustainability of rice production, several recommendations and areas of research need to be considered. Firstly, further research is necessary regarding the optimal dosage and timing of bioactivator application for various rice varieties in order to maximize growth and harvest yields. Additionally, evaluating the long-term effects of bioactivator application on soil health is crucial for understanding its impact on soil structure, soil microbial biodiversity, and agricultural productivity over an extended period.
Economic aspects should also be taken into account through comprehensive analyses, including application costs and the potential for increased yields resulting from bioactivator use. Further studies on the interaction of bioactivators with other agricultural inputs, such as pesticides or chemical fertilizers, will provide insights into the best ways to optimize their combined use. Continued development of more effective and environmentally friendly bioactivator formulas is also essential, with a focus on enhancing efficiency and positive environmental impact. Through research and the implementation of these recommendations, it is hoped that agriculture can become more sustainable, yielding improved harvests, while safeguarding soil health and fertility for the future.
Financial support from KEMENDIKBUDRISTEK (The Ministry of Education, Culture, Research, and Technology) for this research was gratefully acknowledge.
[1] Booth, C.A., Baksiene, E., Fullen, M.A., Ciunys, A. (2007). Long-term agrochemical dynamics: Engineering, application and challenges of calcareous sapropel as a soil fertilizer. International Journal of Ecodynamics, 2(2): 108-116. https://doi.org/10.2495/ECO-V2-N2-108-116
[2] Priyadi, R., Juhaeni, A.H., Meylani, V., Fudholi, A. (2022). The development of inorganic fertilizer and bio-fertilizer combination and the effectiveness of application on the growth and production of red chili. International Journal of Design and Nature and Ecodynamics, 17(1): 87-93. https://doi.org/10.18280/ijdne.170111
[3] Ye, L., Zhao, X., Bao, E., Li, J., Zou, Z., Cao, K. (2020). Bio-organic fertilizer with reduced rates of chemical fertilization improves soil fertility and enhances tomato yield and quality. Scientific Reports, 10(1): 177. https://doi.org/10.1038/s41598-019-56954-2
[4] Pangnakorn, U., Watanasorn, S., Kuntha, C., Chuenchooklin, S. (2009). Application of wood vinegar to fermented liquid bio-fertilizer for organic agriculture on soybean. Asian Journal of Food and Agro-Industry, 189-196.
[5] Mahdi, S.S., Hassan, G.I., Samoon, S.A., Rather, H.A., Dar, S.A., Zehra, B. (2010). Bio-fertilizers in organic agriculture. Journal of Phytology, 2(10): 42-54.
[6] Syed, S., Wang, X., Prasad, T.N.V.K.V., Lian, B. (2021). Bio‐organic mineral fertilizer for sustainable agriculture: Current trends and future perspectives. Minerals, 11(12): 1336. https://doi.org/10.3390/min11121336
[7] Nandan, D. (2021). A review paper on bio fertilizers and organic agriculture. ACADEMICIA: An International Multidisciplinary Research Journal, 11(10): 728-736. https://doi.org/10.5958/2249-7137.2021.02168.6
[8] Mishra, D., Rajvir, S., Mishra, U., Kumar, S.S. (2013). Role of bio-fertilizer in organic agriculture: A review. Research Journal of Recent Sciences, 2: 39-41.
[9] Santos-Raga, G., Santoyo, E., Guevara, M., Almirudis, E., Pérez-Zárate, D., Yáñez-Dávila, D. (2021). Tracking geochemical signatures of rare earth and trace elements in spring waters and outcropping rocks from the hidden geothermal system of Acoculco, Puebla (Mexico). Journal of Geochemical Exploration, 227: 106798. https://doi.org/10.1016/j.gexplo.2021.106798
[10] Olanrewaju, O.S., Babalola, O.O. (2019). Bacterial consortium for improved maize (Zea mays L.) production. Microorganisms, 7(11): 519. https://doi.org/10.3390/microorganisms7110519
[11] Aota, Y., Nakajima, H. (2001). Mutualistic relationships between phytoplankton and bacteria caused by carbon excretion from phytoplankton. Ecological Research, 16(2): 289-299. https://doi.org/10.1046/j.1440-1703.2001.00396.x
[12] Shkoporov, A.N., Turkington, C.J., Hill, C. (2022). Mutualistic interplay between bacteriophages and bacteria in the human gut. Nature Reviews Microbiology, 20: 737-749. https://doi.org/10.1038/s41579-022-00755-4
[13] Fischer, C.Y., Lognay, G.C., Detrain, C., Heil, M., Grigorescu, A., Sabri, A., Thonart, P., Haubruge, E., Verheggen, F.J. (2015). Bacteria may enhance species association in an ant–aphid mutualistic relationship. Chemoecology, 25: 223-232. https://doi.org/10.1007/s00049-015-0188-3
[14] Yao, S., Lyu, S., An, Y., Lu, J., Gjermansen, C., Schramm, A. (2019). Microalgae–bacteria symbiosis in microalgal growth and biofuel production: A review. Journal of Applied Microbiology, 126(2): 359-368. https://doi.org/10.1111/jam.14095
[15] Fukami, J., Nogueira, M.A., Araujo, R.S., Hungria, M. (2016). Accessing inoculation methods of maize and wheat with Azospirillum brasilense. AMB Express, 6. https://doi.org/10.1186/s13568-015-0171-y
[16] Masle, J. (2000). The effects of elevated CO2 concentrations on cell division rates, growth patterns, and blade anatomy in young wheat plants are modulated by factors related to leaf position, vernalization, and genotype. Plant Physiology, 122(4): 1399-1416. https://doi.org/10.1104/pp.122.4.1399
[17] Muazam, A., Praptana, R.H. (2021). Correlation of phenotype components with yield of promising tungro resistant superior rice lines. IOP Conference Series: Earth and Environmental Science, 756: 012002. https://doi.org/10.1088/1755-1315/756/1/012002
[18] Xu, Y., Guan, X., Han, Z., Zhou, L., Zhang, Y., Asad, M. A.U., Wang, Z., Jin, R., Pan, G., Cheng, F. (2022). Combined effect of nitrogen fertilizer application and high temperature on grain quality properties of cooked rice. Frontiers in Plant Science, 13. https://doi.org/10.3389/fpls.2022.874033
[19] Hien, N.T., van Toan, P., Choudhury, A.T.M.A., Rose, M.T., Roughley, R.J., Kennedy, I.R. (2014). Field application strategies for the inoculant biofertilizer biogro supplementing fertilizer nitrogen application in rice production. Journal of Plant Nutrition, 37(11): 1837-1858. https://doi.org/10.1080/01904167.2014.911320
[20] Son, T.T.N., Thu, V.V., Man, L.H., Hiraoka, H. (2001). Effect of organic and biofertilizer on quality, grain yield and soil properties of soybean under rice based cropping system. Omonrice, 9: 55-61.
[21] El-Sheref, E.E.M., Ganem, S.A., Sorour, S.G.R., Zedan, A. (2007). Rice production under organic and inorganic fertilization. Journal of Plant Production, 32(3): 1611-1626. https://doi.org/10.21608/jpp.2007.206168
[22] Saidu, A., Abayomi, Y.A., Aduloju, M.O. (2012). Evaluation of complementary use organic and inorganic fertilizers on the performance of upland rice (Oryza sativa L.). International Journal of Advanced Biological Research, 2(3).
[23] Baruah, A., Baruah, K.K. (2015). Organic manures and crop residues as fertilizer substitutes: Impact on nitrous oxide emission, plant growth and grain yield in pre-monsoon rice cropping system. Journal of Environmental Protection, 6(07): 755. https://doi.org/10.4236/jep.2015.67069
[24] Randhawa, J.S., Sharma, R., Chhina, G.S., Kaur, M. (2020). Effect of integrated nutrient management on productivity and quality of malt barley (Hordeum distichon L.). Agricultural Science Digest-A Research Journal, 40(3): 265-269. https://doi.org/10.18805/ag.D-4980
[25] Kakar, K., Xuan, T.D., Noori, Z., Aryan, S., Gulab, G. (2020). Effects of organic and inorganic fertilizer application on growth, yield, and grain quality of rice. Agriculture, 10(11). https://doi.org/10.3390/agriculture10110544
[26] Liang, H., Gao, S., Ma, J., Zhang, T., Wang, T., Zhang, S., Wu, Z. (2021). Effect of nitrogen application rates on the nitrogen utilization, yield and quality of rice. Food and Nutrition Sciences, 12(1). https://doi.org/10.4236/fns.2021.121002
[27] Badawi, M., Seadh, S., Naeem, E., El-Iraqi, A. (2017). Effect of phosphorus fertilizer levels on productivity and grains quality of some rice cultivars. Journal of Plant Production, 8(3): 411-415. https://doi.org/10.21608/jpp.2017.39996
[28] Yang, S., Liu, W., Guo, L., Wang, C., Deng, M., Peng, Z., Liu, L. (2022). The changes in plant and soil C pools and their C:N stoichiometry control grassland N retention under elevated N inputs. Ecological Applications, 32(2). https://doi.org/10.1002/eap.2517
[29] Demarco, J., MacK, M.C., Bret-Harte, M.S., Burton, M., Shaver, G.R. (2014). Long-term experimental warming and nutrient additions increase productivity in tall deciduous shrub tundra. Ecosphere, 5(6): 1-22. https://doi.org/10.1890/ES13-00281.1
[30] Bala, K., Sood, A., Pathania, V.S., Thakur, S. (2018). Effect of plant nutrition in insect pest management: A review. Journal of Pharmacognosy and Phytochemistry, 7(4): 2737-2742.
[31] Guan, B., Xie, B., Yang, S., Hou, A., Chen, M., Han, G. (2019). Effects of five years’ nitrogen deposition on soil properties and plant growth in a salinized reed wetland of the Yellow River Delta. Ecological Engineering, 136: 160-166. https://doi.org/10.1016/j.ecoleng.2019.06.016
[32] Li, R., Li, M., Ashraf, U., Liu, S., Zhang, J. (2019). Exploring the relationships between yield and yield-related traits for rice varieties released in China from 1978 to 2017. Frontiers in Plant Science, 10. https://doi.org/10.3389/fpls.2019.00543
[33] Kishore, N., Srinivas, T., Nagabhushanam, U., Pallavi, M., Sameera, S. (2015). Genetic variability, correlation and path analysis for yield and yield components in promising rice (Oryza sativa L.) genotypes. SAARC Journal of Agriculture, 13(1). https://doi.org/10.3329/sja.v13i1.24184
[34] Oladosu, Y., Rafii, M.Y., Magaji, U., Abdullah, N., Miah, G., Chukwu, S.C., Hussin, G., Ramli, A., Kareem, I. (2018). Genotypic and phenotypic relationship among yield components in rice under tropical conditions. BioMed Research International, 8936767. https://doi.org/10.1155/2018/8936767