Aris Munandar![]() | Sri Mulyati
| Sri Mulyati![]() | Hasanuddin
| Hasanuddin![]() | Zulfahrizal*
| Zulfahrizal*![]()
© 2023 IIETA. This article is published by IIETA and is licensed under the CC BY 4.0 license (http://creativecommons.org/licenses/by/4.0/).
OPEN ACCESS
Indonesia, a leading supplier of patchouli oil globally, produces a significant proportion of this high-value commodity in Aceh. Given the high economic value of patchouli oil, adulteration practices with less expensive oils, such as palm, gurjun, and turpentine oil, are commonplace. These adulterations not only degrade the quality of the oil but also pose potential safety risks, health hazards, and non-compliance with natural attributes. Among the adulterants, gurjun oil is frequently used due to its blendability and similarity in color and aroma to patchouli oil. This study was designed to develop a quantification model to estimate the gurjun oil content adulterating Aceh patchouli oil. The model employed near-infrared reflectance spectroscopy (NIRS) technology in combination with multivariate analysis methods, specifically principal component regression (PCR) and partial least squares (PLS) regression. To enhance the accuracy level of the NIRS calibration model, mean normalization (MN) and de-trending (DT) spectrum pretreatments were applied. The findings indicate that the application of NIRS technology coupled with multivariate analysis can effectively address the issue of gurjun oil adulteration in patchouli oil. Moreover, the PLS calibration method was shown to outperform PCR. The residual predictive deviation (RPD) index for the PLS model was found to be 2.34, compared to 1.85 for the PCR model. Spectrum pretreatments successfully enhanced the performance of the model, with calibration RPD indices for the PLS-MN and PLS-DT models registering at 2.98 and 2.59, respectively. In general, both models were deemed viable for application as the PLS-MN and PLS-DT models, after validation, yielded range to error ratio (RER) values of 3.39 and 3.60, respectively. Thus, this study underscores the potential of employing NIRS technology and multivariate analysis to combat the prevalent issue of patchouli oil adulteration.
patchouli oil, gurjun oil, NIRS, PCR, PLS
Indonesia, accounting for approximately 90% of the world's patchouli oil supply, is a dominant player in this industry [1]. Patchouli oil, primarily sourced from the tropical regions of Southeast Asia including Indonesia and the Philippines, holds promising prospects and favorable prices in the international market. However, the high demand and economic value associated with patchouli oil inevitably led to fraudulent practices, such as adulteration with cheaper oils [2].
Adulteration of patchouli oil, a long-standing issue, can occur at two stages: pre-distillation, through the addition of foreign materials to original patchouli leaves, or post-distillation, by diluting the oil with various substances [3]. To achieve economic viability, adulteration requires the addition of at least 20% foreign substances, resulting in significant alterations in physical parameters, constituents, and/or odor [3]. Historical records highlight gurjun oil, an oleoresin derived from Dipterocarpus species, Dipterocarpaceae, native to Southeast Asian forests, as a common adulterant in patchouli oil [4].
Currently, gas chromatography-mass spectroscopy (GC-MS) is the standard method for analyzing patchouli oil content. Nevertheless, its complexity and prohibitive cost render it inaccessible for small and medium enterprises (SMEs) [5, 6]. Therefore, alternative methods that are fast, efficient, simple, and cost-effective are needed. One such method under development is near-infrared reflectance spectroscopy (NIRS) technology, characterized by simple sample preparation, swift prediction processes, non-destructive material handling, and environmental friendliness [7-9].
NIRS technology utilizes an instrument that identifies specific chemical components in agricultural products based on vibrations and overtones in molecular bond groups such as O–H, C–H–O, C–O, etc. The spectral pattern of each bond group provides varying levels of information, contingent upon the chemical makeup, cellular structure, and physical properties of the materials. In scanning objects with NIRS and infrared frequencies, the response of chemical bonds such as O–H, C–H, C–O, and N–H are captured in the NIR spectrum. These bonds experience shifts in vibrational energy as a result of the scanning process.
However, NIRS alone cannot unveil the chemical information in the spectra, necessitating the employment of multivariate analysis to extract data pertaining to the characteristics of the NIRS spectra [10]. Among multivariate analyses, two regression approaches commonly used for developing calibration models are principal component regression (PCR) and partial least squares (PLS) [11, 12]. While PLS seeks to establish the optimal correlation between the reference and infrared spectral data during the transformation into latent variables (LV) in the regression process, PCR only transforms the spectral data into LVs without involving the reference [11].
Previous studies have successfully applied NIRS technology for testing the quality of patchouli oil. These include characterization of the NIRS spectrum of patchouli oil and its classification based on the region of origin [13], prediction of patchouli oil content from various regions in Indonesia [8], rapid detection of adulterated patchouli oil in the form of crude oil [14], estimation of the authenticity of patchouli oil adulterated with coconut oil using principal component analysis (PCA) and linear discriminant analysis (LDA) methods [15], classification and prediction of patchouli oil (PA) quality, including PA content and refractive index [7], detection of patchouli oil adulteration with ethanol [1], and quick and precise prediction of PA content in Aceh patchouli oil using PLS and PCR methods [16].
Based on these findings, it is hypothesized that NIRS technology could be a viable tool for estimating the gurjun oil content in adulterated patchouli oil. Consequently, this study aims to develop a quantification model for estimating the gurjun oil content in Aceh patchouli oil using NIRS technology, coupled with multivariate analysis via PCR and PLS methods.
2.1 Sample preparation
The materials used in this study were patchouli oil (crude oil) and gurjun oil. These two oils were made into 30 treatments in various composition combinations with a mixing content of 0 to 100%. For the mixing process, the two oils are put into a 30 ml bottle according to the variation of the mixing. The levels of these two oils were measured using a micropipette in ml size which had been calibrated according to the percentage of each. Then stirred for 5 minutes using a magnetic stirrer at 3200 rpm to homogenize the mixture.
The model for estimating the gurjun oil content mixed in patchouli oil was developed based on the correlation of NIRS reflectance spectrum data with the gurjun oil content data resulting from the mixing treatment. Ideally, all samples should cover a homogeneous calibration range. 70% of the total sample is used for calibration, while 30% of the total sample is used for validation [2].
2.2 Spectrum data acquisition
The NIRS spectrum for patchouli oil samples was generated using the FT-NIR Thermo Nicolet Antaris TM II infrared spectroscopy instrument, with a workflow configuration built using the Integrated Thermo Operation® software. In this study, the instrument was set up with 32 scans, so as to obtain the diffuse reflectance spectrum of the sample, to minimize the effect of light scattering. Then save the scan results in two different file formats, namely *.SPA and *.CSV [7, 15, 16]. Patchouli oil sampling was carried out by placing a sample (20-30 ml) in a bottle, placed near the sensor for the scanning process.
2.3 Calibration models
The content of gurjun oil mixed in patchouli oil was estimated based on the NIRS spectrum generated through the model calibration process. The prediction model was built by regression between the NIRS spectrum (variable X) and gurjun oil content (variable Y) from the sample preparation results. Spectra of the same sample should be stored together and included in a calibration set or validation set. The spectrum with the lowest (minimum) and highest (maximum) levels should be selected for the calibration set. The purpose of calibration is to build a model of mathematical equations that can be used to predict the content of a material without having to make direct measurements that damage the material [2]. A set of calibrations constructs a regression model to try and elucidate the correlation among different datasets. The regression model is subsequently utilized to predict the values of the intended characteristic in an external validation set, replacing the conventional method [17].
The regression method used is PCR and PLS. Both of these regression methods are often used in the analysis of fats and oils [18]. Meanwhile, model validation was tested using the independent validation method. The calibration and validation models were built using The Unsclamber 10.3 software.
2.4 Spectrum pretreatment method
The NIRS reflectance spectrum data obtained usually still contains background and noise which causes the estimation model to be less accurate. This is influenced by the nature of scattering and absorption by a material. Interference can be reduced or partially eliminated with the help of appropriate spectrum pretreatment methods during processing. Spectral pretreatment is carried out with the aim of increasing the quality of the spectrum and reducing or eliminating unwanted effects on the spectrum data without affecting the spectroscopic information required for the prediction. Spectrum pretreatment is applied before calibration and validation is carried out [2].
The spectrum pretreatment methods used in this study were mean normalization (MN) and de-trending (DT). MN is a spectrum pretreatment method to remove irrelevant background information and normalize spectrum data [19]. DT become done the usage of a second-order polynomial in a regression analysis, wherein spectral values paintings as structured variables at the same time as the unbiased ones are given via way of means of the wavelengths, correcting outcomes because of baseline curva-ture [20]. MN and DT methods are commonly used in NIRS for pre-processing data before analysis. Both of these methods attempted to remove of baseline offset caused by instrument drift or other systematic errors.
2.5 Model assessment
The performance of the estimation model was evaluated based on the results of independent calibration and validation according to the correlation coefficient (r), root mean square error (RMSE), and residual predictive deviation (RPD) index. The RPD index is obtained by dividing the standard deviation (SD) of the reference data by the RMSE value. Furthermore, the number of latent variables (LV) required to develop an estimation model is also considered. An ideal and robust model should have a higher RPD coefficient and index, as well as a lower RMSE and less LV. Estimation performance for gurjun oil content is then systematically compared based on these statistical indicators [9, 11]. In addition, the range to error ratio (RER) is also used to evaluate model performance. RER is the range of reference engineering values with no predictive set for RMSEP. The RER value is obtained by calculating the division of the amplitude of the concentration of an analyte by the mean square error of calibration (RMSECV) [21].
Based on the results of the data validity test, all 30 data can be used. A summary of statistical descriptions for calibration and validation data from samples of gurjun oil content mixed with patchouli oil is presented in Table 1.
Table 1. Descriptive statistics of gurjun oil content characteristics
|
Descriptive Statistics |
Data Sets |
|
|
Calibration |
Validation |
|
|
Means |
47.04 |
48.60 |
|
Max |
100.00 |
84.60 |
|
Min |
0.00 |
13.80 |
|
Range |
100.00 |
70.80 |
|
Std Deviation |
31.04 |
24.41 |
|
Variances |
963.76 |
596.13 |
|
RMS |
55.95 |
53.78 |
|
Skewness |
0.09 |
0.02 |
|
kurtosis |
-1.10 |
-1.19 |
|
Median |
50.00 |
46.40 |
|
Q1 |
23.30 |
33.30 |
|
Q3 |
70.00 |
66.70 |
3.1 Spectra features
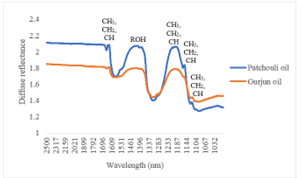
When a ray coming from a light source fall on a biological object, there will be an interaction between the object and the light where it will respond in the form of reflection, absorption and transmission. Figure 1 shows a typical NIRS diffuse reflectance spectrum for patchouli oil and gurjun oil samples. Based on Figure 1, it can be seen that a typical spectrum looks the same where each peak and valley on the spectrum indicates the presence of certain substances. This substance experiences vibrations in the near-infrared wavelength range in the form of overtones, bending, and stretching.
Figure 1 shows a typical spectrum of patchouli oil and gurjun oil. At first glance, the spectrum of these two oils is almost the same. This is in accordance with the results of the study by Cornwell [22] that said the spectral characteristics of patchouli oil and gurjun oil are very similar. But if you look closely, you will see the difference. The first peak indicates the presence of a long-wavelength ROH molecule 1400-1460. Both CH3, CH2, and CH molecules peak with different wavelengths 1630-1644, 1180-1200, 1150-1155 and 1115-1120 nm. Peak ROH and pinnacle CH3, CH2, and CH can be identified as PA content [7, 9, 23].
Figure 1. Spectrum of patchouli oil and gurjun oil
In the spectrum of gurjun oil, the CH3, CH2, and CH molecules can be suspected as caryophyllene content. While the peak of the ROH molecule can be suspected as the content of guaianic alcohol [3]. Study van Beek and Joulain., Cornwell [22] mentioned that if patchouli oil is mixed with gurjun oil it will produce a new compound in the form of allo-aromadendrene. Counterfeiting of patchouli oil with gurjun oil is difficult to detect unless using spectroscopic methods [24]. This is in accordance with the recommendations of Custódio and Veiga-Junior [4] who said spectroscopic methods are more appropriate for detecting essential oil adulteration. Obtained finds argue that NIRS can be employed to detect fraudulence and counterfeit in patchouli oil as also reported by previous studies.
Aanalyze the chemical composition of the sample and detect the presence of different oils or substances that should not be present in pure patchouli oil. By comparing the spectral data from the sample to a database of authentic patchouli oil spectra, NIRS can provide valuable insights into the adulteration levels. NIRS also provides fast results, often within seconds or minutes, making it suitable for quick screening of large batches of patchouli oil. This enables manufacturers, distributors, and regulatory authorities to identify potentially fraudulent products promptly and take appropriate actions to mitigate the risk. This makes it a reliable and recognized tool for fraud detection, providing confidence in the accuracy and validity of the results obtained.
In summary, NIRS offers significant benefits for patchouli oil fraudulent detection by identifying adulterants, quantifying key compounds, providing rapid analysis, enabling non-destructive testing, and leveraging its established position as an industry-standard method. Its application in this context can help ensure the authenticity and quality of patchouli oil products in the market.
Information on chemical content in spectrum data cannot be seen only by observing the spectrum, but must be analyzed further using multivariate analysis. According to research Siregar et al. [25] this is due to the complex pattern of the infrared spectrum which makes direct and visual interpretation difficult.
3.2 Gurjun oil content estimation model
This study describes the development of an estimation model that is used to estimate the content of gurjun oil mixed with patchouli oil. Two regression approaches used, namely PCR and PLS were applied to determine the model by regressing the original unprocessed spectrum data as the independent variable (X) and gurjun oil content as the dependent variable (Y). The statistical parameters used for the latent variable (LV) are 9 and the standard deviation (SD) is 30.17. The results of the estimation of gurjun oil content are shown in Table 2.
Table 2. PCR and PLS calibration model without spectrum pretreatment
|
Calibration Method |
Statistical Parameters |
|||
|
r |
R2 |
RMSE |
RPD |
|
|
PCR |
0.83 |
0.69 |
16.80 |
1.85 |
|
PLS |
0.90 |
0.81 |
13.24 |
2.34 |
RMSE: Root mean square of error, RPD: Residual predictive deviation.
The RPD indices generated from the PCR and PLS models are 1.85 and 2.34, respectively. Based on literature Cen and He [26], the RPD index between 1.5-2 is included in the category of models that can distinguish low from high response variable values and values between 2-2.5 are included in the category of fairly rough quantitative predictions. According to research by Jentzsch et al. [5], if you look at these two categories, the accuracy of the model needs to be improved. In addition, we found that the PLS regression approach produces and achieves better estimation performance than PCR as shown in Figure 2.
Figure 2. PCR and PLS calibration for estimating gurjun oil content
Research result by Zulfahrizal and Munawar [9], Hayati et al. [11], Munandar and Mulyati [27], reported that the PLS method achieves more accurate and robust predictions compared to PCR. PLS is preferred over PCR in NIRS analysis due to its ability to handle collinearity, focus on relevant spectral information, robustness to noise, improved predictive performance, and dimensionality reduction. However, it's important to note that the choice between PLS and PCR might depend on the specific characteristics of the dataset and the goals of the analysis, and a comprehensive evaluation of both methods should be conducted for each individual application. Improved predictive performance: PLS, through its ability to capture the relevant spectral information and handle collinearity, often improves the prediction accuracy compared to PCR. The latent variables in PLS are specifically optimized for prediction, leading to models that better capture the underlying relationship between the spectral data and the response variable [28].
Patchouli oil and gurjun oil are biological objects in the form of liquids that can affect the spectrum acquisition process. External factors such as light scattering during spectrum acquisition also affect the spectrum acquisition process. Thus, it can interfere with the accuracy and robustness of the prediction model. These effects need to be treated to achieve more robust and accurate estimation results. According to research results by Jentzsch et al. [5], it is highly recommended to perform spectrum pretreatment to improve the spectrum data before calibration of the estimation model. Therefore, the application of spectrum pretreatment will only be given to models produced by the PLS method only.
3.3 Impact of spectrum pretreatment on estimation performance
This study used two systematically different spectrum pretreatment methods. Spectral pretreatment methods used are MN and DT to improve the prediction performance, accuracy and robustness of the model. Furthermore, the performance results of the two spectral pretreatment methods were compared by looking at the statistical parameters. An estimation model for gurjun oil content was made using 21 spectral data in the calibration data set corrected by the two pretreatment methods. The best spectrum correction algorithm is chosen based on its estimation performance. Calibration results can be seen in Table 3.
Table 3. The PLS calibration model uses a different spectrum pretreatment
|
Spectral Pretreatment |
Statistical Parameters |
|||
|
r |
R2 |
RMSE |
RPD |
|
|
MN |
0.94 |
0.88 |
10.40 |
2.98 |
|
DT |
0.93 |
0.87 |
11.96 |
2.59 |
RPD: Residual predictive deviation.
MN and DT methods are commonly used in NIRS for pre-processing data before analysis. Removal of baseline offset: MN and DT aids in removing the baseline offset caused by instrument drift or other systematic errors. By subtracting the mean value from each individual data point, the baseline offset is effectively eliminated. This allows for better visualization and interpretation of the NIR spectral data.
The first spectrum pretreatment method is MN. The estimation accuracy achieved in the form of correlation coefficient (r) and RPD index increased significantly after MN pretreatment compared to using raw spectrum data without pretreatment. The correlation coefficient (r) increased from 0.90 to 0.94 and the RPD index also increased from 2.34 to 2.98, while the RMSE decreased from 13.24 to 10.4. Similar findings also occur in the DT pretreatment method. In the DT pretreatment method, the correlation coefficient (r) increased to 0.93 and the RPD index also increased to 2.59, while the RMSE index also decreased to 11.96.
Both spectrum pretreatments (MN and DT) have succeeded in improving the performance of the calibration model. The resulting two calibration models (PLS-MN and PLS-DT) fall into the category of good prediction accuracy. However, the RPD index of the PLS-MN model is greater than the RPD index of the PLS-DT model. The plot of the calibration model test results is shown in Figure 3.
Figure 3. PLS calibration plot using (a) MN and (b) DT pretreatment
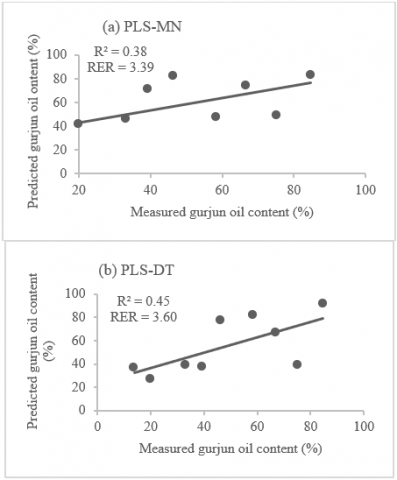
Furthermore, independent validation was carried out to see the practical utility of the resulting PLS-MN and PLS-DT models. A total of 9 oil samples were used for the validation dataset. The validation performance is shown in Table 4. The validation performance test plot is shown in Figure 4. Based on Table 4 it can be seen that the RER values of the PLS-MN and PLS-DT pretreatment models were 3.4 and 3.6, respectively. Based on literature Furtado et al. [21], the RER value is in the category of having low to moderate practical utility.
This presented works would be benefited for people works in patchouli oil industries in order to avoid and minimize fraudulence practices. By applying NIRS technology, we can detect adulteration in patchouli oil rapidy and non-destructively.
Table 4. Validation performance for estimating gurjun oil content mixed in patchouli oil using PLS-MN and PLS-DT spectrum data
|
Spectral Pretreatment |
Statistical Parameters |
|||
|
r |
R2 |
RMSE |
RER |
|
|
PLS-MN |
0.62 |
0.38 |
20.87 |
3.39 |
|
PLS-DT |
0.67 |
0.45 |
19.66 |
3.60 |
RMSE: Root mean square of error, RER: Range to error ratio.
Figure 4. PLS validation plot using (a) PLS-MN and (b) PLS-DT pretreatment
The results showed that NIRS technology and multivariate analysis could be used as an alternative fast and powerful method for estimating the content of gurjun oil mixed with patchouli oil. The calibration method produced by PLS is better than PCR. The RPD index produced by the PLS model is 2.34, while the PCR is 1.85. Spectrum pretreatment has succeeded in improving the performance of the model so that the calibration RPD indices for the PLS-MN and PLS-DT models are 2.98 and 2.59, respectively. Therefore, spectral pretreatment needs to be carried out before developing an estimation model to obtain and achieve a more accurate estimation performance. Model validation resulted in RER values for PLS-MN and PLS-DT of 3.39 and 3.60, respectively, which means they are categorized as having low to moderate practical utility. In general, the two validated models can be said to be quite feasible to apply.
Based on obtained results, it may conclude that NIRS technology can be applied for rapid and non-destructive detection of patchouli oil fraudulence mixed with gurjun oil. This work can be considered to minimize adulteration practices in patchouli oil global markets.
We sincere acknowledge to the directorate research and community service (LPPM) Universitas Syiah Kuala for supporting this work through PUU research scheme 2023 (Contract number: 117/UN11.2.1/PT.01.03/PNBP/2023).
[1] Meilina, H., Munawar, A.A. (2021). Robust fraudulence detection of patchouli oil plant using near infrared spectroscopy. In IOP Conference Series: Earth and Environmental Science, 644(1): 012019. https://doi.org/10.1088/1755-1315/644/1/012019
[2] Sudarmaji, A., Margiwiyatno, A., Sulistyo, S.B., Saparso. (2021). Measurement of patchouli oil vapor using array of MOS gas sensors in various adulteration substances and concentrations. Food Research, 5(S2): 84-90. https://doi.org/10.26656/fr.2017.5(S2).016
[3] van Beek, T.A., Joulain, D. (2018). The essential oil of patchouli, Pogostemon cablin: A review. Flavour and Fragrance Journal, 33(1): 6-51. https://doi.org/10.1002/ffj.3418
[4] Custódio, D.L., Veiga-Junior, V.F. (2012). True and common balsams. Revista Brasileira de Farmacognosia, 22: 1372-1383. https://doi.org/10.1590/S0102-695X2012005000097
[5] Jentzsch, P.V., Guerrero, L.R., Ciobotă, V. (2019). A quick overview and current challenges. American Journal of Biomedical Science & Research, 4: 10-11. https://doi.org/10.34297/ajbsr.2019.04.000746
[6] Sudarmaji, A., Margiwiyatno, A., Sulistyo, S.B. (2023). Characteristics of array MOS gas sensors in detection of adulteration on patchouli oil with candlenut oil. In AIP Conference Proceedings, 2586(1): 070016. https://doi.org/10.1063/5.0106394
[7] Basyir, F., Munawar, A.A., Aisyah, Y. (2021). Near infrared reflectance spectroscopy: Classification and rapid prediction of patchouli oil content. In IOP Conference Series: Earth and Environmental Science, 667(1): 012071. https://doi.org/10.1088/1755-1315/667/1/012071
[8] Windawati, V., Purwanto, Y.A., Budiastra, I.W., Widodo, S., Kuroki, S. (2019). Prediction of chemical content in patchouli oil (Pogostemon cablin Benth) by portable NIR spectroscopy. In IOP Conference Series: Materials Science and Engineering, 557(1): 012087. https://doi.org/10.1088/1757-899X/557/1/012087
[9] Zulfahrizal, Z., Munawar, A.A. (2021). Near-infrared technology in agriculture: Non-destructive determination of inner quality parameters in intact cocoa beans. Trends in Sciences, 18(20): 31-31. https://doi.org/10.48048/tis.2021.31
[10] Purwakusumah, E.D., Rafi, M., Safitri, U.D., Nurcholis, W., Adzkiya, M.A.Z. (2014). Identifikasi dan autentikasi jahe merah menggunakan kombinasi spektroskopi FTIR dan kemometrik. Agritech, 34(1): 82-87. https://doi.org/10.22146/agritech.9526
[11] Hayati, R., Zulfahrizal, Z., Munawar, A.A. (2021). Robust prediction performance of inner quality attributes in intact cocoa beans using near infrared spectroscopy and multivariate analysis. Heliyon, 7(2): e06286. https://doi.org/10.1016/j.heliyon.2021.e06286
[12] Ohyver, M. (2010). Penerapan partial least squares pada data gingerol. ComTech: Computer, Mathematics and Engineering Applications, 1(1): 39-47. https://doi.org/10.21512/comtech.v1i1.2166
[13] Diego, M.C.R., Purwanto, Y.A., Budiastra, I.W. (2018). Determination of the characteristics and classification of near-infrared spectra of patchouli oil (Pogostemon cablin Benth.) from different origin. In IOP Conference Series: Earth and Environmental Science, 147(1): 012013. https://doi.org/10.1088/1755-1315/147/1/012013
[14] Zulfahrizal, Muhammad, S., Arip Munawar, A., Tarigan, T. (2020). Near infrared technology and multivariate analysis approach for a rapid authentication of patchouli oil. International Journal of Scientific & Technology Research, 9(8): 145-149. https://www.ijstr.org/paper-references.php?ref=IJSTR-0720-39969.
[15] Muhammad, S., Munawar, A.A. (2021). Rapid detection of patchouli oil mixed by coconut oil using NIRS technology and chemometrics method. In IOP Conference Series: Earth and Environmental Science, 644(1): 012005. https://doi.org/10.1088/1755-1315/644/1/012005
[16] Muhammad, S., Munawar, A.A. (2021). Rapid determination of patchouli oil quality as a tropical plant using infrared technology. In IOP Conference Series: Earth and Environmental Science, 922(1): 012027. https://doi.org/10.1088/1755-1315/922/1/012027
[17] Arianti, N.D., Muslih, M., Irawan, C., Saputra, E., Bulan, R. (2023). Classification of harvesting age of mango based on NIR spectra using machine learning algorithms. Mathematical Modelling of Engineering Problems, 10(1): 204-211. https://doi.org/10.18280/mmep.100123
[18] Putri, A.R., Rohman, A., Riyanto, S., Setyaningsih, W. (2020). Autentikasi minyak ikan patin (Pangasius micronemus) menggunakan metode spektroskopi FTIR yang dikombinasikan dengan kemometrika. Authentication of patin fish oil (Pangasius micronemus) using FTIR spectroscopy combined with chemometrics. Indonesian Journal of Chemometrics and Pharmaceutical Analysis, 1(1): 22-27. https://doi.org/10.22146/ijcpa.487
[19] Satriyo, P., Munawar, A.A. (2020). Data analysis on near infrared spectroscopy as a part of technology adoption for cocoa farmer in Aceh Province, Indonesia. Data in Brief, 29: 105251. https://doi.org/10.1016/j.dib.2020.105251
[20] Ortiz, A., León, L., Contador, R., Tejerina, D. (2021). Near-Infrared Spectroscopy (NIRS) as a tool for classification of pre-sliced Iberian salchichón, modified atmosphere packaged (map) according to the official commercial categories of raw meat. Foods, 10(8): 1865. https://doi.org/10.3390/foods10081865
[21] Furtado, E.J.G., Bridi, A.M., Barbin, D.F., Barata, C.C.P., Peres, L.M., Barbon, A.P.A.C., Andreo, N., Giangareli, B.L., Terto, D.K., Batista, J.P. (2018). Prediction of pH and color in pork meat using VIS-NIR near-infrared spectroscopy (NIRS). Food Science and Technology, 39: 88-92. https://doi.org/10.1590/fst.27417
[22] Cornwell, C.P. (2010). Notes on the composition of patchouli oil (Pogostemon cablin (Blanco) Benth.). Journal of Essential Oil Research, 22(4): 360-364. https://doi.org/10.1080/10412905.2010.9700346
[23] Khalid, Z.K.Z. (2017). Pengembangan produk minyak nilam dalam upaya memenuhi standar quality patchouli alcohol menggunakan chemometric. Jurnal Serambi Engineering, 2(1): 60-67.
[24] Tata, H.L., Heryati, Y., Aswandi, A., Fernandes, A., Saputra, N.A. (2019). Pengembangan hasil hutan bukan kayu indonesia untuk mendukung sustainable development goals. https://www.researchgate.net/publication/338790297_Pengembangan_Hasil_Hutan_Bukan_Kayu_Indonesia_untuk_Mendukung_Sustainable_Development_Goals_Pengembangan_Hasil_Hutan_Bukan_Kayu_Indonesia_untuk_Mendukung_Pengembangan_Hasil_Hutan_Bukan_Kayu_Indonesia_.
[25] Siregar, Y.D.I., Heryanto, R., Lela, N., Lestari, T.H. (2015). Karakterisasi karbon aktif asal tumbuhan dan tulang hewan menggunakan FTIR dan analisis kemometrika. Jurnal Kimia VALENSI, 1(2): 103-116. https://doi.org/10.15408/jkv.v0i0.3146
[26] Cen, H., He, Y. (2007). Theory and application of near infrared reflectance spectroscopy in determination of food quality. Trends in Food Science & Technology, 18(2): 72-83. https://doi.org/10.1016/j.tifs.2006.09.003
[27] Munandar, A., Mulyati, S. (2022). Application of chemometric combination NIRS technology for analysis of mixed coconut oil levels in Aceh Patchouli Oil. In IOP Conference Series: Earth and Environmental Science, 1116(1): 012023. https://doi.org/10.1088/1755-1315/1116/1/012023
[28] Munawar, A.A., Yunus, Y., Satriyo, P. (2020). Calibration models database of near infrared spectroscopy to predict agricultural soil fertility properties. Data in Brief, 30: 105469. https://doi.org/10.1016/j.dib.2020.105469