Adi Susilo![]() | Mohammad Habibiy Idmi
| Mohammad Habibiy Idmi![]() | Muhammad Fathur Rouf Hasan*
| Muhammad Fathur Rouf Hasan*![]() | Donar Alamsah Saragih
| Donar Alamsah Saragih![]() | Eko Andi Suryo
| Eko Andi Suryo![]() | Putera Agung Maha Agung
| Putera Agung Maha Agung![]()
© 2023 IIETA. This article is published by IIETA and is licensed under the CC BY 4.0 license (http://creativecommons.org/licenses/by/4.0/).
OPEN ACCESS
The geotechnical composition of the soils in the Rokan Hulu Regency, Riau, predominantly weak soils, has significant implications for bridge construction within the region. Excessive loading on these weak soil zones can instigate subsidence, thus compromising the stability of the bridge foundation by inducing tilting. This study is aimed at mapping these weak soil zones in the context of a bridge construction project within the Rokan Hulu district of Riau. Investigation of these zones was conducted via a geoelectrical resistivity approach using a dipole-dipole configuration across five lines. The lengths of these lines ranged from 65 to 200 meters, with an electrode inter-distance of 10 meters. The outcome of this analysis was depicted in both two-dimensional and three-dimensional models. The layer exhibiting the lowest resistivity value, interpreted as sandy clay rock, was identified as having high porosity, thereby serving as an aquifer and being indicative of a weak soil zone. As revealed by the two-dimensional and three-dimensional models, the depth of the weak soil zone varied between 0-40 meters, denoted by a low resistivity value of 0-15 Ω.m, and was interpreted as sandy loam. Two weak soil zones were identified within the foundation area of the Hulu Rokan Bridge, located in the northwest (5-40 m) and southeast (65-80 m) sections from the river bank. Moreover, the distribution of these weak soil zones was observed to extend from the Rokan River towards the southeast and northwest. Based on these findings, it can be inferred that the foundation in the northwest is more vulnerable due to the relatively shallow presence of the weak soil zone. Consequently, soil improvement measures, including compaction and stabilization, are recommended.
geoelectrical resistivity, dipole-dipole configuration, weak soil zone, soil subsidence, bridge construction area
The Rokan Hulu Regency, spanning an area of 7,588.13 km² and home to over 561,385 inhabitants, is experiencing significant population growth [1]. This growth necessitates commensurate infrastructural development, including highways, government buildings, residential housing, and notably, bridges. However, the presence of weak soil zones poses significant challenges to bridge construction, as it can compromise the strength of the foundation [2]. These zones, situated below the surface, consist of soil or rock masses that are susceptible to subsidence [3]. The ensuing land subsidence can inflict severe damage on the overlying infrastructure, leading to tilted buildings, cracked foundations, and, in extreme cases, structural collapse, with concomitant physical, economic, and human losses [4].
Constructing a bridge without adequate consideration of the subsurface conditions can prove catastrophic, as building pressure on a weak soil zone can lead to subsidence [5]; so this is important to investigate to reduce the risk of land subsidence [6]. Land subsidence is primarily caused by volume changes in the underlying rock layer and can be attributed to several factors including excessive groundwater extraction, consolidation due to building loads, tectonic activity, and the presence of weak soil zones due to water intrusion.
The geological landscape of the Upper Rokan Regency, Riau, as depicted in the Dumai and Bagansiapi-Api Quadrangle, is dominated by Young Superficial Deposits. These deposits, of Holocene age, were deposited in an alluvial environment and consist of clays, silts, clean gravels, vegetation rafts, and peat swamps [7]. The considerable porosity of the gravel and sand layers suggests low soil resistance in this area, implying that additional surface loads due to development could potentially induce land subsidence [8]. Consequently, there is a pressing need to map the distribution of weak soil zones in bridge foundation construction, to inform the extent, depth, and distribution of these zones for appropriate geotechnical engineering planning [9]. This mapping can serve as preliminary data in the bridge construction project, aiding in foundation structure planning and cost estimation.
The geoelectrical resistivity method, capable of estimating weak soil zones, has been successfully used in various applications [10]. It involves the injection of direct current (DC) into the ground to estimate subsurface conditions. The method has been employed to investigate bridge foundations [2], determine bedrock depth [11], identify slip zones [12], and explore geothermal resources [13]. It can also identify rock types, rock thickness, aquifer zones, and weak soil zones [14]. Ha et al. [15], have demonstrated the utility of resistivity mapping for weak soil zone mapping.
The present study will employ the geoelectrical resistivity method with a dipole-dipole configuration, given its advantages in vertical and horizontal penetration, enabling a comprehensive view of the weak soil zone distribution [16, 17]. The geoelectric method can discern subsurface conditions based on measured resistivity values. Low resistivity values can indicate the presence of rocks comprising materials with high vulnerability, such as clay, sand, aquifer zones, and layers intruded by water [16]. These rock types, due to their high porosity, are particularly susceptible to subsidence under surface pressure.
The overarching goal of this research is to map weak soil zones in the construction of bridge foundations in the Rokan Hulu district, Riau. The analysis results will be presented in 2D and 3D models to facilitate interpretation. The 2D model will provide depth and track length results, while the 3D model will offer information on the length, width, depth, and distribution direction of the weak soil zone at the study site. The findings of this study have the potential to serve as a reference in the planning of future bridge construction projects.
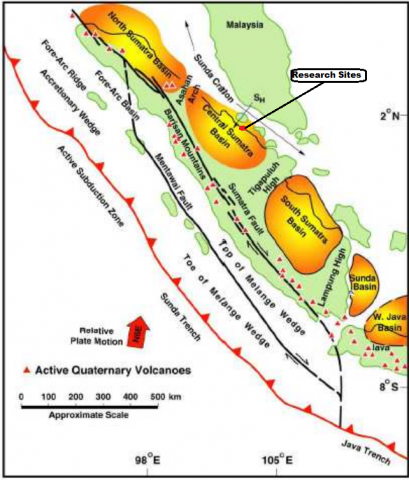
Based on geological data, Pekanbaru City is included in the Central Sumatra Basin (back arc basin); this basin develops on the west and south coasts of the Sunda Shelf in the southwestern part of Southeast Asia (Figure 1). The existence of an oblique subduction of the Indian Ocean plate towards the bottom of the Asian Continental plate resulted in a pulling force on the Central Sumatra Basin, which is a back arc basin and formed the Central Sumatra Basin.
Figure 1. Central Sumatra Basin regional map [18]
This basin has an age of formation at the Early Tertiary, where there are Tertiary rock outcrops in the Bukit Barisan area West of Sumatra to the plains of the east coast of the island of Sumatra. The structure in this basin was formed from several different phases, starting from the Mesozoic era to the Late Tertiary era. During the Middle Mesozoic era, a deformation caused the Paleozoic rocks to be metamorphosed, broken, folded, and accompanied by granite intrusions. In the Late Cretaceous to the Early Tertiary era, structures were formed due to tensile forces resulting in relatively north-south trending graben-graben [7].
The geoelectrical resistivity method uses the concept of electric current propagation in an isotropic homogeneous medium, where the electric current moves in all directions with the same value [19]. If there is a deviation from ideal conditions (homogeneous isotropy), this deviation (anomaly) is observed. The value of rock resistivity is related to its physical properties, including the degree of water saturation, porosity, permeability, and rock formations [20].
Resistivity is a quantity used to measure the value of a material's resistance to the flow of electricity [21]. This resistivity value is inversely proportional to the electrical conductivity. The principle of the resistivity method is to inject an electric current into the earth through two current electrodes; then, the potential difference is measured by the two potential electrodes so that the resistivity value can be calculated [22]. Geoelectric measurement techniques are divided into 2, namely mapping and sounding; for mapping activities, it is recommended to use mapping techniques to find out vertical and horizontal underground mapping [23]. Generally, this method is good for shallow investigations [24].
3.1 Dipole-dipole configuration research design
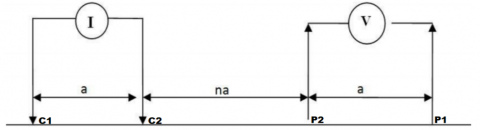
The data acquisition of geoelectrical resistivity using a dipole-dipole configuration is made because it aims to map weak soil zones in the subsurface layer. The dipole-dipole configuration has advantages in the form of mapping. Design measurements in the field, in the form of a stretch of a straight line; this line is made straight because it adjusts to the final result as a 2D section. The dipole-dipole configuration can obtain subsurface images with good vertical and horizontal penetration [25]. Good vertical and horizontal penetration of the geoelectric method can be used to determine deep or shallow objects [26]. The dipole-dipole configuration measurement technique is shown in Figure 2 below:
Figure 2. Dipole-dipole configuration
Figure 2, the dipole-dipole configuration consists of 2 current electrodes (C1 and C2) to conduct electric current and two potential electrodes (P1 and P2) to read the value of the potential difference [25]. Four electrodes are plugged into the soil surface with the distance between the current and potential electrodes as far as "a". Then the distance between the current electrode and the potential electrode (P2 - C2) as far as "na". The existence of an electric current will cause an electric voltage in the ground. The current voltage is measured with a resistivity meter through the potential electrodes (P1 and P2). When the position of the current electrode is further away, it causes the flow of electric current to penetrate deeper layers. So that the geometric factor of the dipole-dipole configuration is obtained as follows:
$\mathrm{K}=\mathrm{n}(\mathrm{n}+1)(\mathrm{n}+2) \pi \alpha$ (1)
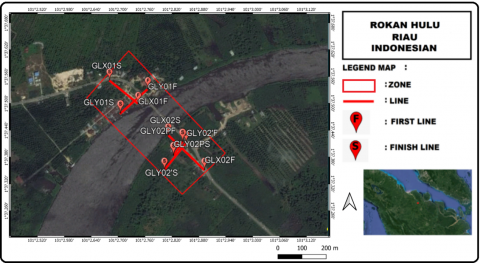
The tool used is geoelectric resistivity type G10 Geomative. It integrates the advantages of conventional centralized cabling systems with up to 3200 W (800V*4A) transmission. The data acquisition was located in the Hulu Rokan bridge construction area, Riau province, Sumatra. Figure 3 shows the survey design at the research location with the number of routes used. There are 5 lines with different lengths: GLX01, GLX02, GLY01, GLY02, and GLY02P. The measurement uses a dipole-dipole configuration using 4 electrodes placed 10 meters from each other. The length of the lines GLX01 and GLY01 are 160 meters, GLX02 200 meters, GLY02 140 meters, and GLY02P 65 meters. The measurement designs are arranged to intersect so they can be modeled in 2D and 3D.
Figure 3. Research site survey design
3.2 Modeling and analysis
The modeling aims to interpret raw data to be easy to understand; this study presents the research results in 2D and 3D forms. The 2D modeling aims to make the mapping results visible vertically and horizontally, while the 3D modeling aims to make it easier for the simulation to see the weak soil zone distribution map visually. Basically, these two models have the same goal to make it easier for readers to view weak soil zone maps.
The data obtained includes current and electrode potential distance, current value (I), potential value (V), and geometric factor (K). These results are a combination of various measurements of the rock resistivity values so that they become one apparent resistivity value or close to the actual value; the following equation can determine the apparent resistivity value (ρa).
$\rho a=K \frac{\Delta V}{I}$ (2)
2D processing using Res2Dinv software with smoothness–constrained inversion least-squares using forward modeling. The final result of this inversion is a 2D subsurface cross-sectional model. The results of the 2D cross-sectional model are resistivity values, line length, and depth variations [23]. From the results of 2D inversion, followed by 3D processing using the Oasis Montaj software (forward modeling from the inversion resistivity value), the 3D model results will be obtained [27]. The final results of the 2D and 3D models will be correlated to show the distribution and depth of the weak soil zones. Interpretation is carried out based on resistivity values, geological data of the research area, color scale, and research that has been done before.
The low resistivity value indicates that the constituent lithology has large porosity and permeability, and this value usually comprises clay, sand, silt, and aquifers [28]. Large porosity and permeability can cause intrusion because water can enter the rock cavity. Water intrusion is one of the causes of a weak soil zone where water infiltrates into the soil, causing the soil to become saturated so that the carrying capacity and strength of the soil will decrease. Soil has properties that can store water; this property can affect the porosity and permeability of the soil [23].
Some supporting data must be prepared before data acquisition as initial information, such as regional geological maps and conditions in the field [8]. Based on the geological map of the Dumai and Bagansiapi-Api Quadrangle in Figure 4, the study area consists of Young Superficial Deposits (Qh) and Older Superficial Deposits (Qp). Young Superficial Deposits (Qh) have a Holocene age that was deposited in an alluvial environment. They were formed in the Quaternary Age, deposited in an unconformity and above the old surface deposits. This formation comprises clays, silts and clean gravels, vegetation rafts, and peat swamps. Older Superficial Deposits (Qp) have a Pleistocene age and were deposited in a fluvial-alluvial environment and were formed during the Quaternary, deposited unconformably and above the Minas formation. This formation is located in basins or swampy backshore areas and tidal grooves consisting of clays, silts and clayey gravels, and vegetation rafts.
Figure 4. Regional geological map of study area [29]
4.1 2D modeling
Identification of weak soil zones in this study refers to layers that have the highest porosity or can be characterized by the presence of water seepage in the soil. This condition is due to the relation between the presence of water seepage and soil resistance, where soils that can store water have high porosity, such as clay and sand. Both types of rock will become weak when mixed with water. Based on the results of research conducted by Susilo et al. [30], a small resistivity value indicates the possibility of water in the soil. Aquifer zone analysis was carried out based on the results of the interpretation of the 2D model and explained the possible types of aquifers found in the study area.
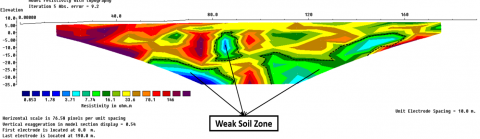
(a) 2D cross-section of Line GLX01
(b) 2D cross-section of Line GLX02
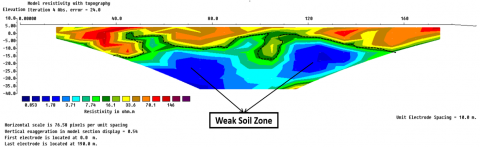
(c) 2D cross-section of Line GLY02
(d) 2D cross-section of Line GLY01
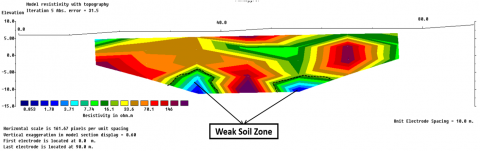
(e) 2D cross-section of Line GLY02P
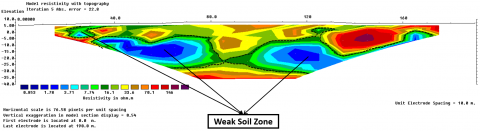
Figure 5. 2D section processing results on every line
Figure 5 shows that the resistivity value can be divided into 3: low, medium, and high. Low resistivity ranging from 0 to 16 Ω.m is indicated by dark blue to green, medium resistivity ranging from 16 to 33.6 Ω.m is indicated by green to orange, and high resistivity ranges from 33.6 to 146 Ω.m with orange to purple color. We provide a more detailed explanation in Table 1 below:
Table 1. Interpretation of 2D result
|
No. |
Color Scale |
Resistivity (Ω.m) |
Lithology |
|
1 |
0.59 - 15 Ω.m |
Sand Clay |
|
|
2 |
15 - 30 Ω.m |
Sand |
|
|
3 |
30 - 87.0 Ω.m |
Gravel Sand (impermeable) |
Based on the interpretation of the resistivity values that have been carried out, it can be seen that the weak soil zone is found on the line with a resistivity value of 0.853 to 15 Ω.m. Weak soil zones are marked with dark blue to light green colors at a depth of about 5 to 40 meters. Weak soil zones can be detected based on the presence of layers with high porosity, such as clay and sand; these layers will become a gathering place for water and then becomes an aquifer. Where the fluid that fills this zone is most likely caused by water intrusion from the Rokan River, so water entering due to intrusion is trapped in this zone. The presence of aquifers in this zone can indicate that it has large porosity as a place for fluid passage, so it is identified as a weak soil zone.
4.2 3D modeling
In the 2D model, the weak soil zone is estimated to have a resistive value ranging from 0 to 15 Ω.m. This is because a low resistance value indicates the presence of underground fluids. The presence of fluids causes the subsoil to erode and produce cavities which become zones of weak soil. Determination of the existence of a weak soil zone is also strengthened by geological data, where the bridge construction area is dominated by clay. When exposed to water flow, the clay layer is easily eroded, resulting in an empty zone. When an area has a weak soil zone, and there is an increase in the load by the bridge foundation, there will be a subsidence of the soil surface. Land subsidence resulted in damage to the bridge foundation, such as cracks, tilting, and even collapsing. The 3D sectional model of the Weak soil zone continues the 2D modeling that has been done and aims to show a model of each weak soil zone. This aims to make it easier to identify weak soil zones [31].
(a) Southwest weak soil zone 3D model
(b) Southeast weak soil zone 3D model
Figure 6. 3D modeling result
The aquifer in this study was found at depths varying from 0 to 40 meters, where the aquifer zones are not continuous or connected to each other. This is due to the different types of aquifers composed of confined aquifers, meteorite water (surface water), and unconfined aquifers. The aquifer zone area above is also used as a reference as there is a weak soil zone because the presence of an aquifer can be an indication that this zone has large porosity as a place for fluid to pass [8], resulting in empty zones or cavities that can cause subsidence or slip planes. Porosity and permeability are parameters in determining weak soil zones because they indicate that rock resistance is lower than rocks with smaller porosity and permeability.
Porosity is the ratio between the volume of pores in a rock mass or the part of the rock volume that is not filled with strong objects and high permeability. Permeability indicates the capacity of rock/soil to transmit or pass fluids [32]. High porosity and permeability can cause water intrusion into the soil and become a place for fluid to flow, resulting in cavities that can cause subsidence of the soil surface [8]. This condition is quite dangerous for large buildings, such as bridges, that have very large loads. The bridge will provide a continuous compressive force against the ground to indirectly trigger subsidence of the soil and foundation, which can damage the bridge. Based on the 2D (Figure 5) and 3D (Figures 6 and 7) model analysis, it is known that there is a weak soil zone in the Hulu Rokan bridge foundation area. The weak soil zone in the Southwest foundation (Figure 6(a)) is 5 to 40 meters from the bank of the Rokan River. Then for the foundation in the southeast zone (Figure 6(b)), the weak is exactly 65 to 80 meters from the river bank. The weak soil zone in the bridge foundation construction area has no continuity (Figure 7), and this is caused by the uneven intrusion of water from the Rokan River.
Figure 7. Illustration 3D modelling for weak soil zone map
These conditions require soil improvement before bridge construction because weak soil zones will have fatal consequences for construction, such as cracked foundations, tilted bridges, and even subsidence of bridge foundations. Soil improvement aims to increase the soil's bearing capacity and shear strength that supports a bridge foundation structure. Strengthening in the weak soil zone can be done mechanically, such as by compacting the soil; it aims to reduce the porosity of rocks in the weak soil zone. In addition, soil improvement can be carried out using the stability method, which aims to improve soil properties and increase its resistance to softening by water [33]. Soil reinforcement can also be a solution, such as liquid concrete injection, the addition of piles [34], and other geotechnical engineering, such as chemical injection. This improvement needs to be done, especially on the northwest foundation, which is indicated to be weaker because the weak soil zone is found at a relatively shallow depth of 5-40 meters.
Based on the analysis of 2D and 3D models, weak soil zones are found on the Southwestern foundations within 5 to 40 meters and on the southeastern foundations within 65 to 80 meters from the banks of the Rokan River. This weak soil zone has a depth that varies from 0 to 40 m with a resistivity value between 0 to 15 Ω.m, while the constituent rocks are sandy loam. Identifying the weak soil zone in this study refers to the layer with the highest porosity, characterized by water seepage in the soil (aquifer). The water in the ground is detected based on the measured low resistivity value. Intrusion from the Rokan River, which occurs continuously beneath the soil surface, causes cavities in sandy clay rocks to be filled with water, whereas these types of rocks will become weak if mixed with water.
The results of this study are useful for planning a construction project so that they can form the basis for structural planning and estimated costs required. Improvements in weak soil zones can be carried out by various methods such as compaction, stabilization, and geotechnical engineering. Soil improvement efforts aim to increase soil stability and reduce porosity in weak soil zones. This improvement needs to be done, especially on the northwest foundation, which is indicated to be weaker because the weak soil zone is found at a shallow depth of 5-40 meters. In comparison, determining the most efficient soil reinforcement method can be used for future research.
The author thanks PT. Abhinaya Mappindo Bumitala as the research data provider, the author also thanks the physics department of Brawijaya University for the support given so that this article can be completed.
|
n |
Number of Layers |
|
I |
Current (Ohm) |
|
V |
Voltage (Volt) |
|
K |
Geometric Factor |
|
P1 |
Symbol of Potential Electrode (meter) |
|
P2 |
Symbol of Potential Electrode (meter) |
|
C1 |
Symbol of Current Electrode (meter) |
|
C2 |
Symbol of Current Electrode (meter) |
|
Greek Symbols |
|
|
π |
Phi |
|
α |
Distance Between Electrodes (meters) |
|
ρa |
Apparent Resistivity Value (Ohm) |
|
Ω |
Measured Resistivity Value (Ohm) |
[1] Central bureau of statistics. (2021). Central Bureau of Statistics of Rokan Hulu Regency. https://rohulkab.bps.go.id/indicator/12/48/1/jumlah-penduduk.html, accessed on Sep. 12, 2021.
[2] Tucker, S.E., Briaud, J.L., Hurlebaus, S., Everett, M.E., Arjwech, R. (2015). Electrical resistivity and induced polarization imaging for unknown bridge foundations. Journal of Geotechnical and Geoenvironmental Engineering, 141(5): 04015008. https://doi.org/10.1061/(ASCE)GT.1943-5606.0001268
[3] Zhao, D., Xia, Y., Zhang, C., Zhou, H., Liu, N., Singh, H.K., Zhao, Z., Chen, J., Mu, C. (2022). Failure modes and excavation stability of large-scale columnar jointed rock masses containing interlayer shear weakness zones. International Journal of Rock Mechanics and Mining Sciences, 159: 105222. https://doi.org/10.1016/j.ijrmms.2022.105222
[4] El Kamali, M., Papoutsis, I., Loupasakis, C., Abuelgasim, A., Omari, K., Kontoes, C. (2021). Monitoring of land surface subsidence using persistent scatterer interferometry techniques and ground truth data in arid and semi-arid regions, the case of Remah, UAE. Science of the Total Environment, 776: 145946. https://doi.org/10.1016/j.scitotenv.2021.145946
[5] Zaenudin, A., Darmawan, I.G.B., Minardi, S., Haerudin, N. (2018). Land subsidence analysis in Bandar Lampung City based on InSAR. Journal of Physics: Conference Series, 1080(1): 012043. https://doi.org/10.1088/1742-6596/1080/1/012043
[6] Agung, P.A.M., Ahmad, M.A., Hasan, M.F.R. (2022). Probability liquefaction on silty sand layer on central Jakarta. International Journal of Integrated Engineering, 14(9): 48-55. https://doi.org/10.30880/ijie.2022.14.09.007
[7] Eubank, R.T., Makki, A.C. (1981). Structural geology of the Central Sumatra back-arc basin. Indonesian Petroleum Association. In 10th Annual Convention Proceedings, pp. 153-196.
[8] Hasan, M.F.R., Fransiska, C.D., Suaidi, D.A., Wisodo, H., Martina, N., Rahmat, A. (2021). Identification of seawater intrusion using geoelectrical resistivity method in the Goa Cina Beach Malang Area, Indonesia. IOP Conference Series: Earth and Environmental Science, 739(1): 012002. https://doi.org/10.1088/1755-1315/739/1/012002
[9] Prakash, A., Bharati, A.K. (2022). Implication of electrical resistivity tomography for precise demarcation of pothole subsidence potential zone over shallow depth coal mine workings. Journal of the Geological Society of India, 98(5): 600-606. https://doi.org/10.1007/s12594-022-2032-z
[10] Farooq, M., Samgyu, P., Young, S.S., Ho Kim, J., Mohammad, T., Adepelumi, A.A. (2012). Subsurface cavity detection in a karst environment using electrical resistivity (er): A case study from yongweol-ri, South Korea. Earth Sciences Research Journal, 16(1): 75-82.
[11] Chambers, J.E., Wilkinson, P.B., Wardrop, D., Hameed, A., Hill, I., Jeffrey, C., Loke, M.H., Meldrum, P.I., Kuras, O., Cave, M. (2012). Bedrock detection beneath river terrace deposits using three-dimensional electrical resistivity tomography. Geomorphology, 177: 17–25. https://doi.org/10.1016/j.geomorph.2012.03.034
[12] Gelisli, K., Ersoy, H. (2017). Landslide investigation with the use of geophysical methods: A case study in Eastern Turkey. Advances in Biology & Earth Sciences, 2(1): 52-64.
[13] Rolia, E., Sutjiningsih, D. (2018). Application of geoelectric method for groundwater exploration from surface (A literature study). AIP Conference Proceedings, 1977(1): 020018. https://doi.org/10.1063/1.5042874
[14] Mickus, K., Frifita, N., Zaied, M.B., Ouessar, M. (2022). Gravity and electrical resistivity analysis of deep and shallow structures related to aquifers within the Jeffara Plain, southeast Tunisia. Journal of African Earth Sciences, 196: 104685. https://doi.org/10.1016/j.jafrearsci.2022.104685
[15] Ha, H.S., Kim, D.S., Park, I.J. (2010). Application of electrical resistivity techniques to detect weak and fracture zones during underground construction. Environmental Earth Sciences, 60(4): 723-731. https://doi.org/10.1007/s12665-009-0210-6
[16] Rønning, J.S., Ganerød, G.V, Dalsegg, E., Reiser, F. (2014). Resistivity mapping as a tool for identification and characterisation of weakness zones in crystalline bedrock: Definition and testing of an interpretational model. Bulletin of Engineering Geology and the Environment, 73(4): 1225-1244. https://doi.org/10.1007/s10064-013-0555-7
[17] Setyawan, A., Aribowo, Y., Trihadini, A., Hastuti, D., Ramdhani, F., Waskito, F., Febrika, G., Virgiawan, G. (2017). Sea water intrusion in Kaligawe Semarang based on resistivity data. IOP Conference Series: Earth and Environmental Science, 55(1): 012053. https://doi.org/10.1088/1755-1315/55/1/012053
[18] Heidrick, T.L., Aulia, K. (1993). A structural and tectonic model of the coastal plains block, Central Sumatra Basin, Indonesia. Indonesian Petroleum Association. In 22nd Annual Convention Proceedings, pp. 285-317.
[19] Dalimunthe, Y.K., Hamid, A. (2018). Georadar and geoelectricity method to identify the determine zone of sliding landslide. IOP Conference Series: Earth and Environmental Science, 106(1): 012001. https://doi.org/10.1088/1755-1315/106/1/012001
[20] Telford, W.M., Telford, W.M., Geldart, L.P., Sheriff, R.E. (1990). Applied Geophysics. Cambridge University Press.
[21] Reynolds, J.M. (2011). An Introduction to Applied and Environmental Geophysics. John Wiley & Sons.
[22] Hasan, M.F.R., Susilo, A., Sunaryo. (2018). Identification of underground river flow pattern using self potential (SP) and resistivity methods for drought mitigation at Druju, Sumbermanjing Wetan, Indonesia. Disaster Advances, 11(5): 25-31.
[23] Hasan, M.F.R., Salimah, A., Susilo, A., Rahmat, A., Nurtanto, M., Martina, N. (2022). Identification of landslide area using geoelectrical resistivity method as disaster mitigation strategy. International Journal on Advanced Science Engineering Information Technology, 12(4): 1484-1490. https://doi.org/10.18517/ijaseit.12.4.14694
[24] Roy, A. (1972). Depth of investigation in Wenner, three-electrode and dipole-dipole DC resistivity methods. Geophysical Prospecting, 20(2): 329-340. https://doi.org/10.1111/j.1365-2478.1972.tb00637.x
[25] Loke, M.H. (1999). Electrical imaging surveys for environmental and engineering studies-A practical guide to 2-D and 3-D survey. https://pages.mtu.edu/~ctyoung/LOKENOTE.PDF.
[26] Okpoli, C.C. (2013). Sensitivity and resolution capacity of electrode configurations. International Journal of Geophysics, 2013: 608037. https://doi.org/10.1155/2013/608037
[27] Loke, M.H. (2016). Tutorial: 2-D and 3-D electrical imaging surveys. http://www. geotomosoft.com.
[28] Bashir, I.Y., Izham, M.Y., Main, R. (2014). Vertical electrical sounding investigation of aquifer composition and its potential to yield groundwater in some selected Towns in Bida basin of North central Nigeria. Journal of Geography and Geology, 6(1): 60. https://doi.org/10.5539/jgg.v6n1p60
[29] Cameron, N.R., Kartawa, W., Thompson, S.J. (1982). Geological map of the Dumai and Bagansiapi-Api Quadrangles, Sumatra. Geological Research and Development Center. Bandung, Indonesia.
[30] Susilo, A., Sunaryo, Sutanhaji, A.T., Fitriah, F., Hasan, M.F.R. (2017). Identification of underground river flow in karst area using geoelectric and self-potential methods in Druju Region, southern Malang, Indonesia. International Journal of Applied Engineering Research, 12: 10731-10738.
[31] Arifin, M.H., Kayode, J.S., Ismail, M.K.I., Abdullah, A.M., Embrandiri, A., Nazer, N.S.M., Azmi, A. (2021). Environmental hazard assessment of industrial and municipal waste materials with the applications of RES2-D method and 3-D Oasis Montaj modeling: A case study at Kepong, Kuala Lumpur, Peninsula Malaysia. Journal of Hazardous Materials, 406: 124282. https://doi.org/10.1016/j.jhazmat.2020.124282
[32] Hearst, J.R., Nelson, P.H. (1985). Well Logging for Physical Properties. Mc Graw-Hill Book Co., New York.
[33] Salimah, A., Hazmi, M., Hasan, M.F.R., Agung, P.A.M. (2021). A comparative study of red brick powder and lime as soft soil stabilizer. F1000Research, 10: 777. https://doi.org/10.12688%2Ff1000research.27835.2
[34] Arya, I.W., Wiraga, I.W., Suryanegara, I.G.A.G. (2018). Effect of cement injection on sandy soil slope stability, case study: Slope in Petang district, Badung regency. Journal of Physics: Conference Series, 953(1): 012103. https://doi.org/10.1088/1742-6596/953/1/012103