Abbas A. Khanoosh![]() | Esraa H. Khaleel
| Esraa H. Khaleel![]() | Wesam S. Mohammed-Ali*
| Wesam S. Mohammed-Ali*![]()
© 2023 IIETA. This article is published by IIETA and is licensed under the CC BY 4.0 license (http://creativecommons.org/licenses/by/4.0/).
OPEN ACCESS
Hydraulic analysis of water distribution networks stands as a paramount mathematical application within the realm of water resources engineering. The EPANET software, established by the U.S. Environmental Protection Agency, serves as a model for water flow within distribution systems and is employed in the design and analysis of distribution networks, along with addressing pressing issues in water distribution management, such as water quality investigation. The software's distinctiveness is attributed to its reliance on the Hybrid Node Loop (HNL), which accelerates the numerical resolution of problems with intersecting equations. In this study, the Tikrit University Campus was selected as the site to examine the pressure and discharge behavior within the water distribution network during morning and evening pumping periods. It was observed that the pressure values exhibited a decrease in the university's north-western sections and buildings, particularly those distant from the pumping station, during the morning pumping periods. This pattern is attributable to the heightened demand in the colleges and faculty residential neighborhood, suggesting a correlation between high consumption and reduced pressure values. In the evening period, characterized by a diminished population of students and employees in the university's colleges, an elevated pressure level within the network was noted, likely due to the reduced demand level. However, demand remained high in the female students' dormitories and the faculty residential neighborhood. Interestingly, the male students' dormitory, being remote from the pumping station and supplied with water through the network's end following the faculty residential neighborhood, maintained low pressure values across both periods. This study underscores the need for strategic planning in the design and management of water distribution networks, particularly in areas with variable consumption patterns and demand levels.
water demand, numerical solution, hydraulic analysis, EPANET model, differential equations, network design, drinking water, case study
Water, indisputably, is a pivotal and irreplaceable component of all developmental facets visible in the contemporary world, encompassing domains of health, industry, and other aspects integral to modern civilization. A retrospective glance reveals a persistent human endeavor to refine methods for water delivery to residential and urban areas. Prominent among these endeavors was the establishment of cities proximate to rivers, or the conveyance of water from sources through channels constructed from earth, stone, or occasionally, ceramics. As urban life expanded, the necessity for water distribution networks arose, compelling people to adopt innovative and advanced strategies for water projects. The water distribution system, a hydraulic framework comprised of elements like pipes, tanks, reservoirs, pumps, valves, etc., requires meticulous planning to efficiently deliver water to its users in the design of a new water distribution network or the analysis of an existing one.
The stability of water distribution network progression is a crucial determinant in sustaining life in both urban and rural settings. Factors such as consumption timing (morning or evening), seasons, and the economic status of consumers are all variables that influence the demand for drinking water. Consequently, the divergent water demands between consumers can impact the hydraulic performance of drinking water distribution networks.
Modern management of water distribution systems is increasingly reliant on sophisticated mathematical methodologies. A review of the literature reveals the extensive utilization of modeling tools in managing water distribution network activities, with recommendations being made for future research needs aimed at developing more reliable mathematical models [1]. Numerous methodologies have addressed the issue of unstable demand in water distribution networks. For instance, the slow variation in discharge through a water distribution network was considered by treating the unsteadiness of flow along the pipeline system as a sequential steady-state situation. Such a scenario necessitates time-dependent boundaries for each iterative solution, thereby increasing the computational efforts required [2]. Additionally, external mass balance equations have been employed in extended-period simulation to examine the impacts of variations in water levels provided from reservoirs within a water distribution network. The Generalized-Global Gradient Algorithm (G-GGA) has been implemented for both demand and pressure analyses, enabling the direct prediction of various water head pressure states in reservoirs relative to an initial condition [3]. Many mathematical equations and models use standard water demand requirements to analyze historical and real-time data, providing a comprehensive guide for water distribution network management. The mass balance equation is a critical step in assessing the performance of the water distribution network and can provide immediate, realistic information or predictions to assist water management operations during both expected and unexpected demand [4-6]. On the other hand, the Shuffled Complex Evolution (SCE) algorithm can handle the required pressure and demand without providing an initial boundary condition to start a calculation of a numerical solution for the pressure and demand in a water distribution network. The SCE algorithm has demonstrated flexibility in processing optimal flow in pipes, with high accuracy for calculating the optimal pattern discharge in networks [7].
Despite the advancements in software modeling for solving mathematical equations, certain engineering problem solutions still require substantial time, particularly for data entry, processing, and obtaining final results. Given the significant progress in water resource applications and their mathematical equation relationships, the primary objective of this study is to enhance the reliability of managing water distribution networks. This enhancement is made possible by utilizing mathematical modeling to achieve a resilience analysis of operating water distribution networks under unsteady demand.
Studying the hydraulic performance of the water network depends on estimating the discharge $(Q)$ in each pipe and calculating the available head pressure $(H)$ at each junction. However, when the fluid flows in pipes, loosing in head pressure $(\Delta H)$ occurs along the pipes between junctions. The correlation of headloss as a function of the discharge can be written as follows:
$H_L=K Q^n$ (1)
where, $K$ is the hydraulic resistance parameter, and $\mathrm{n}$ is the discharge power value.
Reviewing the state-of-art shows that the hydraulic resistance parameter depends on the head losses equation being used [8]. Therefore, if the Hazan-William equation is used to estimate head losses, the hydraulics resistance parameter $(K)$ can be written as shown in Eq. (2) and $n$ equal to 1.85.
$K=\frac{10.67 L}{C^{1.85} D^{4.87}}$ (2)
where, $L$ is the pipe length, $D$ is the pipe diameter, $C$ is the Hazan-William friction coefficient.
Nevertheless, using the Darcy-Weisbach equation will make the hydraulic resistances parameter be written as shown in Eq. (3) and $n$ equal to 2.
$K=\frac{8 f L}{\pi^{1.85} D^5 g}$ (3)
where, $g$ is the acceleration due to gravity, $f$ is the DarcyWeisbach friction factor, which can be written as shown in Eq. (4) below:
$\frac{1}{f}=-2 \log \left(\frac{\varepsilon}{3.7 D}+\frac{2.51}{R_e \sqrt{f}}\right)$ (4)
where, $\varepsilon$ is the roughness size of pipes, and $R_e$ is Reynold's Number.
Numerically, an implicit form of Eq. (4) for the DarcyWeisbach friction factor $(f)$ is estimated by solving the equation using an iterative process [9]. While the Reynold's Number is given in the following equation:
$R_e=\frac{4 Q}{\pi D \vartheta}$ (5)
where, $v$ is the kinematic viscosity of a fluid.
One of the first techniques to analyze the water distribution network is the Hardy-Cross Method, which depends on several assumptions based on Kirchhoff's law [10, 11]. First, for each loop of the water distribution network, and to satisfy the conservation of mass, the flow that enters each junction should equal the flow exiting from it. Mathematically, and in other words, the algebraic summation of flows per junction must equal zero. Also, at the end of the iterative process for the numerical solution, the algebraical summation of the head losses for each loop has to be approaching zero. Figure 1 shows the typical shape of the water network loop to clarify the abovementioned information.
Figure 1. The traditional pattern of hardy-cross method
The correction value in the flow value inside each pipe is calculated and added to each pipe in the network loop algebraically after each attempt. Then, the modified discharges are reused in calculating energy losses and thus finding a correction coefficient value for the utilized new flow, and so on, until the correction coefficient becomes close to zero or a very small number. Note that the flow in the clockwise direction has a positive (+ve) sign, while the flow in the counterclockwise has a negative (-ve) sign. The correction of flow for each loop is calculated following equation:
$\Delta Q=-\frac{\sum H_L}{n \sum\left(H_L / Q_o\right)}$ (6)
where, $\sum H_L$ is the summation of the algebraic headloss in all pipes of the analyzed loop in the water distribution network, and $Q_o$ is the discharge of each pipe in this loop during the hydraulic analysis.
Despite the development of software modeling to solve mathematical equations, some solutions to engineering problems still need much time. This time is consumed in data entry as well as processing and obtaining the final results. The diagram in Figure 2 shows the flowchart of the algorithm, including the time scale matter needed to prepare and analyze networks using the Hardy Cross method.
Figure 2. Time analysis of hardy-cross method
The tremendous development in modeling and simulating engineering problems using modern software has become possible due to the massive computer revolution [12, 13]. Water resources engineering has a large share in modern research and studies that employ software and their application to provide neat solutions [14-17]. Modeling water distribution networks is one of the most common applications in water resources engineering, and many software has been used for this purpose. The U.S. Environmental Protection Agency established the EPANET software to model the flow in water distribution systems [18]. EPANET is a valuable resource for water utilities and engineers to improve the design and operation of water distribution systems, ensure water quality and reliability, and plan for future infrastructure upgrades. It is widely used in the field of civil and environmental engineering for water system analysis and design. Nowadays, EPANET is operated not only in designing and analyzing distribution networks but also in addressing water distribution management issues such as investigating water quality, modeling contamination threats, and evaluating the resilience of natural disaster threats. The Graphical User Interface (GUI) setting of the EPANET software allows the use of the program under the Windows operation system that helps insert data and get results smoothly. EPANET provides full editing mechanisms for the pressurized pipe system and its accessories, such as the pipes, pumps, valves, and reservoirs. Furthermore, the table style and colored figures of the water distribution characteristics under different conditions of operation can be established by the software itself.
In EPANET, a hydraulic model is a representation of a water distribution system that includes all the components and attributes needed to simulate the hydraulic behavior of the system. A hydraulic model in EPANET typically includes the following key components:
Nodes: Nodes represent points in the water distribution system where water can enter, exit, or change direction. Common types of nodes include junctions, tanks, and reservoirs. Junctions are points where pipes intersect, tanks represent storage facilities, and reservoirs are often used for water source modeling.
Pipes: Pipes represent the conduits through which water flows in the distribution system. Each pipe is characterized by attributes such as length, diameter, roughness, and material properties, which influence the hydraulic behavior.
Pumps: Pumps are used to add energy to the system by increasing the pressure and pushing water through the pipes. EPANET allows the user to model different types of pumps, such as constant-speed, variable-speed, and power-function pumps.
Valves: Valves can be used to control the flow and pressure in the system. EPANET supports various types of valves, including control valves, pressure-reducing valves, and check valves.
Tanks and Reservoirs: Tanks and reservoirs store water in the system. Users can model tanks and reservoirs as part of the hydraulic model to account for changes in water levels over time.
Demands: Demands represent the amount of water required at each node in the system. EPANET allows the user to define both constant and time-varying demands.
Quality Parameters: In addition to hydraulic modeling, EPANET can also simulate water quality parameters, such as chlorine concentration. This is important for assessing the transport of contaminants and water quality in the system.
When creating a hydraulic model in EPANET, users have to input data for all these components, specifying their properties, characteristics, and interconnectedness. Users should also define operational parameters, such as pump schedules and valve settings, and set simulation options.
Figure 3. The main window of the EPANET software
Once the hydraulic model is built, users can perform simulations to analyze how the system behaves under various conditions. EPANET can provide information on water flow, pressure, velocity, and water quality at different points in the distribution network. These information are useful for system design, operation, and maintenance, as well as for assessing the impact of system modifications and evaluating water quality compliance with regulations. Figure 3 shows the main window of the EPANET software.
The Hybrid Node Loop (HNL) approach is used in EPANET to solve the continuity and energy loss equations for the water distribution network sequentially [19]. The HNL strategy is modified from the Newton Loop Node Method to enhance the HNL approach, which uses the updated pressure and flows in each junction and pipe from the previous iteration to be used in the next trial of the solution, reducing the calculation processing time [20].
Based on that, each loop's hydraulic characteristics (pressure at junctions and flow in pipes) are calculated simultaneously. For the loop (m), if the $Q_i$ is the flow in pipe (i) and $H_i$ is the headloss in pipe (i), then the head gradient in each pipe $\left(\Delta P_i\right)$ can be calculated by the following equation:
$\left(\Delta P_i\right)_m=\left(\frac{H_i}{Q_i}\right)_m$ (7)
If $\left(P_i\right)$ is the available pressure at the junction in the previous iteration, then the correction of flow in each pipe inside each loop of the water network can be estimated from the following equation:
$\Delta Q_i=\frac{\sum_i \Delta P_i Q_i-\sum_i H_i}{\sum_i \Delta P_i}-P_i$ (8)
Besides the time-consuming, the Hardy-Cross method is not able to mimic a partially looped and branched system, but it needs an equivalent looped system. While the Hybrid Node Loop (HNL) methodology employed in EPANET can handle partially looped and branched systems. This is the most advantageous and resilient feature that makes EPANET lead for applying analysis and design of water distribution networks.
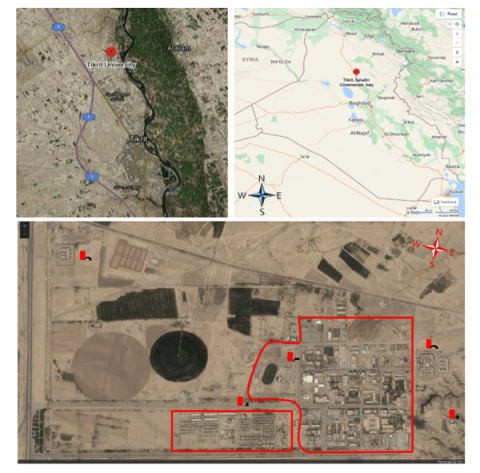
In this portion, to verify the resilience of EPANET software in evaluating the pressure at junctions and water flow in pipes of the water distribution network during different required demands, the water distribution network for the campus of Tikrit University-Iraq was selected. Figure 4 shows the location of the Tikrit University Campus.
The process of analyzing the water network of Tikrit University in this research was carried out in two stages. The data required for the analysis process was collected in the first stage. Initially, the network pipes and their branches within the university building (Zone 5 in Figure 4), faculty residential neighborhood (Zone 4 in Figure 4), the (Boys) student accommodation departments (Zone 3 in Figure 4), and the (Girls) student accommodation departments (Zone 2 in Figure 4), were identified on a satellite map, as well as the pumping station and purification unit (Zone 1 in Figure 4). Then, using the ArcMap program, the length of each pipe for the water distribution network was calculated. The diameters of the pipes and the materials from which the pipes are made were obtained from the Department of Construction and Engineering Projects at the university. Also, the water purification station is the main source for supplying drinking water to the university and its facility. The maximum flow capacity is 175 m3/hr. under operating efficiency of 85% for the pumps corresponding to the provided head pressure equal to 6 bar. Pumping periods for the purification station are only two periods, each lasting 4 hours. The morning period is from 8:00 AM to Noon, and the night is from 2:00 PM to 6:00 PM. Note that the demand and pipeline information was based on the data collected in 2013, which may be subjected to updates nowadays.
Figure 4. Iraq map and Tikrit University Campus location
In the second stage, this data was implemented using the EPANET program and obtaining the results of the hydraulic characteristics (Pressure at junctions and Flow in pipes). After the collected data was inserted into the EPANET program, the simulation of operational conditions for the water distribution network and analysis of all its hydraulic properties were conducted in this part.
Discharge values in the network pipes and pressure values at the junction points within the network during the pumping periods of the purification station were obtained. The hydraulics model shows high resilience that makes the results be interpreted. Besides the time flexibility in inserting the data, calculating the pressures and discharges in the water distribution system was really short of establishing the final results.
5.1 The morning period
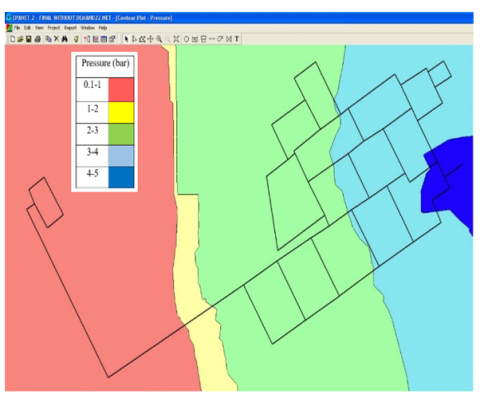
During the morning, the demand will increase in the university's colleges and faculty residential neighborhood. On the other hand, in the student accommodation departments, consumption decreases in these buildings due to students leaving them to join classes at the university. Figure 5 shows the pressure distribution contour lines for the university campus during this period. Based on the finding shown in Figure 5, which determines the pressure distribution values according to the color specified, the distribution of pressure within the university's campus and its faculties is bounded between 2-4 bar. Still, the pressure value decreases automatically upon reaching the north portion's colleges, laboratories, and surrounding fields as the pressure becomes around 1 bar. The same applies to the (Boys) student accommodation departments; one can notice a decrease in the pressure value to be around 1 bar. This pressure drop is due to friction losses through the long series of pipes to reach these zones. While in the faculty residential neighborhood, the pressure value is between 1-2 bar. Also, Figure 6 illustrates the flow distribution in each pipeline in the water distribution network.
Figure 5. Head pressure during morning period
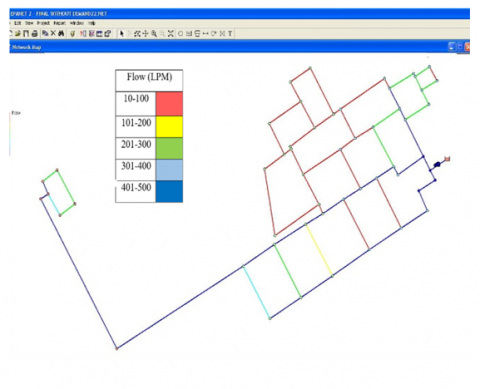
Figure 6. Flow distribution during morning period
From Figure 6, it is noted that the value of flow inside the university spaces and buildings is high, as is the case in the faculty residential neighborhood. The high discharge in pipelines of the network is due to the required demand for water during daily working hours. On the opposite, one can notice that the value of discharge is low in the areas surrounding the student accommodation departments (Boys and Girls) because demand is little and students are not attending in these buildings at that period of the day.
5.2 The night period
The demand will decrease in the colleges and university buildings when the students and faculty members leave the campus buildings, and many students will return to the student accommodation departments. In fact, the faculty residential neighborhood of the university will remain under regular flow demand. Figure 7 shows the pressure distribution contour lines for the university campus during this period.
Figure 7. Head pressure during night period
Based on the finding shown in Figure 7, pressure distribution within the faculty residential neighborhood increases during this period due to the discontinuation of utilizing the water inside the university's campus, which is bounded between 2-3 bar. Still, the pressure value decreases automatically upon reaching the Northwest portion of the campus, the (Boys) student accommodation departments; one can notice a decrease in the pressure value to be around 1 bar. This pressure drop is due to friction losses through the long series of pipes to reach these zones. While in (Girls) student accommodation departments, the pressure value is between 3-4 bar.
Figure 8. Flow distribution during night period
Figure 8 illustrates the flow distribution in each pipeline in the water distribution network. It is noted that the discharge value becomes too high in the areas surrounding the student accommodation departments (Boys and Girls), because it requires further demand, and students are attending in these buildings at that period of the day. On the contrary, the value of flow inside the university spaces and buildings is lower than in the morning period due to the discontinuation of using the water.
The hydraulics model results show that most university buildings will be under satisfactory pressure and flow during working hours in the morning. However, the student accommodation departments for boys in the northwest portion of the campus will be provided water with low pressure in both morning and night periods of pumping operation.
Nowadays, as a result of the water crisis worldwide, mathematics applications in the field of water resources engineering bring a wide horizon of solutions significantly. In order to reach effective management, water resources require a real and resilient analysis that leads to solutions for problems of the pressure and flow of water within the distribution networks. Thus, this study shows the applicability of utilizing a numerical mathematical solution in the shape of a hydraulics model to handle the issues of analyzing water distribution networks. The Hybrid Node Loop (HNL) approach is used in EPANET software to solve the continuity and energy loss equations for the water distribution network sequentially. The Tikrit University-Iraq campus stands as a case study to inspect the resilience of the EPANET model's performance in evaluating the water distribution system under variable demand. The information on pipeline characteristics and water demand on the university campus was collected. The hydraulics model results show that most university buildings will be under satisfactory pressure and flow during working hours in the morning. However, the student accommodation departments for boys in the northwest portion of the campus will be provided water with low pressure in both morning and night periods of pumping operation. In addition to providing higher-efficiency pumps, there are many solutions to the problem of dropped pressure in network pipes, including performing simulations within the EPANET program for pipes with alternative diameters and observing the improved hydraulic performance of the network.
Further future work can be handled to enhance the findings of this study. Even if the available data can provide an acceptable vision for analysis of the water distribution network, updated information about the pipeline is still required. Also, new pumps can be designed for this network to find the optimal flow behavior inside the water distribution network. Furthermore, one feature of the EPANET software is simulating the remaining chlorides in the water network; thus, one can compare the model finding with some measured data from campus.
[1] Berglund, E.Z., Pesantez, J.E., Rasekh, A., Shafiee, M.E., Sela, L., Haxton, T. (2020). Review of modeling methodologies for managing water distribution security. Journal of Water Resources Planning and Management, 146(8). https://doi.org/10.1061/(ASCE)WR.1943-5452.0001265
[2] Cabrera, E., Vela, A.F. (1995). Improving Efficiency and Reliability in Water Distribution Systems. Kluwer Academic Publisher, Netherlands.
[3] Giustolisi, O., Berardi, L., Laucelli, D. (2011). Generalizing WDN simulation models to variable tank levels. Journal of Hydroinformatics, 14(3): 562-573. https://doi.org/10.2166/hydro.2011.224
[4] Beal, C.D., Stewart, R.A., Fielding, K. (2013). A novel mixed method smart metering approach to reconciling differences between perceived and actual residential end use water consumption. Journal of Cleaner Production, 60: 116-128. https://doi.org/10.1016/j.jclepro.2011.09.007
[5] Filik, Ü.B., Gerek, Ö.N., Kurban, M. (2011). A novel modeling approach for hourly forecasting of long-term electric energy demand. Energy Conversion and Management, 52(1): 199-211. https://doi.org/10.1016/j.enconman.2010.06.059
[6] Al-Juhaishi, E.H.K. (2020). Novel approaches for constructing persistent Delaunay triangulations by applying different equations and different methods. Doctor dissertation. Missouri University of Science and Technology.
[7] Moosavian, N., Jaefarzadeh, M.R. (2014). Hydraulic analysis of water distribution network using shuffled complex evolution. Journal of Fluids, 979706. https://doi.org/10.1155/2014/979706
[8] Steel, E.W., McGhee, T.J. (1979). Water Supply and Sewerage. McGraw-Hill Book Company, New York, USA.
[9] Mohamme-Ali, W.S., Khaleel, E.H. (2023). Assessing the feasibility of an explicit numerical model for simulating water surface profiles over weirs. Mathematical Modelling of Engineering Problems, 10(3): 1025-1030. https://doi.org/10.18280/mmep.100337
[10] Cross H. (1936). Analysis of flow in networks of conduits or conductors. University of Illinois Engineering Experiment Station Bulletin, 286.
[11] AL-Juhaishi, E.H.K. (2022). Solving some linear equations by using enhanced theorem. In VI International Scientific Congress of Pure, Applied and Technological Sciences, pp. 566-579.
[12] Mohammed-Ali, W.S., Khairallah, R.S. (2022). Review for some applications of riverbanks flood models. IOP Conference Series: Earth and Environmental Science, 012039. https://doi.org/10.1088/1755-1315/1120/1/012039
[13] Mohammed-Ali, W.S. (2011). The effect of middle sheet pile on the uplift pressure under hydraulic structures. European Journal of Scientific Research, 65(3): 350-359.
[14] Mohammed-Ali, W.S., Khairallah, R.S. (2023). Flood risk analysis: The case of Tigris River (Tikrit/Iraq). Tikrit Journal of Engineering Sciences, 30(1): 112-118. https://doi.org/10.25130/tjes.30.1.11
[15] Mohammed-Ali, W., Mendoza, C., Holmes, R.R. (2021). Riverbank stability assessment during hydro-peak flow events: The lower Osage River case (Missouri, USA). International Journal of River Basin Management, 19(3): 335-343. https://doi.org/10.1080/15715124.2020.1738446
[16] Mohammed-Ali, W.S. (2012). Hydraulic characteristics of semi-elliptical sharp-crested weirs. International Review of Civil Engineering (IRECE), 3(1): 42-46 .
[17] Mohammed-Ali, W., Mendoza, C., Holmes Jr, R.R. (2020). Influence of hydropower outflow characteristics on riverbank stability: Case of the lower Osage River (Missouri, USA). Hydrological Sciences Journal, 65(10): 1784-1793. https://doi.org/10.1080/02626667.2020.1772974
[18] The U.S. environmental protection agency. EPANET Software. https://www.epa.gov/, accessed on Oct. 19, 2023.
[19] Rossman, L.A. (2000). EPANET 2: Users manual. Water Supply and Water Resources Division, National Risk Management Research Laboratory, Cincinnati, OH, USA. http://personales.upv.es/piglesia/descarga/en2manual.pdf.
[20] Osiadacz, A. (1987). Simulation and Analysis of Gas Networks. U.S. Department of Energy, Office of Scientific and Technical Information, United States.