Gadis M. Prinandhika*![]() | Supriyadi Supriyadi
| Supriyadi Supriyadi![]() | Purwanto Purwanto
| Purwanto Purwanto![]() | Widyatmani S. Dewi
| Widyatmani S. Dewi![]()
© 2023 IIETA. This article is published by IIETA and is licensed under the CC BY 4.0 license (http://creativecommons.org/licenses/by/4.0/).
OPEN ACCESS
Assessing soil quality is integral to determining the appropriateness of soil management practices. Agroforestry, a tillage system that strategically integrates tree plantations with annual crops, has a potential impact on soil quality through the augmentation of soil organic matter derived from litter deposited on the soil surface. This study aims to calculate the soil quality index and evaluate the soil quality status across various agroforestry types. The research was conducted in Sumberejo Village, Batuwarno District, Wonogiri Regency, Indonesia, focusing on distinct agroforestry types: teak agroforestry, mahogany agroforestry, mixed agroforestry, and dry land—representing an area where agroforestry systems are not implemented. Fourteen indicators were utilized for the assessment, and subsequent Principal Component Analysis was employed to select the Minimum Data Set. The chosen indicators included soil macrofauna diversity index, cation exchange capacity (CEC), available soil phosphorus (P), total soil nitrogen (N), soil organic carbon (C), soil moisture, base saturation (BS), available soil potassium (K), particle density, pH, and porosity. The findings reveal that the soil quality across all four types of agroforestry is low, with mahogany agroforestry exhibiting the highest soil quality index at 0.35. The soil quality index for teak agroforestry, mixed agroforestry, and dry land was 0.33 each. The study concludes that the primary determinant of soil quality is the cation exchange capacity (CEC).
Principal Component Analysis, minimum data set, soil quality index, soil quality, teak agroforestry, mahogany agroforestry, mixed agroforestry, dry land
Sumberejo Village, characterized by its undulating and hilly topography and layered limestone geological structure, was initially dominated by vacant land [1]. As the study [1] reported, community forestry development commenced in 1972, and 1977 widespread greening efforts were undertaken. Given the significant land use changes over time, it is crucial to conduct soil quality research to ascertain the changes experienced by the soil and determine appropriate tillage systems. Changes in tillage practices and land use have the potential to alter the physical, chemical, and biological properties of the soil [2], which are key determinants of soil quality.
Soil quality, defined as the soil's capacity to maintain crop productivity, air quality and availability, and support human activities and health [3], plays a significant role in crop productivity and soil health [4, 5]. Objective assessment of soil quality can be achieved through indicators of soil's physical, chemical, and biological properties, with each soil indicator influencing the others due to changes in land use and treatment [2, 6, 7]. Soil quality is quantitatively calculated by extracting minimum data through Principal Component Analysis (PCA) [2], which involves selecting an index that best represents soil function and integrating the score into the soil quality index [8]. The PCA method groups soil properties into Principal Components (PC) and selects representative indicators [9].
Forest management can affect soil quality and the sustainability of the ecosystem [10]. Agroforestry, a land treatment system that merges agricultural and forestry crops, contributes to soil aggregate formation [1, 11, 12]. The tree canopy in agroforestry systems protects against soil erosion, while the roots prevent nutrient leaching. Agroforestry offers various types of land cover, each producing a different quality litter, which serves as a source of soil organic matter [13, 14]. Incorporating organic matter into the soil through agroforestry systems can enhance soil fertility due to organic matter's role in the nutrient cycle, which increases nutrient availability in the soil [13, 15]. Additionally, agroforestry requires less fertilizer and pesticide input and produces more litter, contributing to the soil's organic matter [9].
Plant diversity in agroforestry systems has positively impacted soil health, land productivity, and fine root production [16-18]. Litter decomposition depends on complex relationships between soil macrofauna, microorganisms, climate, and litter quality [12]. Organic matter influences soil macrofauna under different land uses [9], and litter, as a major factor, increases the abundance and diversity of soil macrofauna by providing habitat and food sources [6, 9]. The excretion from macrofauna attracts beneficial microbes, interacts with plants, and improves the process of organic matter decomposition and nutrient solubility, thereby enhancing soil quality [6, 7, 19].
Assessing soil quality in agroforestry is vital to determine the impact of tillage and recommend suitable tillage practices to improve soil quality [19, 20]. The present study aims to calculate the soil quality index and status in various types of agroforestry and identify soil quality indicators determining soil quality and acting as limiting factors. The research focuses on several agroforestry types, namely teak agroforestry, mahogany agroforestry, mixed agroforestry, and dry land agroforestry, which serves as a comparison with annuals that do not implement agroforestry systems.
2.1 Description of the studied area
The research was conducted in Sumberejo Village, Batuwarno District, Wonogiri Regency, Indonesia. Sumberejo Village has an area of 547 Ha. Geographically, the research location is located at 7° 58' 8.7'' South Latitude and 110° 58' 27.4'' East Longitude. Based on the geological map, the soil type includes Mediterranean litosol association soil, acid brown, made from the parent volcanic tuff with volcanic physiography and folded hills. The climatic condition of Sumberejo Village is a dry climate, Schmidt-Ferguson climate type D classification with moderate category (60< Q <100), Q is the comparison value between the average number of dry months and the average number of wet months [21], with an average annual rainfall of 2,108 mm and an annual rainy day of 160 days. Sumberejo Village has an undulating and hilly topography with layered limestone geological structures. The soil solum is very thin and shallow. The bottom layer is rock. The slope of Sumberejo Village's land is quite high (> 40%) because it is in a mountainous area and is prone to erosion.
Teak agroforestry with teak dominant vegetation (Tectona grandis) has a lifespan of ±15-20 years with a percentage of teak header density of 16.65% or rarely. In mahogany agroforestry with mahogany dominant vegetation (Swietenia mahagoni), plants have a lifespan of ±15 years with a heading density percentage of 30.19% or rarely. Mixed agroforestry is land that implements an agroforestry system with diverse vegetation. Ground cover vegetation in the form of grass, there are several types of plants, namely teak, mahogany, acacia (Acacia), silk tree (Paraserianthes falcataria), and banana (Musa acuminata). The average age of teak, mahogany, acacia, and silk trees is ±15 years, and the percentage of header density is 4.34% or rarely. Dry land is planted with cassava with maize crop rotation. A map of land use and soil sampling points is presented in Figure 1.
Figure 1. Land use map and soil sampling points
2.2 Soil sampling
This study used a descriptive exploratory research method with a variable approach to the survey method supported by laboratory analysis results. Analysis of soil quality indicators consists of analyzing soil chemical properties, physical properties, and biological properties. Sample selection used a random purposive sampling technique. Random purposive sampling, namely random selection of samples with specific considerations [22]. Soil sampling for each type of land was carried out at 5 sampling points. Soil sampling takes the topsoil with a 0-20 cm depth. They took soil samples for microbial biomass carbon analysis by taking fresh soil in plastic and storing it in a coolbox. Then, the soil samples were brought to the laboratory for analysis.
2.3 Physical analysis
The physical properties of soil used as an indicator of soil quality are soil texture with the pipette method, soil humidity with the gravimetric method, bulk density (BD) with the earthen lump method, particle density (PD) with the pycnometer method, and porosity the method used refers to the study [23]. Porosity describes the percentage of pores in the soil, the rate of total pores occupied by water and air, compared to the total volume of the soil. Porosity can be determined by analyzing the bulk density and particle density in Eq. (1) below.
$n=\left(1-\frac{P D}{B P}\right) \times 100 \%$ (1)
where, n is porosity, BD is bulk density, and PD is particle density.
2.4 Chemical analysis
The chemical properties of soil used to indicate soil quality are pH (H2O) by the electrometric method and soil total nitrogen by the Kjeldahl method. Organic nitrogen compounds are oxidized in a concentrated sulfuric acid environment with a Selene mixture as a catalyst to form (NH4)2SO4. Soil available P was analyzed using the Olsen method, soil available K, cation exchange capacity (CEC), and base saturation using the ammonium acetate 1 N extraction method. As well as organic carbon by the Walkley and Black method, the method used refers to the study [24]. Base saturation is calculated below by calculating the number of bases (Ca2+, Mg2+, K+, and Na2+) in Eq. (2).
$B S=\frac{\text { total base cations }}{C E C} \times 100 \%$ (2)
where, BS is base saturation, and CEC is cation exchange capacity.
2.5 Biological analysis
The biological properties of soil used as an indicator of soil quality are soil respiration using the Verstraete modification method by covering the soil surface using a jar given a flacon containing 10 ml of 0.1N KOH. The quantity of C-CO2 resulting from measurements in the field for ±12 hours was determined by titration. Measuring biomass carbon by the Fumigation and Extraction Method, fumigation with chloroform kills and dissolves microbial cells by releasing the cytoplasm into the soil environment. Soil samples were extracted with 100 ml of 0.5 M K2SO4. The method used refers to the study [24]. Identification of soil macrofauna using the pitfall trap methods. The calculation of soil macrofauna diversity uses Shannon Wiener’s diversity index and refers based on reference [18]. The formula for calculating the soil macrofauna diversity index is in Eq. (3) below.
$H^{\prime}=\left(-\sum \frac{n i}{N} \log \frac{n i}{N}\right)$ (3)
where, H' is the species diversity index, ni is the number of individuals of each species, and N is the number of all individuals.
2.6 Soil quality index
The analysis of the soil quality index consists of several stages [25]. The first stage selects the indicators to be used. MDS indicators must meet five criteria: they are easily measured by anyone, not just someone who is an expert in the field with a relationship to processes in the ecosystem. It can be used to predict other soil parameters that are difficult to measure and volatile in response to land use [13]. Next, test the correlation to find out which indicators are correlated. If correlated is used as a Minimum Data Set (MDS), but not all correlated indicators are used as MDS, Principal Component Analysis (PCA) testing is carried out to determine the indicators that affect soil quality. The PCA test produces a principal component (PC) value. The selected PC value is a value that has an eigenvalue of ≥ 1. Each PC has indicators selected as MDS, the highest value on each PC. Next, the MDS indicator is calculated by the weight index (Wi) with the calculation of the proportion divided cumulatively. Furthermore, the MDS indicator is scored (Si) concerning the base of the study [25]. The soil quality index is calculated by calculating the weight index (Wi) value multiplied by the score of the selected indicator (Si).
$S Q I=\sum_{i=1}^n 1=W i \times S i^n$ (4)
where, SQI is the soil quality index, Wi is the weight index, Si is the selected indicator scores, and n is the number of soil quality indicators. The criteria for soil quality class refer to study [26] that soil quality index values of 0.8-1 are considered very high, 0.6-0.79 high, 0.4-0.59 moderate, 0.2-0.39 low, and 0.0-0.19 very low.
2.7 Data analysis
Data analysis was carried out using the Minitab 18 and SPSS 25 applications. The research data was carried out with the Kolmogorov-Smirnov normality test by comparing the data distribution with the standard normal distribution. Furthermore, an Analysis of Variance (ANOVA) test was carried out to test the similarity of the average data.
If the data have a real effect, continue Duncan's Multiple Range Test (DMRT) to determine the difference in the average individual parameters at the signification P < 0.05 level. In order to reach out the relationship between quality indicators and other indicators, the Pearson Correlation test is carried out.
3.1 Characterization of data set
The results of the analysis of soil physics indicators on the four types of land are presented in Table 1.
Table 1. Results of the analysis of indicators of soil physics in various types of agroforestry
|
Soil Physics Indicators |
Land Type |
|||
|
Teak |
Mahogany |
Mixed |
Dry Land |
|
|
Soil texture Sand (%) Clay (%) Dust (%) |
Clay 33.6 63.8 2.6 |
Clay 35.2 51 13.9 |
Clay 27.8 57.6 14.6 |
Sandy Clay 46.6 44 9 |
|
BD (gr/cm3) |
1.1 ± 0.1b |
1.1 ± 0.0b |
1.1 ± 0.1b |
1.2 ± 0.0a |
|
SH (%) |
11.1 ± 0.7b |
13.8 ± 0.4a |
10.6 ± 0.7b |
11.3 ± 0.6b |
|
PD (gr/cm3) |
2.5 ± 0.2a |
2.3 ± 0.1b |
2.4 ± 0.1ab |
2.3 ± 0.1ab |
|
Porosity (%) |
54.6 ± 1.3a |
50.7 ± 2.8b |
52.4 ± 2.1ab |
47.2 ± 2.0c |
Notes: BD=Bulk Density, SH=Soil Humidity, PD=Particle Density.
Numbers followed by different letters show significant differences on the DMR test.
The soil texture in teak, mahogany, and mixed agroforestry is clay, while on dry land, the soil texture is classified as sandy clay. Soil texture affects the ability to retain water and nutrient absorption because it affects the roots' movement in the soil [27]. The bulk density of the soil of four lands ranges from 1.1 - 1.2 gr/cm3, and the bulk density of mineral soil ranges from 0.6 - 1.4 gr/cm3 [21]. Bulk density indicates the density of the soil. The denser the soil, the higher the bulk density, which results in impaired aeration and drainage and affects the growth of plant roots [28, 29].
The highest soil humidity in mahogany agroforestry was 13.84%, and the lowest in mixed agroforestry was 10.67%. The particle density of the soil in all four lands ranges from 2.3 - 2.5 gr/cm3. Soils with lower particle density have more total pore space and are loose [30]. Porosity ranges from 47 - 54%, the highest priority in teak agroforestry because tillage is rarely carried out, and the agroforestry system has a solid root system as support and counterweight. The lowest portion in dry land is because vegetation does not cover the soil surface, so it cannot block raindrops [31]. The results of the analysis of soil chemistry indicators on the four types of land are presented in Table 2.
The results of pH measurement H2O in teak, mahogany, and dry land were 7.9, 7.7, and 8.1 respectively, including the slightly alkaline category, while in agroforestry, a mixture of soil pH 7.1 was included in the neutral category. If the number of H+ ions exceeds the number of OH- ions, it is sour, and vice versa. If the number of OH- ions exceeds the H+ ions, it is alkaline [28]. The total nitrogen content of the soil in teak and mahogany agroforestry is high at 0.6% and 0.7%. The result is mixed agroforestry and dry land. The soil total nitrogen content of the total soil N is medium, which is 0.4%. The soil's organic matter affects the soil's total nitrogen content. If the soil organic matter is high, the soil's total nitrogen content is also high, and vice versa. Vegetation and the speed of decomposition influence the change in the soil's total nitrogen content [28].
Table 2. Results of the analysis of indicators of soil chemistry in various types of agroforestry
|
Soil Chemistry Indicators |
Land Type |
|||
|
Teak |
Mahogany |
Mixed |
Dry Land |
|
|
pH (H2O) |
7.9 ± 0.5a |
7.7 ± 0.1a |
7.1 ± 0.2b |
8.1 ± 0.2a |
|
N (%) |
0.6 ± 0.0b |
0.7 ± 0.0a |
0.4 ± 0.1c |
0.4 ± 0.0c |
|
P (ppm) |
16 ± 1.3ab |
17.4 ± 1.4a |
14.7 ± 0.6b |
14.6 ± 0.5b |
|
K (mg/100g) |
4.4 ± 0.3b |
4.4 ± 0.8b |
3.8 ± 0.3b |
5.4 ± 0.9a |
|
SOC (%) |
2.4 ± 0.6c |
4.2 ± 0.4a |
2.2 ± 0.5c |
3.1 ± 0.2b |
|
CEC (cmol+/kg) |
25 ± 1.1bc |
34.7 ± 0.7a |
26.4 ± 1.1b |
24.3 ± 0.4c |
|
BS (%) |
50 ± 7.7b |
44 ± 4.2bc |
40 ± 5.3c |
63 ± 2.9a |
Notes: N=soil total nitrogen, P=soil available phosphorus, K=soil available potassium, SOC=Soil Organic Carbon, CEC=Cation Exchange Capacity, BS=Base Saturation.
Numbers followed by different letters show significant differences on the DMR test.
Soil available P results range from 14-17 ppm, including medium and high categories. Mahogany agroforestry has the highest P content (17.4 ppm). According to the study [28], the pH value strongly influences P availability in the soil because alkaline cations dominate the ion exchange complex. Hence, the nutrient exchange is quite effective at a neutral pH. The soil available K analysis results ranged from 3 - 5 mg/100g, including the very low category, soil available K highest on dry land, due to the addition of K from fertilizer. K is available concerning CEC, a high CEC that will increase the soil's ability to withstand K, and the soil solution slowly releases K and lowers the leaching potential of K [28].
Mahogany agroforestry produced the highest CEC of 34.73 cmol(+)/kg (high) and the lowest CEC on the dry land of 24.26 cmol(+)/kg (medium). CEC is low because the process of nutrient absorption by soil colloids does not take place intensively and is easily washed off [29]. Base saturation ranges from 40 - 65%, with dry land with the highest base saturation (63%) and the lowest in mixed agroforestry (40%). The high value of base saturation indicates that the ion exchange complex is dominated by alkaline cations [30]. The results of the analysis of soil biology indicators on the four types of land are presented in Table 3.
Table 3. Results of the analysis of indicators of soil biology in various types of agroforestry
|
Soil Biology Indicators |
Land Type |
|||
|
Teak |
Mahogany |
Mixed |
Dry Land |
|
|
MBC (ppm) |
1.1 ± 0.6a |
0.9 ± 0.5a |
0.6 ± 0.2a |
0.7 ± 0.3a |
|
SR (Mg jam-1m-2) |
25.9 ± 8a |
27.2 ± 8.4a |
27 ± 5a |
22.5 ± 1.4a |
|
MD (H’) |
1.82a |
2.07a |
1.65a |
2.07a |
Notes: MBC=Microbial Biomass Carbon, SR=Soil Respiration, MD=Soil Macrofauna Diversity Index.
Numbers followed by different letters show significant differences on the DMR test.
The analysis results of carbon microbial biomass range from 0.6 - 1 ppm. Teak agroforestry produces the highest microbial biomass C (1.1 ppm). Microbial biomass C responds well to changes in soil properties and environmental conditions [31, 32]. The C content of soil microbes is relatively small compared to soil carbon. Biomass microorganisms are a living part of soil organic matter, namely bacteria, fungi, algae, and protozoa [33]. Soil respiration ranges from 25 - 45 mg hour-1m-2. Soil respiration is highest in mixed agroforestry (43.32 mg hour-1m-2) and lowest in dry land (25.27 mg hour-1m-2). Soil respiration is the total CO2 removal from the soil surface and the decomposition of soil organic matter by microbes [34]. Changes in soil organic matter content will affect soil respiration; soil respiration rate indicates the level of activity of microorganisms in the soil [35, 36].
The highest macrofauna diversity index is found in mahogany and dry land agroforestry with an H' index value of 2.07 each, and mixed agroforestry with the lowest macrofauna diversity index with an H' index value of 1.65. According to a study [18], if the value of Shannon Wiener diversity (H' <1), then diversity is low, while (1< H' <3), then diversity is medium, and (H' >3), then diversity is high. The four types of land show a moderate diversity of abundant species because the value of H' ranges between 1 ≤ H' ≤3. Soil macrofauna plays a role in the process of decomposition and aggregation, increases soil aeration and nutrient cycling, and sustains the supply of nutrients in the long term [37].
3.2 Minimum data set
A correlation test carries out each indicator of soil physics, soil chemistry, and soil biology to determine the relationship between parameters. The results of the correlation test between soil quality indicators are presented in Table 4.
The results of the correlation test between parameters are presented in Table 4. The correlation of soil macrofauna diversity with soil organic C is positively correlated (r=0.714). These conditions indicate that the more soil organic C content, the more soil macrofauna diversity will increase. According to a study [38], adding organic matter can increase the diversity of soil macrofauna, especially earthworms. The correlation of macrofauna diversity with soil pH is positively correlated (r=0.617). These conditions suggest soil pH affects soil macrofauna diversity. The study [6] shows that soil macrofauna diversity positively correlates with soil pH.
Table 4. Correlation test results between soil quality parameters
|
|
14 |
1 |
2 |
3 |
4 |
5 |
||
|
1 |
0.531* |
|
|
|
|
|
||
|
2 |
0.492 |
-0.326 |
|
|
|
|
||
|
3 |
0.638** |
-0.008 |
0.572** |
|
|
|
||
|
4 |
0.301 |
0.697** |
-0.289 |
-0.043 |
|
|
||
|
5 |
0.362 |
0.812** |
-0.252 |
0.067 |
0.683** |
|
||
|
6 |
-0.548** |
0.033 |
-0.430 |
-0.477* |
0.230 |
0.202 |
||
|
7 |
-0.380 |
-0.235 |
-0.007 |
-0.273 |
0.123 |
-0.009 |
||
|
8 |
0.000 |
0.032 |
-0.091 |
0.068 |
0.232 |
0.011 |
||
|
9 |
0.617** |
0.075 |
0.530* |
0.618** |
0.179 |
0.226 |
||
|
10 |
0.714** |
0.747** |
-0.068 |
0.352 |
0.494* |
0.512* |
||
|
11 |
0.047 |
0.165 |
-0.131 |
0.041 |
0.336 |
0.340 |
||
|
12 |
0.603** |
0.836** |
-0.067 |
0.105 |
0.635** |
0.674** |
||
|
13 |
-0.133 |
0.095 |
-0.050 |
-0.247 |
0.181 |
0.174 |
||
|
|
6 |
7 |
8 |
9 |
10 |
11 |
12 |
|
|
7 |
0.486* |
|
|
|
|
|
|
|
|
8 |
0.067 |
0.212 |
|
|
|
|
|
|
|
9 |
-0.319 |
0.147 |
0.113 |
|
|
|
|
|
|
10 |
-0.378 |
-0.265 |
0.069 |
0.234 |
|
|
|
|
|
11 |
0.231 |
0.068 |
0.210 |
0.351 |
-0.168 |
|
|
|
|
12 |
-0.189 |
-0.414 |
0.108 |
0.000** |
0.693 |
-0.011 |
|
|
|
13 |
-0.002 |
0.108 |
-0.220 |
0.078 |
-0.288 |
0.339 |
0.075 |
|
Notes: *=significant (P=0.05-0.01), **=very significant (P=< 0.01), 1=Cation Exchange Capacity (CEC), 2=Base Saturation (BS), 3=Soil available K, 4=Soil available P, 5=Soil total N, 6=Porosity, 7=Bulk density, 8=Particle density, 9=pH, 10=Soil organic C, 11=Microbial biomass C, 12=Soil humidity, 13=Respiration, 14=Soil macrofauna diversity index.
The correlation of soil organic C with soil humidity is positively correlated (r=0.693). This condition is related to the decomposition of organic matter, the most productive condition of the decomposer in damp conditions with sufficient oxygen supply available, so that when the soil moisture increases, the organic C content increases [34]. The results of the correlation of organic C with CEC are positively correlated (r=0.747). This condition shows that the organic C content in the soil is high, so the CEC also increases because soil organic C plays a role in increasing CEC through the activation of the carboxyl group [38]. Soil total N with organic C positively correlated (r=0.512). According to the study [39], low total N values are associated with decreased organic matter content as a source of N in soils.
The correlation of soil organic C with soilavailable Pis positively correlated (r=0.494), so if the organic C content is high, then the soil's available P content also increases [40]. This condition happens because organic matter produces organic acids, which have organic anions that play a role in the binding of Al, Fe, and Ca ions from soil solutions, so that the availability of P in the soil increases [31]. Soil pH is positively correlated with BS (r=0.53). This corresponds to the study's statement [41] that the decrease in bases in the soil exchange complex results in alkaline saturation also decreasing. The higher the soil pH, the higher the BS is, and vice versa [34]. Soil pH is positively correlated with soil available K (r=0.618). This condition indicates that if the soil pH is neutral, the availability of K elements in the soil increases. According to the study [42], the availability of K elements in the soil tends to decrease with soil pH.
After the correlation test between soil quality indicators, then soil quality indicators are carried out Principal Component Analysis tests to obtain the Minimum Data Set and determine indicators that affect soil quality and limiting factors in soil quality. This study used PC 1 to PC 4 because the eigenvalue value was ≥ 1 with a compulsive level of 78%, meaning that 14 indicators were reduced to 11. The results of the Minimum Data Set analysis using the Principal Component Analysis are presented in Table 5 below.
Table 5. Results of the analysis of the minimum data set use the Principal Component Analysis
|
Eigenvalue |
4.4961 |
3.6527 |
2.0005 |
1.3755 |
|
Proportion |
0.300 |
0.244 |
0.133 |
0.092 |
|
Cumulative |
0.300 |
0.543 |
0.677 |
0.768 |
|
Eigenvectors Variable |
PC1 |
PC2 |
PC3 |
PC4 |
|
MD |
0.396* |
0.267 |
-0.041 |
-0.019 |
|
CEC |
0.401* |
-0.246 |
0.109 |
-0.046 |
|
BS |
0.030 |
0.451* |
-0.215 |
-0.072 |
|
Soil Available K |
0.203 |
0.402* |
-0.166 |
0.107 |
|
Soil Total N |
0.347* |
-0.271 |
-0.118 |
-0.073 |
|
Soil Available P |
0.313 |
-0.309 |
-0.164 |
0.084 |
|
Porosity |
-0.150 |
-0.406* |
-0.155 |
0.179 |
|
Particle Density |
-0.163 |
-0.166 |
-0.402* |
0.279 |
|
Bulk Density |
0.048 |
-0.066 |
-0.208 |
0.596 |
|
pH |
0.201 |
0.260 |
-0.501* |
0.002 |
|
Soil Organic C |
0.402* |
0.033 |
0.209 |
0.203 |
|
MBC |
0.078 |
-0.167 |
-0.496 |
-0.165 |
|
Soil Humidity |
0.403* |
-0.123 |
0.199 |
-0.059 |
|
SR |
-0.006 |
-0.161 |
-0.250 |
-0.657* |
Notes: MD=Soil Macrofauna Diversity Index, CEC=Cation Exchange Capacity, BS=Base Saturation, Soil available K=Soil available potassium, Soil available P=Soil available phosphorus, MBC=Microbial Biomass Carbon, SR=Soil Respiration, *=PC value of the selected Minimum Data Set.
The indicators selected as the minimum data set correlate with other soil quality indicators and have the highest PC value. The chosen indicators from PC 1 are macrofauna diversity, CEC, soil total nitrogen, soil organic carbon, and soil humidity. The indicators of PC 2 selected are BS, soil available K, and porosity. The indicators of the selected PC 3 are particle density and pH, and the indicators of the selected PC 4 are soil respiration. PC 1 shows a proportion value of 0.3, which means that the indicator on PC 1 has a total influence of 30% on the soil quality index. PC 2, with a proportion value of 0.244, means that the indicator on PC 2 has a total influence of 24.4% on the soil quality index. PC 3, with a proportion value of 0.133, means that the indicator on PC 3 has a total influence of 13.3% on the soil quality index, and PC 4, with a proportion value of 0.092, means that the indicator on PC 4 has a total influence of 9.2% on the soil quality index.
3.3 Soil quality index
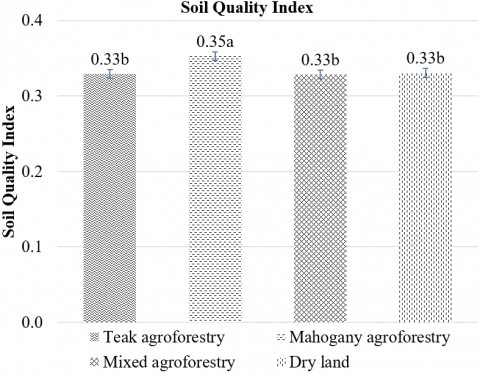
The minimum data set is calculated index weight by dividing the proportion value by cumulative. Then, each minimum data set is scored (Si), which refers to the study [25]. The soil quality index is obtained by multiplying the index weight by scoring. The results of the calculation of the soil quality index are presented in Figure 2.
Based on Figure 2, mahogany agroforestry's highest soil quality index was 0.35, and the soil quality index in teak agroforestry, mixed agroforestry, and dry land was 0.33. Based on the soil quality class, which refers to the study [31], the soil quality of the four types of agroforestry is low because the soil quality index ranges from 0.2 - 0.39.
Figure 2. Soil quality index on agroforestry types
Note: Numbers followed by different letters show significant differences on the DMR test.
ANOVA shows that the agroforestry type significantly affects the soil quality index (p-value=0.03). The type of agroforestry significantly affects the soil quality index, meaning that the type of agroforestry affects soil quality. According to the study [3], tillage can change soil quality. The highest soil quality index in mahogany agroforestry has a wide header and produces a lot of litter. According to the study [35], the denser the vegetation and the no-tillage are carried out, the better the soil quality. The dry land soil quality index is low because tillage is often carried out for crop rotation. According to the study [43], low soil quality is associated with decreased crop biomass inputs and continuous tillage.
The determinants of soil quality are determined from the results of the ANOVA test indicator with soil quality index. The determinants of soil quality have a real effect on the soil quality index. To improve the soil quality index, soil processing can be carried out based on determining factors, namely CEC (p-value 0.01). CEC can improve the soil quality index. According to the study [33], CEC describes the number of cations that are trapped or released from the surface of colloidal clay or humus. CEC is closely related to soil organic matter. Increasing CEC by adding soil organic matter will improve the soil's negative charge and produce organic acids from decomposition results. CEC in teak and mahogany agroforestry is high, while mixed and moor agroforestry is classified as medium. Agroforestry can increase the content of organic matter by allowing litter on the soil surface to decompose.
In addition to the determinants of soil quality, the calculation of the soil quality index can determine the limiting factors of soil quality, namely quality indicators that are not selected to be the minimum data set. These factors are soil available P, bulk density, and microbial biomass C. To increase the soil quality index by carrying out land processing that focuses on improving and increasing the limiting factors of soil quality indicators. Plants absorb P in the form of H2PO4-, influenced by the pH of the soil around the roots. Plants most easily absorb phosphate at a neutral pH of 6-7. According to a study [33], P in the soil comes from organic matter, from the process of decomposition of organic matter and trace bodies that dissolve and enter the soil. Agroforestry produces a variety of litter that will be decomposed to increase soil organic matter.
Increasing microbial biomass C in community forests can be done by leaving litter on the soil surface. Litter is a source of food for microorganisms through the decomposition process, organic material is a source of energy for soil microorganisms. Minimizing tillage increases microbial biomass by protecting soil aggregates formed by fungi. Pore space in aggregates is an important habitat for microbial biomass in soil. And the return of plant residues at harvest also increases microbial biomass, due to the return of organic matter in the soil.
The highest soil quality index in mahogany agroforestry was 0.35, and in teak agroforestry, mixed agroforestry, and dry land, each was 0.33. The soil quality of the four types of agroforestry is low because the soil quality index ranges from 0.2-0.39. Soil tillage can be carried out based on determining factors, namely CEC tillage, to improve CEC in agroforestry by allowing waste on the soil surface to decompose, thereby increasing the organic matter content of the soil. Agroforestry can increase the content of organic matter by allowing litter on the soil surface to decompose. The soil quality index must be improved by tillage based on soil quality limiting factors, namely P available soil. Tillage is carried out to increase the available P content in the soil by allowing litter to decompose on the soil surface because P in the soil comes from the decomposition process of organic matter.
The author would like to thank the Universitas Sebelas Maret Surakarta, which has provided the opportunity to conduct research, and my colleagues, who have helped and collaborated in carrying out this research from the initial stage to completion. Thank you also to Mr. Jaka Suyana for providing input on improving the manuscript.
[1] Purwanto. (2015). The history of developing and obtaining eco-label certification. Optimize Local Resources to Process MEA, 493-505. http://repository.umy.ac.id/handle/123456789/10136.
[2] Huang, W., Zong, M., Fan, Z., Feng, Y., Li, S., Duan, C., Li, H. (2021). Determining the impacts of deforestation and corn cultivation on soil quality in tropical acidic red soils using a soil quality index. Ecological Indicators, 125: 107580. https://doi.org/10.1016/j.ecolind.2021.107580
[3] Karlen, D.L., Andrews, S.S., Wienhold, B.J., Zobeck, T.M. (2008). Soil quality assessment: Past, present and future. U.S. Department of Agriculture: Agricultural Research. https://digitalcommons.unl.edu/usdaarsfacpub/1203/.
[4] Tesfahunegn, G.B. (2014). Soil quality assessment strategies for evaluating soil degradation in Northern Ethiopia. Applied and Environmental Soil Science, 2014: 646502. https://doi.org/10.1155/2014/646502
[5] Zhou, Y., Liu, C., Ai, N., Tuo, X., Zhang, Z., Gao, R., Yuan, C. (2022). Characteristics of soil macrofauna and its coupling relationship with environmental factors in the loess area of Northern Shaanxi. Sustainability, 14(5): 2484. https://doi.org/10.3390/su14052484
[6] Marion, L.F., Schneider, R., Cherubin, M.R., Colares, G.S., Wiesel, P.G., da Costa, A.B., Lobo, E.A. (2022). Development of a soil quality index to evaluate agricultural cropping systems in southern Brazil. Soil and Tillage Research, 218: 105293. https://doi.org/10.1016/j.still.2021.105293
[7] Chamorro-Martínez, Y., Torregroza-Espinosa, A.C., Pallares, M.I.M., Osorio, D.P., Paternina, A.C., Echeverría-González, A. (2022). Soil macrofauna, mesofauna and microfauna and their relationship with soil quality in agricultural areas in northern Colombia: ecological implications. Revista Brasileira de Ciência do Solo, 46: e0210132. https://doi.org/10.36783/18069657rbcs20210132
[8] Adinugroho, W.C., Indrawan, A., Supriyanto, Arifin, H.S. (2018). Contribution of agroforestry system to carbon stocks in the Upstream River Bekasi Watershed. Hutan Trop, 1(3): 242-249. https://doi.org/10.20527/jht.v1i3.1545
[9] Moco, M.K.S., Gama-Rodrigues, E.F., Gama-Rodrigues, A.C., Machado, R.C., Baligar, V.C. (2010). Relationships between invertebrate communities, litter quality and soil attributes under different cacao agroforestry systems in the south of Bahia, Brazil. Applied soil ecology, 46(3): 347-354. https://doi.org/10.1016/j.apsoil.2010.10.006
[10] Dewi, W.S., Muhammad A.N., Muhammad A.D. M., Purwanto, Dwi P.A, and Eko R.I. (2023). The Assessment of Soil Quality and Earthworms as Bioindicators in the Alas Bromo Education Forest, Central Java, Indonesia.” International Journal on Advanced Science, Engineering and Information Technology, 13(2): 452-461. https://doi.org/10.18517/ijaseit.13.2.18398.
[11] Martunis, Lukman, Sufardi, and Muyassir. (2016). Soil quality index analysis of dryland areas in Aceh Besar District, Aceh Province. Jurnal Budidaya Pertanian, 12(1): 34-40. https://ejournal.unpatti.ac.id/ppr_jbdp.php?jrnl_nm=JBDP.
[12] Cassani, M.T., Sabatté, M.L., Rubín, M.R., Sfeir, A.J., Massobrio, M.J. (2021). Litter decomposition by soil fauna: Effect of land use in agroecosystems. Heliyon, 7(10): e08127. https://doi.org/10.1016/j.heliyon.2021.e08127
[13] Windusari, Y., Sari, N.A.P., Yustian, I., Zulkifli, H. (2012). Estimation of carbon biomass from the understorey and litter vegetation at tailings deposition area of PT Freeport Indonesia. Biospecies, 5(1): 22- 28. https://online-journal.unja.ac.id/biospecies/article/view/694.
[14] Suryani, E. (2012). Increasing soil productivity through agroforestry systems. Sumberdaya Lahan, 6(2). https://repository.pertanian.go.id/server/api/core/bitstreams/e001c213-d4b2-437d-85c2-e041bf996648/content.
[15] Voltr, V., Mensík, L., Hlisnikovsky, L., Hruska, M., Pokorny, E., Pospisilova, L. (2021). The soil organic matter in connection with soil properties and soil inputs. Agronomy, 11(4). https://doi.org/10.3390/agronomy11040779
[16] Eddy, W.C., Yang, W.H. (2022). Improvements in soil health and soil carbon sequestration by an agroforestry for food production system. Agriculture, Ecosystems & Environment, 333: 107945. https://doi.org/10.1016/j.agee.2022.107945
[17] Veum, K.S., Goyne, K.W., Kremer, R.J., Miles, R.J., Sudduth, K.A. (2014). Biological indicators of soil quality and soil organic matter characteristics in an agricultural management continuum. Biogeochemistry, 117(1): 81-99. https://doi.org/10.1007/s10533-013-9868-7
[18] Syahfitri, J., Lestari, D. (2022). The soil diversity in Hongfuna Basin is beidi agricultural coconut plantation (Pt Agricinal Bengulua). Journal of Education and Biology, 14(1): 59-66, https://doi.org/10.25134/quagga.v14i1.5053
[19] Hyun, J., Kim, Y.J., Kim, A., Plante, A.F., Yoo, G. (2022). Ecosystem services-based soil quality index tailored to the metropolitan environment for soil assessment and management. Science of the Total Environment, 820: 153301. https://doi.org/10.1016/j.scitotenv.2022.153301
[20] Velasquez, E., Lavelle, P. (2019). Soil macrofauna as an indicator for evaluating soil-based ecosystem services in agricultural landscapes. Acta Oecologica, 100: 103446. https://doi.org/10.1016/j.actao.2019.103446
[21] Kurnia, U., Agus, F., Adimihardja, A., Dariah, A. (2006). Soil Physical Properties and Their Analytical Methods. The Great Hall of Research and Development of Agricultural Resources, Bogor. https://repository.pertanian.go.id/server/api/core/bitstreams/0801f424-c383-4ab9-b887-f95baa010d5e/content.
[22] Ariyanto, D.P., Qudsi, Z.A., Sumani, Dewi, W.S., Rahayu, Komariah. (2020). The dynamic effect of air temperature and air humidity toward soil temperature in various lands cover at KHDTK Gunung Bromo, Karanganyar-Indonesia. IOP Conference Series: Earth and Environmental Science, 724(1). https://doi.org/10.1088/1755-1315/724/1/012003
[23] Triana, J.S.A., Chu, M.L., Stein, J.A. (2021). Assessing the impacts of agricultural conservation practices on freshwater biodiversity under changing climate. Ecological Modelling, 453: 109604. https://doi.org/10.1016/j.ecolmodel.2021.109604
[24] Eviati, S., Sulaiman, S. (2009). The Second Edition of the Technical Guidelines Analyzes the Chemical Analysis of Soil, Plants, Water and Fertilizers. Land Research Office, Bogor.
[25] Guillot, E., Bertrand, I., Rumpel, C., Gomez, C., Arnal, D., Abadie, J., Hinsinger, P. (2021). Spatial heterogeneity of soil quality within a Mediterranean alley cropping agroforestry system: Comparison with a monocropping system. European Journal of Soil Biology, 105: 103330. https://doi.org/10.1016/j.ejsobi.2021.103330
[26] Tolaka, W., Wardah, W., Rahmawati, R. (2013). Soil physical properties of primeval forests, agriculture and cocoa gardens in Leboni village, Boso county. Jurnal Warta Rimba, 1(1): 1-8. http://jurnal.untad.ac.id/jurnal/index.php/WartaRimba/article/view/1954
[27] Sulistyono, E., Abdillah, R. (2017). Optimal soil capacity, water level and weight for growth and yield (Dicocora tool L). Agrovigor: Jurnal Agroekoteknologi, 10(1): 39-43. https://doi.org/10.21107/agrovigor.v10i1.2789
[28] Prabowo, R., Subantoro, R. (2018). Soil analysis an indicator of the fertility level of agricultural cultivation land in Semarang City. Cendekia Eksakta, 2(2): 59-64. https://doi.org/10.3194/ce.v2i2.2087
[29] Wawan. (2017). Management of Organic Matter. Universitas Riau, Riau, Indonesia.
[30] Pinatih, I.D.A.S.P., Kusmiyarti, T.B., Susila, K.D. (2015). Evaluation of soil fertility status on agricultural land in South Denpasar District. E-Jurnal Agroekoteknologi Tropika, 4(4): 282-292.
[31] Nuraida, N., Alim, N., Arhim, M. (2021). Anaysis of soil moisture, soil bulk weight and soil porosity in multiple land use. In Prosiding Seminar Nasional Biologi, 7(1): 357-361. https://doi.org/10.24252/psb.v7i1.24703
[32] Dewi, W.S., Puspaningrum, A., Tinuntun, R.S.T., Suntoro, S., Mujiyo, M. (2022). A modified soil fertility assessment method using earthworm density and microbial biomass C at various land uses in Wonogiri, Indonesia. International Journal of Design & Nature and Ecodynamics, 17(6): 929-936. https://doi.org/10.18280/ijdne.170614
[33] Dermiyati. (2018). Soil microbial biomass carbon in ultisols during the growth of ground nut (Arachis hypogaea l.) by applying combination of organonitrofos. Pros. Forum Komun. Perguru. Tinggi Pertan. Indones. 2018 Univ. Syiah Kuala Banda Aceh (FKPTPI) pp. 22-28. http://fkptpi.usk.ac.id.
[34] Peng, Y., Thomas, S.C., Tian, D. (2008). Forest management and soil respiration: Implications for carbon sequestration. Environmental Reviews, 16: 93-111. https://doi.org/10.1139/A08-003
[35] Ayuningtias, N.H., Arifin, M., Damayani, M. (2016). Soil quality analysis of different land use conditions in Hululuke subspecies region. Soilrens, 14(2): 25-32. https://doi.org/10.24198/soilrens.v14i2.11035
[36] Menti, Y., Yusnaini, S., Buchari, H., Niswati, A. (2020). Soil respiration due to tillage systems and in situ mulch application to mung bean plantations (Vigna radiata L.) in integrated field laboratoriesUniversitas Lampung. Jurnal Agrotek Tropika, 8(2): 365-373.
[37] Zulkaidhah, Z., Wardah, W., Saleh, S., Satriawan, W., Hapid, A., Wulandari, R., Wahyuni, D., Taiyeb, A., Rukmi, R., Rahmawati, R., Hamka, H. (2022). Soil Macrofauna diversity and litter decomposition rate in the buffer zone of lore lindu biosphere reserve Indonesia. International Journal of Design and Nature and Ecodynamics, 17(5): 753-760. https://doi.org/10.18280/ijdne.170513
[38] Haryadi, D., Wawan, Amri, A. I. (2014). Chemical properties of ultisol under the oil palm (Elaeis guineensis Jacq.) stands of different ages. J. Online Mhs. Fak. Pertan. Univ. Riau, 1(1): 1-11. https://journal.unila.ac.id.
[39] Sutandi, A., Nugroho, B., Sejati, B. (2011). The relationship between depth and some properties of soil chemistry and palm yield (Elisguines). Jurnal Ilmu Tanah dan Lingkungan, 13(1): 21-24. https://doi.org/10.29244/jitl.13.1.21-24
[40] Melman, D.A., Kelly, C., Schneekloth, J., Calderon, F., Fonte, S.J. (2019). Tillage and residue management drive rapid changes in soil macrofauna communities and soil properties in a semiarid cropping system of Eastern Colorado. Applied Soil Ecology, 143: 98-106. https://doi.org/10.1016/j.apsoil.2019.05.022
[41] Siswanto, B. (2019). Distribution of nutrients N, P, K and pH in soil. Buana Sains, 18(2): 109-124. https://doi.org/10.33366/bs.v18i2.1184.
[42] Watson, C.A., Atkinson, D., Gosling, P., Jackson, L.R., Rayns, F.W. (2002). Managing soil fertility in organic farming systems. Soil Use and Management, 18: 239-247. https://doi.org/10.1111/j.1475-2743.2002.tb00265.x
[43] Sagiarti, T., Okalia, D., Markina, G. (2020). Analysis of c-organic matter, nitrogen and c / n soil content in high-yield eco-tourism land in Guxian County. Jurnal Agrosains dan Teknologi, 5(1): 11-18. https://doi.org/10.24853/jat.5.1.11-18.