Basma Satar Jabar*![]() | Khamis Naba Sayl
| Khamis Naba Sayl![]() | Rafid Alboresha
| Rafid Alboresha![]()
© 2023 IIETA. This article is published by IIETA and is licensed under the CC BY 4.0 license (http://creativecommons.org/licenses/by/4.0/).
OPEN ACCESS
Sedimentation significantly impedes dam efficiency by diminishing storage capacity, necessitating planning and maintenance strategies that accurately identify key sediment sources in watersheds and restore sediment productivity. This study applied a physical-based SWAT (Soil and Water Assessment Tool) watershed model to quantify the sedimentation of the H-3 Houran Dam in the Houran valley, Western Iraq. The SWAT model was deployed for the period from 1/1/2004 to 31/12/2021, estimating the daily and annual sediment and surface runoff from the Houran valley. The model's performance was assessed using an error ratio criterion between the actual field-measured sediment and the simulated sediment yield; the results demonstrated a favourable error rate of less than 1%. Sediment spatial distribution varied across the lake, with a higher per-unit-area sediment concentration near the dam body, despite a lesser total quantity within the dam basin. This discrepancy was attributed to increased downstream runoff and other basin characteristics such as slope and rock type. Our findings corroborate the appropriateness of this methodology for water resource management, particularly in areas with limited data. Contrary to technical reports suggesting an annual sediment transport of 60 tons per square kilometre in Western Iraq, this study found a more plausible figure of 37.8 tons. For the period 2004-2021, the actual sediment collected in the dam basin was calculated to be 700,278 tons, with a daily runoff over 18 years of 12.2 m3/s. The simulated sediment yield was 37,470.9 tons, which calibrated to 707,516.4 tons, maintaining an error rate of 1% for the parameters SPCON, SPEXP, CN2. This study thus provides valuable insights into sediment management for dam efficiency.
Soil and Water Assessment Tool, Houran dam H-3 lake, sediment
Soil erosion represents a serious environmental problem in this world, as it poses a great threat to dams as well as the nature of the environment [1]. Land degradation due to ongoing erosion processes leads to significant costs to society as a whole and decision-makers, in particular, and thus the increasing pressure on natural resources has led to the need to predict the consequences of future changes to the environment [2], especially if the study area is limited by hydrological data, which constitutes a major obstacle that calls for the invention of new methods to study the modeling of sediment quantities and its movement, as in the current research. The scientific literature with a wide variety indicates that soil erosion includes large sums of processes with different characteristics such as shape, intensity, and frequency. Where scientists began to develop special equations for quantitative prediction of soil erosion based on physical factors such as climate, topography, soil properties, and type of vegetation cover. All this came with the increase of abundant and observed data and its aim towards determining the rates of soil erosion with a spatial distribution in addition to a greater understanding of its mechanics [3]. Soil erosion prediction techniques began to develop and spread more than 70 years ago, but the work expanded a lot in 1965 to include the Global Soil Loss Equation (USLE) developed by (Wischmeier and Smith), which was perhaps the first achievement of soil erosion prediction [4]. Subsequently, many simulation models for soil erosion predictions were developed. All researchers considered slope length, slope, rainfall, soil properties, and vegetation cover, as constant criteria that affect the erosion process [5]. The researchers also used various factors that affect the erosion process to simulate the prediction of soil erosion, but the permanent dominant factor is the erosion force resulting from the movement of water, whether it is rain or surface runoff, soil erosion models are classified into three main categories according to the physical processes simulated by the model: experimental or statistical, conceptual, and physics-based models. Where it was found that the experimental models are the simplest because of the possibility of their implementation in situations with limited data, where it appears useful in determining the sources of sediment and the generation of nutrients. Examples of empirical models also include (USLE), (RUSLE), and (MUSLE). As for the conceptual models, the factors that depend on sediment production are rainfall and runoff as inputs to the system and sediment production, while the physical models can reach the temporal and spatial differences of sediment retention, transport, and deposition processes [6]. A GIS is a powerful tool for analyzing huge amounts of data to perform geotechnical assessments over large areas in a short period [7]. A GIS's ability to generate new information by combining existing heterogeneous data sets with a compatible GIS is a key advantage [8-11]. In this study, the amount of sediment was calculated by the implementation of many steps by joining GIS and using real field data recorded during the field survey of the lake, most of watersheds in arid region are remote and so large with poorly of infrastructures like roadway that makes it is so problematic to monitoring and set the metrological stations in the region. The highlighted problem in the arid zones is also a rarity of hydrological models because the rainfall series are available but with gaps. Technology can help to provide solutions for the lack of data by using GIS and SWAT modeling as one of these solutions to overcome these problems.
Therefore, there is interesting necessity to develop and use the GIS and SAWT models that help of predicting the sedimentation in any catchment area from the available data. Surface runoff prediction in the arid region considered an important challenge in hydrology, especially for the ungagged area when further studies to develop and improve the runoff prediction models are necessary [12]. Because of the data is so limited and, in many times, not available, it is necessary to use other approaches for resorting representative runoff in catchment area. This study aimed to provide decision-makers and engineers with real and reliable methods for accurately estimating sediment quantities, in addition to enhancing and evaluating the impacts on the harvesting of receiving rainwater. Sediment retention basin bodies within watersheds.
This study aims to know the quantities of sediments that entered Lake Houran Dam H-3 during the study period (1/1/2004 - 31/12/2021). With the application of the SWAT model to estimate the quantities of sediments in tons and surface runoff, the products of running the program were then calibrated and verified., by the SWAT model and the amount of sediment was estimated.
2.1 Methodology
The following methodology was used to achieve the objectives as in Figure 1, the schematic framework of the methodology. The methodology is divided into two main parts, which are the field survey process, the method used for fieldwork is dividing the lake into many points by making a grid line along the body of the lake and SWAT model input data which includes digital elevation model DEM, land use map, soil map and slope map. After completing all the field survey work of the lake, all the data was entered into the Excel program, then exported to ArcGIS 10.2.2 to know the boundaries of the lake and its compatibility with the real natural boundaries that were observed during the field survey process, where the results were consistent in a very perfect way, also the interpolation was done for the points located on the edges of the lake inverse distance weighted (IDW) to increase the accuracy of the results and complete the operations on them within the ArcGIS program, where the lake was divided into 17 polygons depending on the measured real heights of the sediments in the dam basin, where the area and volume of each polygon were calculated and a map representing the location and size of these sections was obtained concerning the lake and the map of the spatial distribution of the sediments. Regarding the second step, the data represented by a digital elevation map (DEM) with dimensions (10×10) m, a map of soil type and land use in the form of (forms files), and a climatic database were entered. The model was run Daily and annual simulations of runoff and sediment were performed in the form of a continuous series during the study period (1/1/2004-31/12/2021), taking into account the years of model preparation. Parameters that very sensitively affect the amount of sediment such as Linear parameter for calculating the channel sediment routing SPCON, Exponent parameter for calculating the channel sediment routing SPEXP, and Surface runoff calculation parameter CN2 were also configured to obtain the best results when comparing the measured values of sediment and the observed values of rainstorms from the continuous model calibration.
Figure 1. Flowchart of research methodology
2.2 Study area
The Iraqi Western Desert represents the southwestern part of the Euphrates River. This area covers of approximately 220,000 km2, most of these areas are arid. The soil of the area is suitable for cultivation. The rainy season starts from September to the end of May. The average annual precipitation in this region is 115 mm, about 49.5% occurring in winter, 36.3% in spring and 14.8% in autumn [13]. This desert is located Between longitudes 34°-39° east and extends at a much higher altitude to the west to Syria and Jordan and from the south and southwest to the Kingdom of Saudi Arabia. Houran valley is one of the largest valleys not only in the Western Desert but also, in general, in the region of Iraq. It extends for 458 km from the Iraqi-Saudi Region. It is bordered to the point where the Euphrates River meets in the town of Al-Baghdadi, south of modern (Figure 2). Geographical location of the valley, Longitude 39°00'' 00'' to 43'00''00'' East and Latitude 32'00''00'' to 43'30'00'' North. The catchment area of the valley is about 13,370 km2 and the difference in height from the beginning of the valley to its end is around 600 AD [14]. The Houran dam H-3 is a very important area in the Western Desert, so it is important to study all the problems that cause a shortage of water, the most prominent of which is the problem of sedimentation. The resistance of exposed rocks to weathering and erosion in different geological formations along the course of Wadi Houran has caused the development of different landscapes in the valley.
Therefore, the valley is divided into four main types of erosion: Gulley Erosion: It is the main type of erosion along the course of Wadi Houran, especially in the meandering areas, bank erosion and bank erosion are common; Usually is the case of the first case and sediment orientation in the last case. Sheet erosion: This type of erosion is very rare in the course of Wadi Houran and on its banks. It works on flat areas of broad floodplains, as well as on the upper parts of banks. Rill Erosion: This type of erosion is very common in parts, where soft rocks dominate over hard rocks. Therefore, the main landscape is dense cliffs of various sizes along the slopes of those cliffs, and erosion of the cliff is very active. The geology of Wadi Houran includes briefly three types of geological formations, the first type is soft and hard rocks in an alternating fashion where the height of these forms’ ranges from a few meters to 15 meters, and they are usually covered with hard limestone or polished sandstone. The second type is represented by a limestone pavement to the upper parts of the banks of Wadi Houran, the size of the limestone blocks depends on the distance to the valley course, and the original thickness of the limestone layers. The third type of soil is reddish-brown in color, silty clay, not compacted, the thickness varies from (<0.5–1.5) m; however, locally may reach 2 m. Towards the bedrock, small fragments of limestone occur in the soil [15].
Figure 2. Geographical location of the study area
2.3 Soil texture
The sampling locations identified in this study were based on the actual heights of sedimentation in the dam basin. A total of 50 samples were obtained from the locations chosen to cover the entire field of study. GPS was used to determine the sample point in this study. The Auger apparatus obtained samples of 60-120 cm in topsoil. Then, laboratory tests are used to predict the texture of the soil for each sample using sieve analysis and hydrometer tests. Minimum soil sample quantities for particle size tests were determined according to the actual sample quantities. Use a 0.05 mm sieve to separate the coarse soil (sand) from the fine soil (silt and clay). This is done by washing the sample, as the fine particles pass with water from the sieve, only sand particles remain. Thus, the sand percentage is calculated for each sample. Using the hydrometer test to separate the clay from the silt particles.
2.4 The field survey for lake
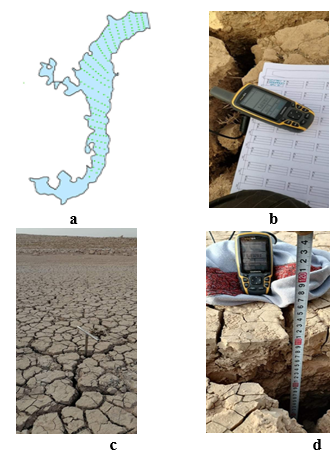
The data collected for this study included a field survey carried out at the dam site, which is 60 km northeast of the city of Al-Rutba. The method used for fieldwork is dividing the lake into many points up to 150 points (Figure 3a), by making a grid line along the body of the lake, each of the intersection points in the grid represents the location of sediment sampling. Coordinate points were taken in the dam basin using the Global Position System (GPS) device (Figure 3b), and the depths of those points were measured using the Auger device (Figure 3c), excavation is carried out to a depth that is difficult to dig from. This indicates access to natural ground, and the metal tape measure (Figure 3d), in addition to taking samples of the soil deposited in the dam basin, where samples were taken from the first line of the grid at a distance of 2 meters from the body of the dam, then samples were taken from three lines in a row, and the distance between them was fixed at 50 meters. Then the grid lines are completed at a fixed distance between every two lines, which is 100 meters, until reaching the end of the dam lake. The Global Digital Elevation Model (GDEM) was obtained from the National Aeronautics and Space Administration (NASA) website (earthdata.nasa.gov). Satellite imagery (Landsat 8) was obtained from the United States Geological Survey (USGS). The design report for the dams prepared was obtained from the Ministry of Water Resources, Iraq. Climate data for Al-Rutba station were obtained from the Iraqi Meteorological Organization and Seismology data were recorded between 2004 and 2021.
Figure 3. a. The lake; b. (GPS) device; c. Auger device; d. Metal tape measure
3.1 SWAT model explanation
SWAT is a semi-distributed hydrological model with continuous temporal mobility. This model was developed to simulate the effects of changes in watershed management techniques on the hydrology of surface water and groundwater, pollutant spread, water erosion, and sediment movement [16-19]. It consists of two types of functional units: Hydrologic Response Unit (HRU) and Sub-Basin Response Unit (SRU). The first unit, HRU, is a geographical representation of the homogenous quality of slope, land use, and soil in each sub-basin. The second item highlights some of the locations that make up the main spring and the region that contributes to it, forming one or more HRUs [20]. The model forecasted each HRU hydrology using the water balance equation of daily rainfall, surface runoff, percolation, lateral flow, irrigation, and evapotranspiration. The modeling of the land phase is based on the water balance equation [21]:
SWt=SWo+∑ti=1(Rday−Qsurf−Ea−Wseep−Qgw)i (1)
SWt denotes the amount of water in the soil (mm), SWo the amount of water available to plants (mm), and Qsurf the amount of water available to plants (mm), Rday for precipitation (mm), surface runoff (mm), Ea for Wseep for percolation (mm), and evapotranspiration (mm), t for the sake of time (days). In the water cycle, the water phase depicts the route of water in the riverbed using the variable storage coefficient approach or Muskingum routine. For each HRU, sediment yield is calculated using the empirical Modified Universal Soil Loss Equation (MUSLE) [22]:
Sed=11.8*(Qvsurf*qpeak*areahru)0.56*Kusle*Cusle*Pusle*LSusle*CFRG (2)
Sed represents the sedimentation yield on a specific day (t), Qsurf denotes the volume of surface run-of (mm/ha), whereas qpeak is the peak run-of rate (m3/s), Areahru for the HRU district (ha), Kusle is an abbreviation for the universal soil loss equation (USLE) Cusle for USLE cover and management factor, Pusle for USLE support practice factor, Lusle is an abbreviation for USLE topographic factor, while CFRG is an abbreviation for coarse fragment factor. SWAT needs two types of input data: spatial data and temporal data [23-27]. Soil map and land use map plus slope map digital elevation model (DEM) for spatial data. Hydrological data (water flow and sediment yield) and climatic data (solar radiation, wind speed, minimum and maximum temperature, daily rainfall data, and relative humidity) in temporal data (Table 1) show the details of the databases. The main input data for the hydrological process in SWAT is climate data. Therefore, daily precipitation, maximum and minimum air temperature, wind speed and solar radiation, and relative humidity of the air, data from the Meteorological Center were used [28]. A measurement station located in the valley was used as a wet station, which helped with SWAT simulation. This meteorological and hydrological data covered 18 years from January 2004 to December 2021 (Resident Engineer Department provided this data).
Table 1. SWAT input data
|
Type of Data |
Resolution |
The Description |
|
DEM |
10×10 m |
ASTER-GDEM (Global Digital Elevation Model) |
|
Landaus Data |
10×10 m |
Land use classification derived from Sentinel-2 imagery captured on 8 June 2009 |
|
Soils Data |
1/1 500 000 |
FAO, HWSD (Harmonized World Soil Database) (Food and Agriculture Organization) |
|
Weather Data |
Daily |
Daily precipitation, maximum and minimum air temperature, relative humidity, Wind speed, and solar radiation data collected at AL-Rutba station |
3.2 DEM digital elevation model
DEM was used for Houran valley, shown in it the topography of the study area (Figure 4a), and was extracted from ASTER-GDEM (ASTER Global Digital Elevation Model) data with a spatial resolution of 10×10 m. DEM is integrated into the SWAT model and used to demarcate the sub-basins. DEM was also used to derive higher graph parameters such as the slope and slope length of sub-basins [21].
3.3 Land use map
The global land use map (Globcover2009_L4_V2.3) was provided by (European Space Agency, ESA) and (Université Catholique de Louvain, UCL) to determine the land use of the study area [29]. This map contains a numerical code to identify each type of land use for each cell of its cells. Natural pastures and weeds occupy a percentage of (6.8%) and the barren land is (93.2%) of the valley. As for the watershed of the Dam, which represents the watershed of the calibration and testing, it was all barren land, based on the satellite images from the satellites. The SWAT model contains a wide database of land uses that includes all the data needed for simulation for each type of land use (Figure 4b) shows the land use map (Globcover2009_L4_V2.3) for the study area.
3.4 Soil map
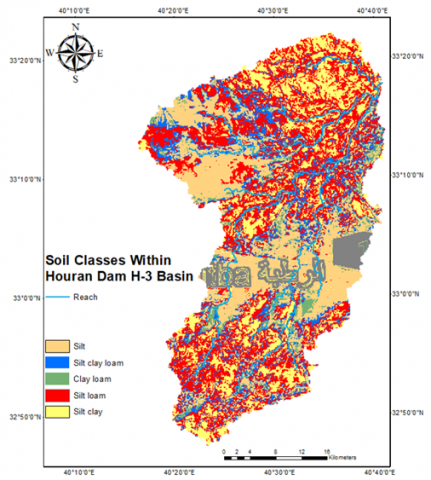
The soil was classified for the area designated for calibration and testing based on field tests of samples taken from the area in the dam basin (the lake), whose results indicated that the soil type for this area ranged between silty clay, and silty clay loam, silt loam, and silt. The Harmonized World Soil Database, HWSD, jointly submitted by the Food and Agriculture Organization of the United Nations, FAO, the International Institute for Applied Systems Analysis, IIASA, and ISRIC-World Soil Information, was adopted. (Institute of Soil Science - Chinese Academy of Sciences, ISSCAS) and (Joint Research Center of the European Commission, JRC) in the (SWAT) model to determine the types and data of soils in the study area, as these maps contain database rich in all the necessary information that has been Inclusion in the SWAT model for simulation (Figure 4c) shows the soil map.
3.5 Slope map
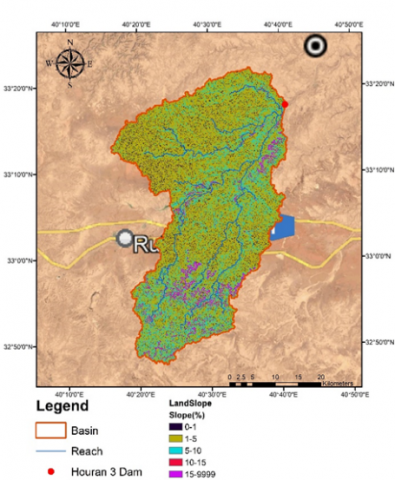
Slope map, drainage diagram for the catchment area, Slopes, stream lengths, and river widths in the catchment area have been derived from ASTER DEM [23]. Spatial Distributions of the categories of slopes in the basin showed 5 categories: 0-1%, 1-5%, 5-10%, 10-15%, 15-9999%. As the slope increases, the sediment transport accelerator is oriented downstream (Figure 4d).
a
b
c
d
Figure 4. a. DEM map; b. Land use map; c. Soil map; d. Slope map
SWAT was used for sediment modeling as the simulation shows for annual flow after running the model a good agreement with the observed climatic data set as input to the SWAT model.
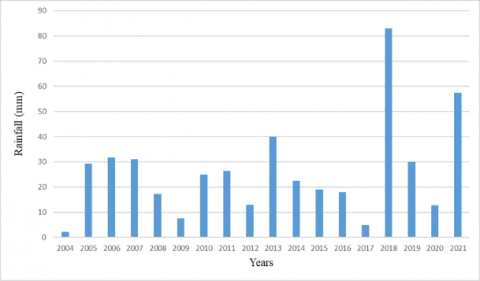
Flow volume during the simulation period (2004-2021) is equal to (12.2 m3/s) as shown in (Figure 5a), (Figure 5b is the highest value of daily rainfall). Also, the amount of sediment generated from the simulation is (37470.9 tons). The histogram of the model simulation can be explained that in the first six years of the dam’s operation, the amount of sediments was few, then it began to gradually increase as the age of the dam increased, and this amount of sediments reduces the dead storage that is supposed to end when the default life of the dam ends, also it becomes clear there were years when sedimentation height increased despite low rainfall, the reason for these instances is that the rain intensity was greater.as shown in (Figure 5c). The performance of the model was evaluated and it gives an error rate of 1% after the calibration process for the three parameters mentioned in (Table 2). It can be said that the SWAT model has been a successful simulation of realistic sedimentation whose quantity was (700278 tons) and the quantity after calibration was equal to (707516.4 tons).
a
b
c
Figure 5. a. Simulation flow; b. The highest value of daily rainfall for the study area during the period (2004-2021) at Rutba Station; c. Simulation sediment
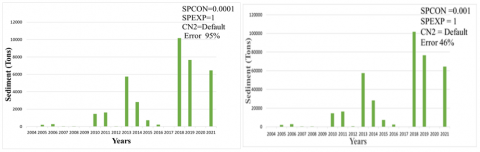
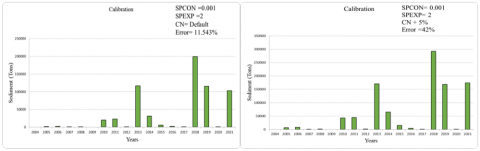
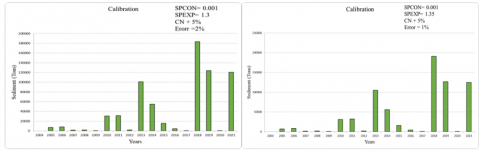
The watershed located in Houran valley was used as the basin of Houran dam H-3 to calibrate the model to provide field measurements for the amount of sediment, where a field survey of the lake was carried out by making a grid line along the lake of the dam. For these deposits using GIS 10.2. A plan was created in a SWAT model that includes a digital elevation map (DEM) with dimensions (10×10) m, a map of soil type and land use in the form of (Shapefiles), and a climate database. A daily simulation of surface runoff and sediment was conducted in the form of a continuous series over the study period (1/1/2004 - 31/12/2021), taking into consideration the years of model preparation. The model was calibrated concerning the quantities of sediments by changing the parameters that affect very sensitively the amount of sediments such as SPCON, SPEXP, and CN2 until obtaining the best results when comparing the observed values of sediment and the values of sediment from rainstorms from the continuous simulation series of the (SWAT) model. The best results were obtained when increasing the curve number of the soil by (5%), and the value of SPCON, SPEXP (0.001), and (1.35), respectively. The performance of the model was evaluated using the error rate, which was (1%) and this is equivalent to R (0.99), which is considered an excellent result as shown in Table 2. And Figure 6 shows the stages of the calibration process with each error rate.
Table 2. SWAT calibration parameter
|
Parameter Name |
Description |
Calibration Range |
Fitted Values |
Error Rate |
|
|
Min |
Max |
||||
|
SPCON |
Linear parameter for calculating the channel sediment routing |
0.0001 |
0.01 |
0.001 |
1% |
|
SPEXP |
Exponent parameter for calculating the channel sediment routing |
1 |
1.5 |
1.35 |
Equivalent to R (0.99) |
|
CN2 |
Surface runoff calculation parameter |
86 |
90.3 |
+5% |
|
Figure 6. The stages of the calibration process with each error rate
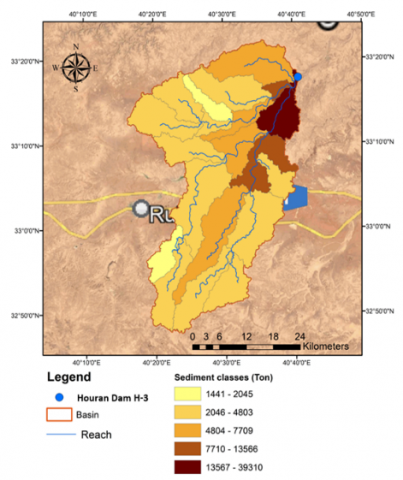
Sediment simulated after running the model shows good agreement with the observed climatic data set as input to the SWAT model. Flow volume during the simulation period (2004-2021) is equal to (12.2 m3/s) as shown in (Figure 5a). Also, the amount of sediment generated from the simulation is (37470.9 tons), as shown in (Figure 5c). The performance of the model was evaluated and it gives an error rate of 1% after the calibration process for the three parameters mentioned in Table 2 and Figure 6 which show the stages of the calibration process with each error rate. It can be said that the SWAT model has been a successful simulation of realistic sedimentation whose quantity was (700278 tons) and the quantity after calibration was equal to (707516.4 tons) for a watershed area equal to (1471.5 km2). The measured volume was 350139 m3 according to the measured real heights of the sediments and GIS 10.2.2, and this volume is reasonable according to the heights that varied between 60 to 120 cm along the body of the lake. Also, the lake was divided into 17 polygons according to the grid line that was followed during the field survey process which was the best solution for dividing the lake because the width of the valley does not represent the entire width of the lake because the valley is concave and the lake will rise approximately 13 meters from the valley relative to the center of the bottom because the height of the dam represents 15 meters. The width of the real valley ranged from (30-to 80) m, and the height of the real valley ranges from (1.5-to 3) m. The soil analysis results from the experiments done in the University of Anbar College of Engineering laboratories were as follows: The soil texture at 2 m from the dam body is Silty clay, at 52 m from the dam body is Silty clay loam, and at 102 m from the dam body is a texture. The soil is also Silty clay loam, and the soil texture at 152 m from the dam body is Silt loam, and the soil texture at 202 m from the dam body is Silt loam, and the texture of the remaining samples until the end of the lake and reaching a distance of 752 m was Silt soil, as shown by the blue dots in Figure 7 [30, 31]. The lake sediment distribution map (Figure 8). The dam basin sediment distribution map (Figure 9).
Figure 7. Soil classification triangle
Figure 8. The lake sediment distribution map
Figure 9. The basin sediment distribution map
The results of the field survey and the preparation of the spatial distribution map with the help of GIS, RS, and SWAT model showed that it is an excellent way for areas where there is little data to run the model correctly.
The continuous daily simulation method, which requires detailed data on the depths of the daily rain, the climate and land uses, the type of soil and its characteristics, and the topography of the area, as the daily runoff in 18 years that enters the lake is 12.2 m3/s.
After the coordinated work between the field survey work and the results of the laboratory analysis, the actual amounts of sediment collected in the dam basin for the period (2004-2021) were calculated (700278 tons).
The amount of sediment generated from the simulation is (37470.9 tons) and the amount of sediment produced after calibrating the model is (707516.4 tons). The performance of the model was evaluated and gives an error rate of 1% after the calibration process for the three Sensitivity parameters to sediment (SPCON, SPEXP, CN2).
Technical reports of the Western Desert of Iraq indicate that (60 tons) per square kilometer of sediments are transported annually, while the current study indicates that the number of sediments transported annually amounted to (37.8) tons per square kilometer of the Western Desert, and this is more reasonable.
The SWAT hydrological model was successfully calibrated (2004-2021) and validated using observed climatic data; there were years when sedimentation height increased despite low rainfall, the reason for these instances is that the rain intensity was greater.
This work demonstrates basin characteristics such as petrology and soil type, as well as how the slope influences sediment yield. According to them, the SWAT model is a reliable and accurate scientific method for determining the spatial distribution of erosion at the basin level of the study area. These results can be used by decision-makers and managers to ensure proper resource management.
The sedimentation is estimated based on GIS and SWAT model with an acceptable range of performance compatibility between the results of the developed model and the field-measurement data of sedimentation can be used with confidence to estimate sedimentation in remote desert areas with limited data.
To the Department of the Resident Engineer for Dams in the Western Desert.
[1] Igwe, P.U., Onuigbo, A.A., Chinedu, O.C., Ezeaku, I.I., Muoneke, M.M. (2017). Soil erosion: A review of models and applications. International Journal of Advanced Engineering Research and Science, 4(12): 237341.
[2] Souchère, V., King, D., Daroussin, J., Papy, F., Capillon, A. (1998). Effects of tillage on runoff directions: consequences on runoff contributing area within agricultural catchments. Journal of Hydrology, 206(3-4): 256-267. https://doi.org/10.1016/S0022-1694(98)00103-6
[3] Bensekhria, A., Rabah, B. (2008). Assessment and mapping soil water erosion using RUSLE approach and GIS tools: Case of Oued el-Hai Watershed, Aurès West, Northeastern of Algeria. ISPRS International Journal of Geo-Information, 11 (2): 84. https://doi.org/10.1080/00103629509369360
[4] Parsons, R.L., Pease, J.W., Martens, D.C. (1995). Simulating corn yields over 16 years on three soils under inorganic fertilizer and hog manure fertility regimes. Communications in Soil Science and Plant Analysis, 26(7-8): 1133-1150. https://doi.org/10.1080/00103629509369360
[5] Parton, W.J., Ojima, D.S., Cole, C.V., Schimel, D.S. (1994). A general model for soil organic matter dynamics: Sensitivity to litter chemistry, texture and management. Quantitative Modeling of Soil Forming Processes, 39: 147-167. https://doi.org/10.2136/sssaspecpub39.c9
[6] Williams, J.R. (1990). The erosion-productivity impact calculator (EPIC) model: A case history. Philosophical Transactions of the Royal Society of London. Series B: Biological Sciences, 329(1255): 421-428. https://doi.org/10.1098/rstb.1990.0184
[7] Assaf, A.T., Sayl, K.N., Adham, A. (2021). Surface water detection method for water resources management. In Journal of Physics: Conference Series, No: 012149. https://doi.org/10.1088/1742-6596/1973/1/012149
[8] Sameer, Y.M., Abed, A.N., Sayl, K.N. (2021). Highway route selection using GIS and analytical hierarchy process case study Ramadi Heet rural highway. Journal of Physics: Conference Series, 1973(1): 012060. https://doi.org/10.1088/1742-6596/1973/1/012060
[9] Sayl, K.N., Muhammad, N.S., El-Shafie, A. (2017). Optimization of area–volume–elevation curve using GIS–SRTM method for rainwater harvesting in arid areas. Environmental Earth Sciences, 76(10): 1-10. https://doi.org/10.1007/s12665-017-6699-1
[10] Mohammed, O.A., Sayl, K.N. (2021). A GIS-based multicriteria decision for groundwater potential zone in the west desert of Iraq. In IOP Conference Series: Earth and Environmental Science, 856(1): 012049. https://doi.org/10.1088/1755-1315/856/1/012049
[11] Mohammed, O.A., Sayl, K.N. (2020). Determination of groundwater potential zone in arid and semi-arid regions: A REVIEW. In 2020 13th International Conference on Developments in eSystems Engineering (DeSE), Liverpool, United Kingdom, pp. 76-81. https://doi.org/10.1109/DeSE51703.2020.9450782
[12] Sayl, K.N., Muhammad, N.S., El-Shafie, A. (2019). Identification of potential sites for runoff water harvesting. Proceedings of the Institution of Civil Engineers: Water Management, 172(3): 135-148. https://doi.org/10.1680/jwama.16.00109
[13] Kamel, A.H., Mohammed, A.S. (2010). Determination of water harvesting regions in Iraqi western desert using GIS system. Iraqi Journal of Desert Studies, 2(2).
[14] Muneer, A.S., Sayl, K.N., Kamel, A.H. (2020). Modeling of runoff in the arid regions using remote sensing and geographic information system (GIS). International Journal of Design & Nature and Ecodynamics, 15(5): 691-700. https://doi.org/10.18280/ijdne.150511
[15] Sissakian, V., Ahad, A.A., Al-Ansari, N., Knutsson, S. (2017). Geology of wadi hauran, the largest valley in iraqi western desert. Journal of Earth Sciences and Geotechnical Engineering, 7(2): 103-132.
[16] Hashim, H.Q., Sayl, K.N. (2021). Detection of suitable sites for rainwater harvesting planning in an arid region using geographic information system. Applied Geomatics, 13(2): 235-248. https://doi.org/10.1007/s12518-020-00342-3
[17] Khudhair, M.A., Sayl, K.N., Darama, Y. (2020). Locating site selection for rainwater harvesting structure using remote sensing and GIS. In IOP Conference series: Materials Science and Engineering, 881(1): 012170. https://doi.org/10.1088/1757-899X/881/1/012170
[18] Hashim, H.Q., Sayl, K.N. (2020). The application of radial basis network model, GIS, and spectral reflectance band recognition for runoff calculation. International Journal of Design & Nature and Ecodynamics, 15(3): 441-447. https://doi.org/10.18280/ijdne.150318
[19] Muneer, A.S., Sayl, K.N., Kamal, A.H. (2021). Modeling of spatially distributed infiltration in the Iraqi Western Desert. Applied Geomatics, 13(3): 467-479. https://doi.org/10.1007/s12518-021-00363-6
[20] Sorooshian, S. (1991). Parameter estimation, model identification, and model validation: Conceptual-type models. In Recent Advances in the Modeling of Hydrologic Systems, pp. 443-467. https://doi.org/10.1007/978-94-011-3480-4_20
[21] Wesselung, C.G., Karssenberg, D.J., Burrough, P.A., van Deursen, W.P. (1996). Integrating dynamic environmental models in GIS: the development of a Dynamic Modelling language. Transactions in GIS, 1(1): 40-48. https://doi.org/10.1111/j.1467-9671.1996.tb00032.x
[22] Kinama, J.M., Stocking, M., Maingi, P.M. (2007). SLEMSA model application for land use management in semi-arid kenya. Proceedings of the Soil Science Society of East Africa Embu, Kenya, East Africa, 26-30.
[23] Breetzke, G.D., Koomen, E., Critchley, W.R.S. (2013). GIS-assisted modelling of soil erosion in a South African catchment: Evaluating the USLE and SLEMSA approach. Water resources planning, Development and Management, 53.
[24] Masere, T.P., Worth, S. (2015). Applicability of APSIM in decision-making by smallscale resource-constrained farmers: A case of lower Gweru communal area, Zimbabwe. Journal of International Agricultural and Extension Education, 22(3): 20-34.
[25] Teixeira, E.I., de Ruiter, J., Ausseil, A.G., Daigneault, A., Johnstone, P., Holmes, A., Tait, A., Ewert, F. (2018). Adapting crop rotations to climate change in regional impact modelling assessments. Science of the Total Environment, 616-617: 785-795. https://doi.org/10.1016/j.scitotenv.2017.10.247
[26] Echogdali, F.Z., Boutaleb, S., Taia, S., Ouchchen, M., Id-Belqas, M., Kpan, R.B., Abioui, M., Aswathi, J., Sajinkumar, K.S. (2022). Assessment of soil erosion risk in a semi-arid climate watershed using SWAT model: case of Tata basin, South-East of Morocco. Applied Water Science, 12(6): 1-15. https://doi.org/10.1007/s13201-022-01664-w
[27] Kassem, A.A., Raheem, A.M., Khidir, K.M., Alkattan, M. (2020). Predicting of daily Khazir basin flow using SWAT and hybrid SWAT-ANN models. Ain Shams Engineering Journal, 11(2): 435-443. https://doi.org/10.1016/j.asej.2019.10.011
[28] Assfaw, A.T. (2019). Calibration, validation and performance evaluation of SWAT model for sediment yield modelling in Megech reservoir catchment, Ethiopia. Journal of Environmental Geography, 12(3-4): 21-31.
[29] Muneer, A.S., Afan, H.A., Kamel, A.H., Sayl, K.N. (2022). Runoff mapping using the SCS-CN method and artificial neural network algorithm, Ratga Basin, Iraq. Arabian Journal of Geosciences, 15(7): 666. https://doi.org/10.1007/s12517-022-09954-y
[30] Balocco, C., Petrone, G.L. (2021). Sustainability and wellbeing in healthcare facilities. An investigation inside a historic hospital. International Journal of Design & Nature and Ecodynamics, 16(5): 477-485. https://doi.org/10.18280/ijdne.160501
[31] Qamar, A.M., Khan, R.U., Alsuhibany, S.A. (2021). Large-scale bibliometric analysis of coronavirus. International Journal of Design & Nature and Ecodynamics, 16(5): 531-541. https://doi.org/10.18280/ijdne.160507