Bencheriet Chemesse Ennehar![]()
© 2023 IIETA. This article is published by IIETA and is licensed under the CC BY 4.0 license (http://creativecommons.org/licenses/by/4.0/).
OPEN ACCESS
The richness of remote sensing images in information, due to the number of bands, makes them widely used in detecting and classifying terrestrial objects. The purpose of this study is a classification of multispectral images for mapping land occupation in the Mohammadia region (located in the west of Algeria). We developed a comparative study on the classification of the study subject image using the three following kernel functions: linear (LN), polynomial (PL), and radial basis function (RBF). After selecting the desired bands of the multispectral image, the training of the SVM is then carried out on the seven interest zones of the studied region: buildings, dense vegetation, sparse vegetation, forest, bare land, and roads. The obtained results are very promising, where the best classification rates were obtained by the use of the RBF kernel (97.91%) and the polynomial kernel (98.79%).
support vector machine, land cover mapping, kernel functions, classification, multispectral image
Hyperspectral and multispectral imagery has many applications, such as invasive species mapping or geological applications, such as mineral reconnaissance and mapping, lithologic mapping, mineral resource prospecting, mining environment monitoring, and oil and oil leak monitoring. gas,...etc. [1-3]. There are hundreds of other applications in agriculture, ecology, oceanography, and atmospheric studies where multispectral and hyperspectral remote sensing are used to understand the world around us better.
Classification of land cover images [4-6] is becoming a difficult task for many operational applications, due to number of spectral bands [7-9].
However, the availability of these maps within a reasonable time and with sufficient quality depends on the number of spectral bands and the number of training samples. These high dimensionality problems are addressed on one hand using feature reduction and extraction techniques and in another hand investigate an effective classifier [6, 10, 11] in terms of accuracy and computational time.
Support Vector Machine (SVM) [12] is suggested in this article to address the multiclass problem of remote sensing imaging. The robustness of this classifier is that it locates the optimal hyperplane between the class of interest and the rest of the classes by taking into account only the training samples that lie on the edge of the class distributions known as the support vectors.
The robustness of this classifier is also due to the use of kernel functions [13, 14], which made it more flexible and robust against outliers.
The purpose of this study is to classify hyperspectral images for mapping land occupation of Mohammadia [15, 16], mountainous region located in the west of Algeria, using Support Vector Machine (SVM) with three kernel functions: linear (LN), polynomial (PL) and radial basis function (RBF).
The region of El Mohammadia is rich in reliefs and natural wealth, such as mountains, rivers, vegetation, and forests. However, unfortunately, precise and recent ground reality mapping does not exist. The existing one is old, and its update by the concerned service is complicated and takes much time (sometimes months), which is why we thought of implementing an automatic mapping system based on multispectral images. The main advantages of this are speed, accuracy, and the possibility of updating at any time of the year to compare changes in nature and agglomerations.
Our principal contribution consists on one hand in the region of study (Mohamadia) that doesn’t have a land cover mapping from remote sensing image and on another hand in the proposed method based on the comparison of three SVM kernels to represent the land cover map closest to the ground truth.
The remainder of this paper is structured as follows: Section 2 describes the study image. Section 3 provides the principal steps of our proposed framework. Section 4 develops the experimental results and section 5 concludes the paper with discussions and future research directions.
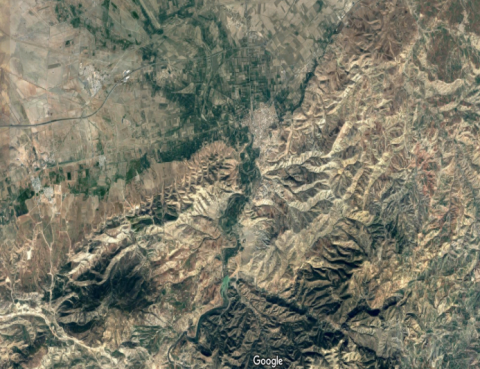
The image used represents the region of Mohammedia Wilaya of Mascara [15, 16, it is a LANDSAT TM image [17] which dates from May 20th, 2002. Its size is 900 x 1000 pixels. The radiometric data relates to the seven channels, from TM1 to TM7 (Table 1). Located in the visible light spectrum: Near-infrared and Mid-infrared (Figure 1).
Table 1. Characteristics and applications of LANDSAT TM images
|
Bands |
Bandwidth (µm) |
Resolution (m) |
Application |
|
TM1 visible (Bleue) |
0.45-0.52 |
30 |
Costal water mapping/vegetation discrimination. Forest classification, man-mad feature identification |
|
TM2 Visible (Green) |
0.52-0.60 |
30 |
Vegetation discrimination and health monitoring, man-made feature identification |
|
TM3 Visible (Red) |
0.63-0.69 |
30 |
Plant species identification, man-made feature identification |
|
TM4 (Near IR) |
0.76-0.90 |
30 |
Soil moisture monitoring, vegetation monitoring, water body discrimination |
|
TM5 (Mid-IR) |
1.55-1.75 |
30 |
Vegetation moisture content monitoring |
|
TM6 (Thermal IR) |
10.4-12.5 |
120 |
Surface temperature, vegetation stress monitoring, Soil moisture monitoring, cloud differentiation, volcanic monitoring |
|
TM7 (Mid-IR) |
2.08-2.35 |
30 |
Mineral and rock discrimination, vegetation moisture content. |
Figure 1. Color composition of the study area image (Mohammedia region)
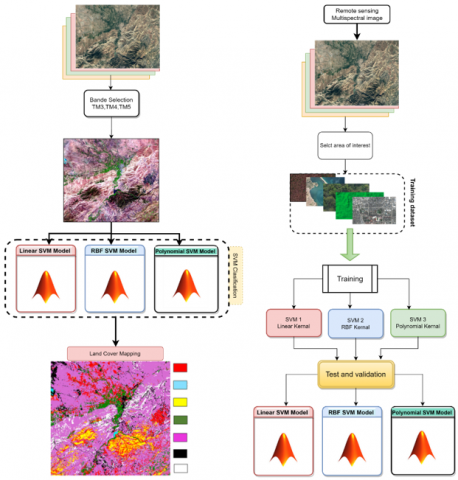
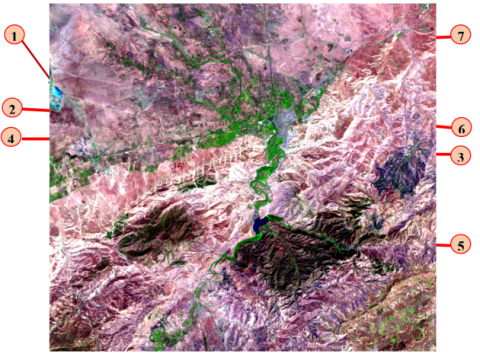
The proposed system architecture allowing the production of the land cover map applied to the region of el Mohammadia is illustrated in Figure 2. The classes of interest on the land use map are (Figure 3): (1) water, (2) building, (3) dense vegetation, (4) sparse vegetation, (5) forest, (6) bare land, and (7) road.
3.1 Selection of radiometrique bands
The radiometric data of the studied image are seven channels ranging from TM1 to TM7. Located in the visible, Near-infrared, and Mid-infrared. To display the recomposed color image (Figure 3), the bands TM 3, TM 4, TM 5 were chosen due to the better representation of certain classes by these bands. The separation of the bands, as well as all the preprocessing of the satellite images, was carried out under ENVI 5.3 [18].
Figure 2. Proposed system architecture
Figure 3. Image in recomposed color with three bands TM3, TM4, TM5 and Regions of Interest
where, Red=Channel 5 (TM5), Green=Channel 4 (TM4), Blue=Channel 3 (TM3).
3.2 Extraction of regions of interest
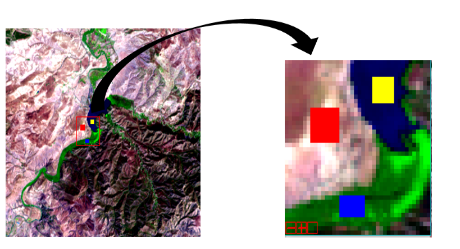
The choice of regions of interest (Figure 4) deserves a lot of attention. It is not always enough to choose only one game per class. Indeed, a class such as "vegetation" may contain several types of landscapes. In this case, we should create subclasses. The classes present in this image are (Figure 3): Class 1: water, Class 2: building, Class 3: Dense vegetation, Class 4: Sparse vegetation, Class 5: Forest Class 6: Bare land, Class 7: road.
Figure 4. Selection of interest regions
3.3 Training and tests
To recognize each area it is necessary to build a classification model. In this case, we used Wide Margin Separators (SVM) [19, 20]. Where the main objective of the SVM classifier is to obtain function f(x) which determines the optimal hyperplane that separates the different classes' zones. We obtain this hyperplane when it managed to separate two classes, or more, of input data points S [11].
1. The following steps summarize the phases of learning and construction of the classification model: Input a training set: S ={(x1, y1),…,(xN, yN)}
2. Choose a Kernel: k(․,․)
3. Training a SVM in the feature space
i.e.To find the decision function
$f(x)=\sum \alpha_i y_i k\left(x_i, x\right)$ (1)
4. Classify any new object and test efficiency on the research of data.
There is, usually, no automatic way to choose a Kernel and to adjust the corresponding parameters. Therefore we, usually, have to try different Kernels and parameters. In our case, we have performed tests on the three following kernels:
1. Linear function [21]:
$k(x, x^{\prime})=b\left(x^T \cdot x^{\prime}\right)$ (2)
2. RBF (Radial Basis Function) [22] kernel given by (Eq. (3)):
$K\left(x, x^{\prime}\right)=e^{-\frac{\|x-x^{\prime} \|^2}{2 \sigma^2}}$ (3)
The parameter σ allows adjusting the width of the Gaussian. Taking a large σ, the similarity of one example to those around it will be quite high, while taking an σ tending to 0; the example will not be similar to any other.
3. Polynomial function [23, 24]:
$K(x, {x^{\prime}})=\left(\alpha x^T \cdot {x^{\prime}}+\lambda\right)^d$ (4)
where, d is order of polynomial function; λ is Equilibrium parameter of the polynomial function.
The training of the classifier and the plotting of the land use map were carried out under Matlab [25]. At the end of the training, the classification procedure was extracted; it is in fact a question of extracting a general rule from the observed data. The generated procedure will have to correctly classify the image and consists of grouping the pixels in logical sets according to either their numerical values or their spatial properties according to their neighborhood to obtain a final image closest to the real mapping.
The tests were carried out on the following three kernel functions described as follow:
4.1 Test 1: land cover mapping using linear kernel
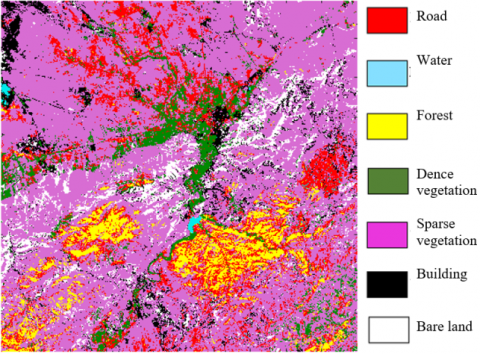
Our first test was done on an SVM classifier with a linear kernel where the land cover mapping of the Mohammedia region is shown in Figure 5. The confusion matrix given in Table 2 indicates the performance of the classifier and where it confusing two classes. In this case, we notice that the majority of the classes conflict, in particular, the building class which conflicts with almost all the classes, where the hiest confusion (17.6%) obtained in classification of road as water class consider verry high and the classification rate is 92.53%.
Figure 5. Land cover mapping by SVM with LN Kernel
4.2 Test 2: land cover mapping using Radial Basis Function kernel
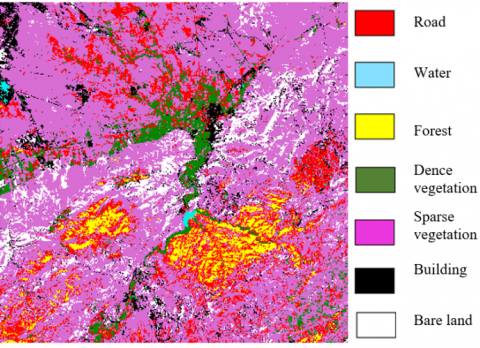
The second test was done on the SVM classifier with the Radial Basis Function kernel where the land cover mapping of the Mohammedia region is shown in Figure 6. The confusion matrix given by Table 3 indicates that the conflict between the road network class and the other classes has been eliminated and the conflicts between the other classes have been reduced. The classification rate increased by more than 5% (97.91%).
Figure 6. Land cover mapping by SVM with RBF Kernel
4.3 Test 3: land cover mapping using polynomial kernel
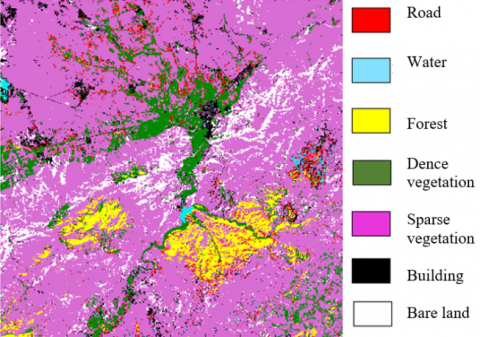
The third test was done on an SVM classifier with a polynomial kernel where the land cover mapping of the Mohammedia region is shown in Figure 7. The confusion matrix given by Table 4 indicates there is confusion between certain classes but it remains minimal compared to previous classifiers where the lowest value (0.56%) was obtained with the confusion of the bare land class with dense vegetation and the highest (4.17%) obtained with the confusion of the sparse vegetation with building class which is the weakest among the three kernels.
The classification rate exceeds 98% which is the best one compared to the obtained by the linear kernel and RBF kernel.
Figure 7. Classified image with polynomial kernel function
Table 2. Confusion matrix of LN kernel classification
|
|
Road |
Water |
Forest |
Dence vegetation |
Building |
Bare land |
Sparse vegetation |
|
Road |
87.0 |
17.6 |
0.00 |
1.69 |
0.00 |
0.00 |
0.4 |
|
Water |
8.00 |
74.0 |
0.00 |
1.69 |
0.00 |
0.00 |
0.00 |
|
Forest |
0.00 |
1.10 |
100 |
0.00 |
0.00 |
0.00 |
0.00 |
|
Dence vegetation |
1.00 |
0.00 |
0.00 |
92.66 |
0.00 |
0.00 |
0.00 |
|
Building |
4.00 |
6.59 |
0.00 |
1.69 |
95.83 |
12.9 |
0.00 |
|
Bare land |
0.00 |
0.00 |
0.00 |
0.00 |
0.00 |
87.10 |
0.00 |
|
Sparse vegetation |
0.00 |
0.00 |
0.00 |
2.26 |
4.17 |
0.00 |
96.40 |
|
Total |
92.53% |
||||||
Table 3. Confusion matrix of RBF kernel classification
|
|
Road |
Water |
Forest |
Dence vegetation |
Building |
Bare land |
Sparse vegetation |
|
Road |
95.0 |
0.00 |
0.00 |
0.00 |
0.0 |
0.00 |
0.00 |
|
Water |
3.00 |
92.31 |
0.00 |
0.00 |
0.0 |
0.00 |
1.20 |
|
Forest |
0.00 |
1.10 |
100 |
0.00 |
0.0 |
0.00 |
0.00 |
|
Dence vegetation |
1.00 |
0.00 |
0.00 |
98.31 |
0.0 |
0.00 |
0.00 |
|
Building |
0.00 |
6.59 |
0.00 |
0.00 |
97.92 |
0.00 |
0.00 |
|
Bare land |
0.00 |
0.00 |
0.00 |
0.56 |
0.00 |
100 |
0.00 |
|
Sparse vegetation |
1.00 |
0.00 |
0.00 |
1.13 |
2.08 |
0.00 |
98.00 |
|
Total |
97.91% |
||||||
Table 4. Confusion matrix PL kernel classification
|
|
Road |
Water |
Forest |
Dence vegetation |
Building |
Bare land |
Sparse vegetation |
|
Road |
95.0 |
0.00 |
0.00 |
0.00 |
0.00 |
0.00 |
0.00 |
|
Water |
3.00 |
98.90 |
0.00 |
0.00 |
0.00 |
0.00 |
0.00 |
|
Forest |
0.00 |
1.10 |
100 |
0.00 |
0.00 |
0.00 |
0.00 |
|
Dence vegetation |
1.00 |
0.00 |
0.00 |
98.31 |
0.00 |
0.00 |
0.00 |
|
Building |
0.00 |
0.00 |
0.00 |
0.00 |
95.83 |
0.00 |
0.00 |
|
Bare land |
0.00 |
0.00 |
0.00 |
0.56 |
0.00 |
100 |
0.00 |
|
Sparse vegetation |
1.00 |
0.00 |
0.00 |
1.13 |
4.17 |
0.00 |
100 |
|
Total |
98.79% |
||||||
4.4 Comparison of performance of SVM with polynomial kernel to other classifiers
To evaluate the performance of our classifier SVM with olynomial kernel function (SVM-PL), it is important to compare it with other classifiers applied to the same region of study. Unfortunately, we found only one study in the scientific literature [26] where the authors applied two classifiers: the RBF neural network (RBF-NN) and Neural Networks coupled with Genetic Algorithms (NN-GA). Table 5 Illustrate the main obtained results where out of the 5 common classes the classifier used in our study (SVM-PL) gave the best result in three classes' forest, space vegetation, and bare land with the highest average classification rate (98.79%) compared to RBF-NN (93.80%) and NN-GA (96.42%).
Table 5. Comparison of the SVM-PL classifier with RBF-NN and the combination NN-GA
|
Classes |
SVM (PL) |
RBF-NN [26] |
NN-GA [26] |
|
Road |
95.00% |
- |
- |
|
Water |
98.90% |
100% |
100% |
|
Forest |
100% |
96.66% |
100% |
|
Dence Vegetation |
98.31% |
90.00% |
100% |
|
Sparce Vegetation |
100% |
76.66% |
75% |
|
Building |
95.83% |
- |
- |
|
Bare Land |
100% |
93.33% |
100% |
|
Moderate vegetation |
- |
100% |
100% |
|
Grass |
- |
100% |
100% |
|
Total |
98.79% |
93.80% |
96.42% |
In this study, we implement an automatic tool for producing the land cover map based on the classification of multispectral satellite images. To accomplish this task, we used the SVM algorithm known for its discrimination performances and faster learning compared to other classification methods. Obtaining the optimal SVM model required, from us, several combined tests on the rate of learning, classification, and the kernels used.
The choice of the best kernel was subject to two main criteria: the best classification rate and the lowest interclass confusion rate, so the choice of the polynomial kernel as the best to adopt for the SVM classifier is justified by its classification rate which is close to of 99% and its the percentage of max confusion obtained (4.17%) which is the lowest among the three kernels. A reduction in interclass confusion is possible by reinforcing learning on the classes subject to confusion, mainly the water/road and sparse vegetation/building classes.
The tests of our system were carried out on a multispectral image of the region of el Mohammedia (a small village located in the west of Algeria). A classification rate exceeding 98% was obtained with the polynomial kernel-based SVM model which is very satisfactory compared with the rates obtained by previous studies carried out on the same region.
A complementary study to this study is the classification of the image of the same region in 2021 and the mapping of the development of the urban fabric.
This project is supporting by the LAIG laboratory and the 8 Mai 1945 University of Guelma. www.univ-guelma.dz.
The authors would like to thank Professor Y. Smara and ASAL (Algerian Space Agency) for providing us with the satellite image. https://asal.dz.
We want to thank ATRST for the research grant in Algeria. https://atrst.dz/.
[1] Govender, M., Chetty, K., Bulcock, H. (2007). A review of hyperspectral remote sensing and its application in vegetation and water resource studies. Water Sa, 33(2): 145-151. http://dx.doi.org/10.4314/wsa.v33i2.49049
[2] Liu, S., Marinelli, D., Bruzzone, L., Bovolo, F. (2019). A review of change detection in multitemporal hyperspectral images: Current techniques, applications, and challenges. IEEE Geoscience and Remote Sensing Magazine, 7(2): 140-158. http://dx.doi.org/10.1109/MGRS.2019.2898520
[3] Khan, M.J., Khan, H.S., Yousaf, A., Khurshid, K., Abbas, A. (2018). Modern trends in hyperspectral image analysis: A review. IEEE Access, 6: 14118-14129. http://dx.doi.org/10.1109/ACCESS.2018.2812999
[4] Liu, S., Marinelli, D., Bruzzone, L., Bovolo, F. (2019). A review of change detection in multitemporal hyperspectral images: Current techniques, applications, and challenges. IEEE Geoscience and Remote Sensing Magazine, 7(2): 140-158. http://dx.doi.org/10.1109/MGRS.2019.2898520
[5] Ghamisi, P., Plaza, J., Chen, Y., Li, J., Plaza, A.J. (2017). Advanced spectral classifiers for hyperspectral images: A review. IEEE Geoscience and Remote Sensing Magazine, 5(1): 8-32. http://dx.doi.org/10.1109/MGRS.2016.2616418
[6] Dhingra, S., Kumar, D. (2019). A review of remotely sensed satellite image classification. International Journal of Electrical and Computer Engineering, 9(3): 1720-1731. http://dx.doi.org/10.11591/ijece.v9i3.pp.1720-1731
[7] Bandos, T.V., Bruzzone, L., Camps-Valls, G. (2009). Classification of hyperspectral images with regularized linear discriminant analysis. IEEE Transactions on Geoscience and Remote Sensing, 47(3): 862-873. http://dx.doi.org/10.1109/TGRS.2008.2005729
[8] Chen, Y., Jiang, H., Li, C., Jia, X., Ghamisi, P. (2016). Deep feature extraction and classification of hyperspectral images based on convolutional neural networks. IEEE Transactions on Geoscience and Remote Sensing, 54(10): 6232-6251. http://dx.doi.org/10.1109/TGRS.2016.2584107
[9] Boudriki Semlali, B.E., El Amrani, C. (2021). Big data and remote sensing: A new software of ingestion. International Journal of Electrical and Computer Engineering, 11: 1521-1530. http://dx.doi.org/10.11591/ijece.v11i2.pp1521-1530
[10] Ghamisi, P., Plaza, J., Chen, Y., Li, J., Plaza, A.J. (2017). Advanced spectral classifiers for hyperspectral images: A review. IEEE Geoscience and Remote Sensing Magazine, 5(1): 8-32. http://dx.doi.org/10.1109/MGRS.2016.2616418
[11] Salem, Y.B., Abdelkrim, M.N. (2020). Texture classification of fabric defects using machine learning. International Journal of Electrical and Computer Engineering, 10(4): 4390-4399. http://dx.doi.org/10.11591/ijece.v10i4.pp4390-4399
[12] Chandra, M.A., Bedi, S.S. (2021). Survey on SVM and their application in image classification. International Journal of Information Technology, 1-11. http://dx.doi.org/10.1007/s41870-017-0080-1
[13] Achirul Nanda, M., Boro Seminar, K., Nandika, D., Maddu, A. (2018). A comparison study of kernel functions in the support vector machine and its application for termite detection. Information, 9(1): 5, http://dx.doi.org/10.3390/info9010005
[14] Al-Mejibli, I.S., Alwan, J.K., Abd Dhafar, H. (2020). The effect of gamma value on support vector machine performance with different kernels. International Journal of Electrical and Computer Engineering, 10(5): 5497-5506. http://doi.org/10.11591/ijece.v10i5.pp5497-5506
[15] Miara, M.D., Souidi, Z., Benhanifa, K., Daikh, A., Hammou, M.A., Moumenine, A., Sabi, I.H. (2020). Diversity, natural habitats, ethnobotany and conservation of the flora of the Macta marches (North-West Algeria). International Journal of Environmental Studies, 1-21. https://doi.org/10.1080/00207233.2020.1824867
[16] Haddouche, I., Gacemi, M. (2011). Analyse spatiale de la régénération forestière post-incendie de la forêt de Fergoug à Mascara, Algérie. Bois & Forets Des Tropiques, 307: 23-31. https://doi.org/10.19182/bft2011.307.a20478
[17] Irons, J.R., Dwyer, J.L., Barsi, J.A. (2012). The next Landsat satellite: The Landsat data continuity mission. Remote Sensing of Environment, 122: 11-21. https://doi.org/10.1016/j.rse.2011.08.026
[18] Tsoka, S., Tsikaloudaki, A., Theodosiou, T. (2018). Analyzing the ENVI-met microclimate model’s performance and assessing cool materials and urban vegetation applications–A review. Sustainable Cities and Society, 43: 55-76. https://doi.org/10.1016/j.scs.2018.08.009
[19] Chauhan, V.K., Dahiya, K., Sharma, A. (2019). Problem formulations and solvers in linear SVM: A review. Artificial Intelligence Review, 52(2): 803-855. https://doi.org/10.1007/s10462-018-9614-6
[20] Hu, R., Zhu, X., Zhu, Y., Gan, J. (2020). Robust SVM with adaptive graph learning. World Wide Web, 23(3): 1945-1968. https://doi.org/10.1007/s11280-019-00766-x
[21] Chauhan, V.K., Dahiya, K., Sharma, A. (2019). Problem formulations and solvers in linear SVM: A review. Artificial Intelligence Review, 52(2): 803-855. https://doi.org/10.1007/s10462-018-9614-6
[22] Ghezelbash, R., Maghsoudi, A., Carranza, E.J.M. (2019). Performance evaluation of RBF-and SVM-based machine learning algorithms for predictive mineral prospectivity modeling: integration of SA multifractal model and mineralization controls. Earth Science Informatics, 12(3): 277-293. https://doi.org/10.1007/s12145-018-00377-6
[23] Achirul Nanda, M., Boro Seminar, K., Nandika, D., Maddu, A. (2018). A comparison study of kernel functions in the support vector machine and its application for termite detection. Information, 9(1): 5. https://doi.org/10.3390/info9010005
[24] Muflikhah, L., Haryanto, D.J. (2018). High performance of polynomial kernel at SVM Algorithm for sentiment analysis. JITeCS (Journal of Information Technology and Computer Science), 3(2): 194-201. https://doi.org/10.25126/jitecs.20183260
[25] Higham, D.J., Higham, N.J. (2016). MATLAB guide. Society for Industrial and Applied Mathematics. https://doi.org/10.1137/1.9781611974669
[26] Mokhtari, C. (2004). Interpretation et classification multisource des image satellitaires par une approche hybride neuro-genetique. Diss. Université Mohamed Boudiaf des Sciences et de la Technologie-Mohamed Boudiaf d'Oran. https://www.pnst.cerist.dz/detail.php?id=23688, accessed on Jan. 17, 2023.