Majd Al Bayaty![]() | Eman Al Mousawi
| Eman Al Mousawi![]() | Udai A. Jahad
| Udai A. Jahad![]() | Ali Chabuk
| Ali Chabuk![]() | Ali Majdi
| Ali Majdi![]() | Nadhir Al-Ansari*
| Nadhir Al-Ansari*![]() | Jan Laue
| Jan Laue![]()
© 2023 IIETA. This article is published by IIETA and is licensed under the CC BY 4.0 license (http://creativecommons.org/licenses/by/4.0/).
OPEN ACCESS
The dynamic of nutrient cycling is a critical factor in riparian regions. It is essential to understand the behaviour of riparian areas in the maintenance and management river ecosystem. Sediment load, nutrients, and pathogens are transported to water bodies through land drainage and riverside flow. The classification of environmental agencies was poor for them. In this study, a qualitative investigation was implemented to determine the relationship between these practices and variations in nutrient retention for several types of riverbank soil. Also, the riverbank soils were including soil covered by wild reed plants. All the field works were along the Euphrates River in three locations. Moreover, study the variation in the content of vegetation riverbank soils from nitrogen, organic matter (OM), potassium (K), phosphorus (P), and PH. The results presented that riverbanks consider important locations for nutrient retention. Whilst agricultural activities have minimized the content of soil of OM (30%), N (49%), and K (3%), in subsurface soil but not so great lowering in surface layers. In contrast, management practices and human activities such as burning caused an apparent increase of OM (4%), N (77%), and a clear reduction in P (12%) content at both surface and subsurface layers of soil. Under all circumstances, riverbank soils showed a relative increase of nutrients at wet toe-slopes. Furthermore, it is noted that riparian vegetation and aquatic plants played a significant role by causing critical changes in riparian sides or even contrary effects on riverbank management practices and destruction of natural soil nutrient conditions. Thus, it should be carefully considered when evaluating the ecological impacts of riparian disturbances.
riparian, riverbanks, nutrients, land management, Euphrates River
Riverbanks are thought to be the primary areas for the intake and diversion of soil and nutrients in fluvial systems [1]. However, according to Bashir et al. [2], it is obvious that riverbanks frequently suffer from a variety of human-interest management approaches. Generalization can be challenging since the riverbank system's nutrient composition is always changing. The river soil is a great geochemical repository for nutrients and represented a natural buffer for the conveyance of other materials in the hydrosphere and biomass [3]. For this, it is the most important of this segment that seriously affects the overall quality of the aquatic environment. The previous studies recognized that soil nutrients have been taken as an important part when assessing the efficiency of riverbank restorations or when evaluating the effects of varied riverbank management methods [4, 5]. Nutrients in riverbanks soils are moved into rivers by erosion and not only by the way of surface flow but by ways of subsurface flow [6-8]. Although soils of riverbanks have been considered as a controlling tool to decrease the nutrient inputs into rivers, the lowering efficiency is not certainly creditable [9]. An incorrect riverbank management process would create unpredictable environmental consequences such as serious alimentary inputs [10]. Some water scientists have related the nutrient dynamics of riverbank soils with hydrogen-morphological attributes such as riverbank degradation [1, 11], geomorphic patterns [12], hydrologic connectivity [13], and sedimentation [14]. Therefore, assessing the status of the soil nutrient under various practices is necessary for the potential riverbank management process.
The change in seasonal climate can affect decomposition and nutrient processing in riverbanks [15]. The seasonal variation in characteristics of flood and groundwater exchange is likely to affect nutrient cycling. While Seasonal differences in N versus P retention by riverbanks could control the productivity of downstream ecosystems [16, 17]. While other studies have assessed the role of riverbanks in nutrient depression and tested the validity of riparian region formation [18], it is recognized that riverbanks are often suffering from inferior human management practices.
The Government of Iraq has identified that the degradation of lands and environment presented one crucial challenge affecting the country and causing high economic losses. However, these losses do not include loss of biodiversity, hidden cost of rehabilitation, and formation of land features. Other than leading to socio-economic problems such as insufficient water, food insecurity, and regular loss of livestock, besides decreases productivity, and cause more land degradation. Besides, current practices of land use management in the country are inconsonant with the ecological zones and impact the quality of riverbanks soils. Otherwise, in Iraq, limited knowledge is available in published studies about the interaction of nutrients with the availability of riverbank wild-reed cover under various management practices. On the other hand, water specialists have considered the nutrient distribution in riverbank soils would be effective variable as a response to the river regime and management process. The most serious state cause of riparian degradation in Iraqi rivers is poor land management mainly the destruction of natural vegetation in the watershed area through illegal farming activities.
The study aims to obtain detailed information about nutrients concentration as a basis for the safe use of riverbanks soils by (1) Identifying the change in the content of vegetation riverbank soils from nitrogen, organic matter, potassium, phosphorus, and pH level, (2) Assess the nutrient conditions having comparable aquatic plant cover but suffering from in insufficient land use management practices (3) and obtain detailed information about the soil properties of this important riverbank areas. Therefore, different zones along the Euphrates River path were monitored to determine whether the riverbank soil is quantitatively a net sink, source, or transformer of nutrients.
2.1 Site description
The systematic study was conducted along a part of the Euphrates River floodplains downstream Al Hindiyah barrage between latitudes (32° 31` 05 and 32° 36` 14) in the north and longitudes (44° 15` 30 and 44° 5 `22) in the east. It is only about (23) km away from the center of Karbala governorate and it is administratively bounded from the south by the province of Najaf. While the administrative borders of the province of Babylon constitute its eastern borders (Figures 1 and 2). The intensity of natural plants has played a significant role in the preservation of banks by strengthening the cohesiveness of soil and maintaining riverbanks through its roots. Additionally, it plays a part in reducing wind erosion and the pace at which water flows. The local population has utilized some riparian areas for agricultural purposes, which has negatively impacted the soils of riverbanks. Some riverbanks have deteriorated due to direct disturbance. Reeds are occasionally burned on the riverbanks next to agricultural areas as a complement to farming in those areas. Other times, floods have a substantial effect by moving banks of soils with river flow, which changes the physical and chemical characteristics of riparian soils. For more details to illustrate the various soil conditions and effects of land use management, three exemplary zones of the reed-covered riverbanks were chosen. The soils have been selected: with the agricultural activities along the riverbanks zone (AAR); with application reeds burning by fire in the riverbank zone (FBR); with no disturbances at the reed riverbank zone (NDR). For understanding soil nutrient status regarding land use management methods, the content and distribution of nutrients in the FBR and AAR zones are compared to the NDR soils. The comparison of soil nutrient content was done on basis of homogenous vegetation cover along an elevation gradient between a river channel (low) and dry land (high) during low flood season and there had been about many days without rains before sampling. Too much rain leaches nutrients from the soil.
2.2 Samples collection
In field measurements, the sampling process was done during the spring season with a mean temperature of 28 °C during the rain-free period and banks are wetted partially. It has avoided sampling under extremes of soil conditions (e.g., waterlogged or very dry soil) as possible. It was used a suitable facilitates and encourages the taking of more rather than fewer cores of uniform size and down to the full depth of sampling. Besides using a suitable tool and packaging that will not contaminate samples and then label samples.
In the sampling process, the soil samples were free of chalk or lime particles exist, and discard stones and plant debris as possible. But if any amount will be in the soil, grinding the soil for laboratory analysis pulverizes any solid particles.
Samples of riverbank soils were collected from three different zones to measure nutrient content and soil features associated with hydrologic connectivity. Eight sample points are placed at equal intervals along each transverse segment of the vertical transects, which are aligned perpendicular to the river course studied within each zone and cover the riverbank slope from top to bottom. The sampling area was performed in a (2.5m × 2.5m) quadrat plot in each of the pre-defined zones. Soil samples were collected from each site, at a depth of surface layer (0 - 15) cm and in the sub-surface layer (15 - 30) cm using a soil, Auger. Cumulative nutrient content that is quantified in soil layers may flush into the riverbanks from floodwater, precipitation, and atmospheric deposition. The soil samples were oven dried at 80 °C for 24 h, ground using a pestle and mortar, and sieved through a 2-mm mesh. The soil is naturally processed to remove impurities before testing. The samples were tested for pH level, extractable N, P, and K. The principal properties of soils were measured to examine the effect of metrics of hydrologic inputs on sediment texture, Soil color, Bulk density, Water capillary Capacity, Total Porosity, and total organic carbon.
Generally, for Soil pH and Nutrient availability, the soil pH (6.0 - 7.5) is acceptable for most plants as most nutrients become available in this pH range. Soil pH is important because it affects the availability of nutrients to plants. N, P, and K are the primary nutrients needed in fairly large quantities. Ca, Mg, and S are considered secondary nutrients required by the plant in lesser quantities. Zn and Mn are micronutrients required by the plant in very small amounts. Table 1 is illustrated the Relative amounts of the primary nutrients in the soil solution.
Analysis methods for soil pH and nutrient content are followed the American standard code. The soil pH was measured by using a glass electrode in a 1 mol/L of potassium chloride (KCl) solution. The availability of organic matter OM g/kg in soil was tested using the potassium dichromate volumetric method. The soil content of alkali nitrogen N determination based on the air-dried soils was hydrolyzed with 1.8 mol/L of (NaOH) solution.
The alkali nitrogen was direct input into a boric acid receiving solution of 20 g/L; the receiving solution was titrated using hydrochloric acid; then the alkali-hydrolysable nitrogen content in the soil sample was measured. The content phosphorus P content was measured using the (NaHCO₃) solution-Mo-Sb anti-spectrophotometric method. The content of potassium K in soil samples was measured using a flame photometer with Ammonium Acetate (C₂ H₇ NO₂) extraction.
2.3 Statistical analysis
Statistical analysis of data was performed to compare soil nutrient content in different riverbank reeds-covered zones. The statistical calculations to sketch figures and tables were achieved by using Excel for data processing and analysis. The significant differences in properties were compared for zone soils (AAR, FBR, and NDR) and both surface horizons (0 - 15 cm) and sub-surface horizons (15 - 30 cm). Likewise, a comparison of differences in nutrient contents of MO, N, K, and P between two zones (AAR and NDR); and (FBR and NDR) and between zones (AAR and FBR).
Table 1. The relative amounts (out of 100) of the essential primary nutrients required by most plants
|
Primary nutrients |
Amount |
|
Carbon(C) |
45 |
|
Oxygen(O) |
45 |
|
Hydrogen(H) |
6 |
|
Nitrogen(N) |
1.5 |
|
Potassium(K) |
1 |
|
Phosphorus(P) |
0.2 |
Figure 1. Schematic map of sampling sites
Figure 2. Sites sampling of (a): Riverbank soil with agricultural activities, (b) Riverbank soil with no disturbance, and (c) Riverbank soil with the application of fire
The Wilcoxon signed rank test, also known as the Wilcoxon-Mann-Whitney test, was used on two paired samples in XLSTAT to analyze the variation in concentration between the zones. This test is based on ranks that have a two-tailed performance. The test permitted comparisons between two groups or conditions without relying on the assumption that the values are distributed regularly. Using comparable p-value samples derived at probability (p=0.05), all statistical tests were assessed.
3.1 Samples properties
Results of evaluating the riparian soil characteristics along the Euphrates are presented in (Table 2). The quality of the soil, the proportion of organic nutrients, and the amount of organic carbon all affect the soil qualities in the top layer. In turn, no discernible modifications in the color or texture of the soil's subsurface symptoms were found along soil probe cores or in the subsurface soil. Samples of sieved soil revealed a very minor color shift across the soil's depth, ranging from very dark brown to very dark grey. For both topsoil and subsoil, the values of dry bulk density in (Table 2) have risen in the following order: FBR, AAR, and NDR.
The bulk density limit for silty soils was exceeded in the subsurface soil of the cultivation zone and reached a high value because of agricultural processes. Significantly lower dry bulk density in the top surface and sub-surface soil of FBR and AAR was caused by increased contents of humus, and the positive effect of permanent vegetation on the formation of soil porosity.
Porosity values, which control the detention of water and speed of the spatial transfer of nutrients and mobile organic colloids were increased with decreasing bulk density values. Capillary capacity was higher in the topsoil than in the subsoil higher total porosity and lower bulk density values in the topsoil imply higher aggregate stability and a minor effect of the flood on the breaking down of aggregates in these land-use types.
The soil texture has presented a variation in values along the slope of riverbanks. In the AAR site, the sieved soil is mainly composed of fine particles (clay + silt < 63µm) to indicate the proportion of the clay fraction. The clay fraction is 12.1%, while silt and sand fractions are 30.5%, and 57.4% respectively for the surface layer. Also, the consistency of texture for the subsurface layer is 13.5%, 31.8%, and 54.7% for clay, silt, and sand fraction respectively. In the sieved soil of the FBR zone, the percentage of fine clay is 10.1%, the sand fraction is 58.2% and the content of silt fractional is 31.7%. It gives a sandy loam texture to the surface layers. In the subsurface layer (15 - 30) m, a slight difference in texture fraction appeared with an increase in the percentage of clay to 13.2% and a decrease in the percentage of sand to about 53%.
The texture of the surface riverbanks of NDR evidence soil was in general silty, with a limitation of the clay at 16.5%, and a sand value of 36.8%. Also, the percentage of silt has been reported at 46.7% in the samples collected. There are no significant differences in the subsurface layer. The percentage of organic carbon content in the AAR soils is 3.71%, and extremely higher in the FBR to be 10.52%, and a value of 4.52% in NDR surface soils. The AAR, FBR, and NDR zones will have a reduction in the subsurface layer of 2.58, 2.34, and 1.3, respectively. However, the finer texture of these soils, which can have a significant state in the top surface layer to enable the adsorption of organic materials, is what determines this. Sand particles likely have organic carbon coatings present in coarse sediments. Nevertheless, the topsoil's C% concentration grew dramatically in FBR and reduced hardly in other zones, which is consistent with the erosion or aggravation of organic matter in the soil. But for all sorts of zones, it is significantly reduced in the subsurface layers.
Different carbon multi-cycling interruptions at various sorts of zones were the primary source of the varying C% concentrations. The soil has developed by sequent deposition and is constituted by a surface horizon that is varied from grey to black soil with an increase in organic matter. Also, some of these have a low bulk density to be subject to intense erosive processes that increase the content.
The mean distribution of nutrients on the riverbank slope is indicated in (Table 3) and (Figures 3, 4, 5, and 6). The content of organic matter OM at the surface layer (0 - 15 cm) in both AAR and FBR soils was more than in the NDR soils. While the subsurface soil appeared with a small variation of OM content over the AAR soil transect section. In similar, another increase in N content appeared in the FBR zone compared with NDR soil and the content of K has a high level in the FBR soil. A lower in the content of phosphorous P concentration appears in AAR soils. In comparison with the sub-surface layer (15 - 30cm), the availability of elements P and K in the AAR zone followed by NDR, and AAR soils is clearly at a lower level.
Through all, the values obviously presented that nutrient content is decreased gradually from the surface layer towards subsurface layer strata especially the AAR slope of soil. More variation was indicated along the surface layer for N concentration in the AAR than along the FBR and NDR soil transverse section. Similarly, the content of P and k at the AAR is lower than those of the FBR and NDR riverbank bottoms in both surface and subsurface layers.
Table 2. Basic parameters of the topsoil and Sub soil for the zones situated along a cross transect of Euphrates riverbanks
|
Zone |
Soil depth (cm) |
Soil color |
*Bulk density (g/100cm) |
Clay% |
Silt% |
Sand% |
Water capillary Capacity% |
Total Porosity% |
C% |
|
1 |
Soil With agriculture activities River Bank AAR (Sandy loam ) |
||||||||
|
0-15 |
10YR 4/3 |
112.5 |
12.1 |
30.5 |
57.4 |
32.6 |
44 |
3.71 ± 0.02 |
|
|
15-30 |
10YR 4/3 |
133.3 |
13.5 |
31.8 |
54.7 |
30.1 |
32 |
2.58 ± 0.01 |
|
|
2 |
Soil with fire Burning Reeds riverbanks FBR (Sandy loam) |
||||||||
|
0-15 |
10YR 3/2 |
88.6 |
10.1 |
31.7 |
58.2 |
39.6 |
61 |
10.52 ± 0.12 |
|
|
15-30 |
10YR 3/2 |
117.2 |
13.2 |
33.8 |
53.0 |
36.8 |
51 |
2.34 ± 0.01 |
|
|
3 |
Soils with no Disturbance Riverbanks NDR (Silt loam) |
||||||||
|
0-15 |
10YR 3/2 |
130.1 |
16.5 |
46.7 |
36.8 |
36.5 |
42 |
4.52 ± 0.02 |
|
|
15-30 |
10YR 3/2 |
149.6 |
18.7 |
40.2 |
41.1 |
31.4 |
40 |
1.3 ± 0.02 |
|
Table 3. The content of nutrients in the riverbank soil under different management practices
|
Riverbank Transect |
OM (g/kg) |
N (mg/kg) |
p (mg/kg) |
k (mg/kg) |
pH |
||||||
|
Mean |
SD |
Mean |
SD |
Mean |
SD |
Mean |
SD |
Mean |
SD |
||
|
Surface layer |
AAR |
13.62 |
5.97 |
13.4 |
5.82 |
8.25 |
1.83 |
31.78 |
10.24 |
8.53 |
0.07 |
|
FBR |
12.75 |
4.83 |
40.26 |
11.21 |
35.67 |
11.42 |
124.95 |
45.61 |
7.88 |
0.19 |
|
|
NDR |
11.26 |
4.47 |
26.41 |
8.96 |
28.89 |
9.35 |
36.66 |
11.86 |
8.13 |
0.09 |
|
|
Sub-surface layer |
AAR |
10.51 |
3.09 |
29.71 |
10.81 |
7.8 |
1.95 |
32.75 |
11.44 |
8.43 |
0.05 |
|
FBR |
13.25 |
5.22 |
31.38 |
10.54 |
31.29 |
4.67 |
27.63 |
9.72 |
8.09 |
0.18 |
|
|
NDR |
9.87 |
2.34 |
25.71 |
9.67 |
31.63 |
9.39 |
33.55 |
12.21 |
8.06 |
0.07 |
|
Note: Surface layer (0 - 15) cm, sub-surface (15 - 30) cm, Mean = mean of nutrients content, SD = the standard deviation of soil nutrients; OM: Organic Matter; N: alkali Nitrogen; P: available Phosphorus; K: Potassium; AAR: Agricultural activities riverbanks zone; application fire burning in riverbank zone (FBR); No Disturbances at riverbank zone (NDR).
Figure 3. The mean of OM and N content along the riverbank slope
3.2 Soil nutrients distribution along riverbank slope
The details of variation in the contents of OM and N concentration are illustrated in (Figure 3). There is a significant rise in OM content along the riverbank slope in AAR zone soil compare with FBR and NDR surface soil. Also, there is a slight reduction in subsurface layers. Flowing water is a natural process that refills soil with nutrients to riverbanks systems which are characterized by a high degree of variability in both frequency and period of inundation [19]. The previously inundated and partial drying of wet banks will lead to increase sediment affinity for P and will construct a zone for nitrification coupled with de-nitrification. Consequently, partial drying may reduce the availability of N and P [20].
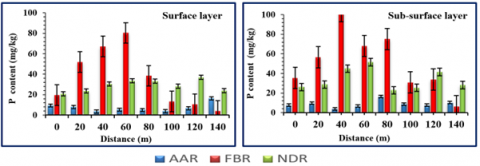
In general, Iraqi soils have moderate organic matter contents (1.3 - 4.8)% and are abundant in calcium carbonate mainly maintaining a moderate alkaline pH level (7.5 - 8.8) because of the influence of the geomorphic part and geographic site position. There are more flooded soils, highly gypsiferous with sandy substrate. The fertility of all soils is rather high, especially as regards nitrogen. On other hand, it’s observed an increase in N content at the middle part of the FBR slope while decreasing remarkably in the riverbank bottom in both surface and subsurface layers. In general, the N concentrations at the AAR riverbank bottom are lower than those at the FBR and NDR riverbank bottoms. In addition, a significant difference in phosphorous P content is identified through both the surface and subsurface layers of the slope of the riverbank (Figure 4). The concentration of P element in the transverse section of the AAR zone is smaller compared with FBR and NDR soils in both surface and subsurface layers. The concentration of the P element in the middle part is more amounts in each transverse section and decreased gradually with the riverbank slope toward the bank bottom.
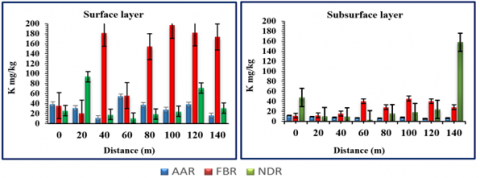
Moreover, the content of Potassium k is one of the primary macronutrients required by plants to complete their life span. It’s clear from the data in (Figure 5) that high differences between the three sites. Especially, an increase of k concentration occurring at the FBR site downward towards the bottom segment of the riverbank slope, it’s a sink to the K content. Besides, the results illustrated that the content of k is more concentrated at the surface than in the subsurface layer in all zones along the slope of the riverbank.
Figure 4. The mean of P content available along the riverbank slope
Figure 5. The distribution of K content along the riverbank soil
Overall, the results indicated there is apparent dissimilarity in soil nutrient content between the riverbanks soils. The disturbance of soil by burning has significantly increased nutrient content at the riverbanks. However, reed plant pervade has likely to increase the availability of nutrients content, and the residual of burning reeds produces black carbon which leads to increased organic matter content. While pH value creates a low content of carbonates [21]. Previous Studies have documented that black carbons can strongly affect the dynamics of riverbanks nutrient availability similarly directed by overflow fluctuation [22]. Other studies have explained that burning reeds can reduce the amount of nitrogen content N in soils because of the poor quality of litter produced by incomplete burning [23]. However, others claimed that fires can intensify the amount of N availability [24]. For the most, the cover of the reeds is easily burned by fire which produces a high amount of nitrogen and organic carbon and led to an increase in the amount of OM and N contents in the soils of the FBR site. In contrast, it has long been identified that agricultural practices minimize the availability of P content in soils [25]. The burning process is considered to be more beneficial to the accumulation of content P in soils [26]. Furthermore, agricultural practices may reduce nutrient content in the subsurface layers of riverbank soils and have a more serious influence on both P and K elements than on the OM and N.
3.3 The PH level along riverbank slope
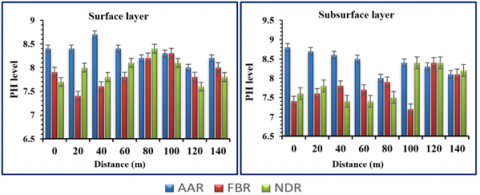
For the three zones, there is a slight fluctuation in pH level observed in the surface layer with the highest value of 8.7 in AAR soil and a low value of 7.4 in FBR (Figure 6) to indicate that most soils have been classified as alkali soils. All zones have shown higher PH at the surface layer than at the subsurface layer, besides noticeable variation between AAR, NDR, and FBR soils. The distribution of PH level in vertical strata is largest in the AAR zone and decreased gradually towards the downstream riverbank bottom. The soil of riverbanks is remarkably less alkali than soil formed in the FBR and NDR zones due to the change in humus contents in soil types. There was a clear difference between the sub-surface soil in the topsoil implying possible increased desorption of base cations by acidic compounds from decomposed organic matter. Moderate alkali reactions, with lower alkali in the subsoil, were found for sediments pH values significantly increased with sand contents in soil. Burning wild-reeds plants are in overall a supplementary practice for the farming area at the neighboring riverbanks. The intensity of burning severity reduced with the distance from the top of the riverbank to the bottom [27]. Therefore, the decrease in pH level is noticed along the downward direction of the riverbank slope and a relatively more concentration of OM is connected to the lowering of soil PH. In another case, the pH variation might be caused by the discharge of wastewater, photosynthesis, and other metabolic processes [28], and may be attributed to the deposition of the river by rainwater.
Figure 6. The distribution of PH levels along the riverbank slope
3.4 Nutrient distribution along the riverbank slope
The results demonstrated that the soil nutrient distribution pattern along the riverbank slope in both FBR and NDR sites is almost similar (Figures 3 to 6). While along the riverbank slope, there is a gradual decrease in nutrient content towards the bottom, suggesting that the nutrient distribution at the riverbank bottom should be closely considered when evaluating the mineralization impacts of riverbanks. It is also worth emphasizing that values obtained for the NDR and FBR zones to represent that burning may cause a remarkable increase of OM, N, P, and K contents in riverbank soils. The proportion of the soil nutrient content at the riverbank bottom was higher for the FBR soils than for the NDR soils. The effect of the agricultural process on soil nutrient distribution is clear for the subsurface layers, especially in the AAR soils which have varied a little along the riverbank slope, and the vertical variance of OM and N contents was obviously larger in the AAR than NDR soils.
Despite the significant differences in mean nutrient concentration in the AAR zone have resulted in a relative enhancement of the number of nutrients at the surface layer also there is a difference in P contents for both surface and subsurface along the AAR riverbank slope are evidently smaller. In addition, the soil nutrient contents at the AAR riverbank bottom were less than those at the NDR riverbank bottom. The P concentration has a strong relationship with fine particles and is affected by the pH level in all vegetation locations, it could be predicted that during overtopping water more deposit is settled and leading to a Rise in P content. The P content decreased with the rising of pH from 7 to 9 [20]. In comparison with the condition of reeds ashes zones, its visibly increased contents of all of OM, N, P, and K, besides pH level [27].
3.5 Nutrient inputs into the river
The riparian vegetation and aquatic plants play an important role in changes in the river ecosystem. Once the riverine vegetation is established, then it acts as an obstacle to the river flow besides trapping fine sediment with nutrients and resulting in the accumulation of material within the river [11]. There is a strong correlation between vegetation and the flow resistance of the vegetation canopy can result in sediment and plant propagation deposition leading to aggradation and spatial extension of vegetated patches within fluvial systems [15].
It's most visible for the FBR soils have a larger aggregation of soil nutrients at the riverbank bottom. The FBR soil can generate nutrient recycling at riverbanks and increase the number of nutrient inputs into the river. In turn, although there is a notable difference in surface OM, N, and K contents between the AAR and NDR soils, the subsurface layer indicates lower contents in the AAR soils and the accretion of nutrient contents at the AAR riverbank bottom is low. It is also worth noting that for both the surface and subsurface P contents were much more depressed in the AAR soils than in other soils. The agricultural practice may reduce the nutrient inputs (principally N, P, and K) into the river, besides the agricultural activities have intensified the relative fertility of nutrient content at the top layers and would make the soil a major part of the nutrient inputs into the river.
3.6 Correlation between zones and nutrient content
The results (Table 4) are presented with the statistical calculations of differences in soil nutrients between zones. The comparison between the AAR and NDR zones referred that the agricultural process imposed on the reed-covered riverbank has produced a considerable reduction in nutrient content in subsurface soil. In other cases, the application of burning has significantly risen the content of soil nutrients at the riverbanks. Vertically, the differences in the OM, N, and K contents in the AAR soil are higher than those in the NDR soils (p < 0.05). The subsurface FBR soils have more contents in the concentration of N, P, and K than the subsurface NDR soils, but the variation is not statistically important. At the top surface in the FBR zone, the OM and K contents soils are lower than those in the NDR soils (p < 0.05).
In addition, there are clear distinctions in soil nutrient content between the riverbank soils undergoing burning reeds and the soils affected by the agricultural process. The vertical differences in soil layer in the FBR soils had significantly higher contents of OM, N, P, and K than in the AAR soils (p < 0.05). The two pairs (AAR and FBR) especially in the top layer of FBR soils had notably fewer contents of P and K than the AAR soils (p < 0.05). For the AAR soils, the reduction in subsurface nutrient content may reduce P content in the soil profile, which is linked with the cut-off reeds, and consequently lead to the direct removal of soil nutrient sources. It’s observed that the change in the OM, N and K contents in surface AAR soil is the outcome of the soil-nutrient source clearing and the accelerated nutrient-alteration rate by burning.
According to the statistical study in Table 4, agricultural practices that may be connected to the burning of wild reeds can cause the pH value to increase. Burning by humans has disturbed the soil, perhaps lowered its pH value (p = 0.05), and engaged different pH distribution patterns along the riverbank slope.
Table 4. The non-parametric statistical test of differences in soil nutrients and pH value
|
Nutrients |
OM (g/kg) |
||
|
Paired samples |
AAR-NDR |
FBR -NDR |
AAR-FBR |
|
Surface layer |
0.421b |
0.029 c |
0.845 c |
|
Subsurface layer |
0.745c |
0.039 c |
0.073 c |
|
Vertical Difference |
0.051d |
0.675 d |
0.033 d |
|
N (mg/kg) |
|||
|
AAR-NDR |
FBR -NDR |
AAR-FBR |
|
|
Surface layer |
0.722 c |
0.029b* |
0.238 c |
|
Subsurface layer |
0.029 c* |
0.421b |
0.029 c* |
|
Vertical Difference |
0.0511 d |
0.513d |
0.311 c |
|
P (mg/kg) |
|||
|
AAR-NDR |
FBR -NDR |
AAR-FBR |
|
|
Surface layer a |
0.029 c * |
0.508 c |
0.039 c* |
|
Subsurface layer a |
0.029 c* |
0.074 b |
0.039 c* |
|
Vertical difference |
0.035 c* |
0.903 d |
0.95 d |
|
K (mg/kg) |
|||
|
AAR-NDR |
FBR -NDR |
AAR-FBR |
|
|
Surface layer a |
0.722 c |
0.029 b* |
0.029 c* |
|
Subsurface layer a |
0.029 c* |
0.238 b |
0.029 c* |
|
Vertical Difference |
0.765 d |
0.952 d |
0.95 d |
|
PH level |
|||
|
AAR-NDR |
FBR -NDR |
AAR-FBR |
|
|
Surface layer a |
0.057 b* |
0.029 c* |
0.029 b* |
|
Subsurface layer a |
0.029 b* |
0.045 c* |
0.029 b* |
|
Vertical Difference |
0.857 d |
0.057 d |
0.385 d |
Note a: the Wilcoxon signed-rank statistic test (2- tailed); b: based on W+ rank; c: based on W- rank; d: mann-Whitney test (2-tailed) and vertical variation between surface and sub-surface layers; (*): significant differences (P < 0.05) level are highlighted in sign.
The results of examining three exemplary riverbanks zones to state different conditions of soils with land use management practices indicated there is apparent dissimilarity in nutrient content between the riverbanks soils. The dynamics of nutrient distribution managed principally by riparian management practices besides flowing water and the wild-reed plants are an essential factor to increase the availability of nutrients and pH levels along riverbanks. As a consequence, the conclusion acquired from this search are as follows:
The authors would like to thank Lulea university of technology-Sweden and Al-Mustaqbal University College-Iraq for supporting the authors with the fund.
|
AAR |
Agricultural activities riverbanks zone |
|
FBR |
application fire burning in riverbank zone |
|
NDR |
No Disturbances at riverbank zone |
|
OM |
Organic Matter |
|
N |
alkali Nitrogen |
|
P |
available Phosphorus |
|
K |
Potassium |
|
CFD |
Computational fluid dynamics |
|
SSR |
Subsurface riverbanks zone |
[1] Hupp, C.R., Walbridge, M.R., Lockab, B.G. (2005). Fluvial Geomorphic Process and Landsforms, Water Quality and Nutrients In Bottomland Hardwood Forests of Southern USA. In Ecology And Management Bottom Land Hardwood System, Fredrickson LH. King SL, Kaminski RM(eds). University of Missouri: Puxico: pp. 37-55.
[2] Bashir, M. A., Rehim, A., Liu, J., Imran, M., Liu, H., Suleman, M., & Naveed, S. (2019). Soil survey techniques determine nutrient status in soil profile and metal retention by calcium carbonate. Catena, 173: 141-149. https://doi.org/10.1016/j.catena.2018.10.015
[3] Ye, C., Chen, C., Butler, O. M., Rashti, M. R., Esfandbod, M., Du, M., Zhang, Q. (2019). Spatial and temporal dynamics of nutrients in riparian soils after nine years of operation of the Three Gorges Reservoir, China. Science of the Total Environment, 664: 841-850. https://doi.org/10.1016/j.scitotenv.2019.02.036
[4] Heimann, D. C., Morris, D. M., & Gemeinhardt, T. R. (2015). Nutrient contributions from alluvial soils associated with the restoration of shallow water habitat in the lower Missouri River. River Research and Applications, 31(3): 323-334. https://doi.org/10.1002/rra.2742
[5] Ahilan, S., Guan, M., Sleigh, A., Wright, N., Chang, H. (2018). The influence of floodplain restoration on flow and sediment dynamics in an urban river. Journal of Flood Risk Management, 11: S986-S1001. https://doi.org/10.1111/jfr3.12251
[6] Klaus, V. H., Sintermann, J., Kleinebecker, T., & Hölzel, N. (2011). Sedimentation-induced eutrophication in large river floodplains–An obstacle to restoration?. Biological Conservation, 144(1): 451-458. https://doi.org/10.1016/j.biocon.2010.09.031
[7] Liu, X., Vidon, P., Jacinthe, P.A., Fisher, K., Baker, M. (2014). Seasonal and geomorphic controls on N and P removal in riparian zones of the US Midwest. Biogeochemistry, 119: 245-257. https://doi.org/10.1007/s10533-014-9963-4
[8] Ishee, E.R., Ross, D.S., Garvey, K.M., Bourgault, R.R., Ford, C.R. (2015). Phosphorus characterization and contribution from eroding streambank soils of Vermont's Lake Champlain Basin. Journal of Environmental Quality, 44(6): 1745-1753. https://doi.org/10.2134/jeq2015.02.0108
[9] Wolf, K.L., Noe, G.B., Ahn, C. (2013). Hydrologic connectivity to streams increases nitrogen and phosphorus inputs and cycling in soils of created and natural floodplain wetlands. Journal of Environmental Quality, 42(4): 1245-1255. https://doi.org/10.2134/jeq2012.0466
[10] Bahr, E., Zaragocin, D.C., Makeschin, F. (2014). Soil nutrient stock dynamics and land-use management of annuals, perennials and pastures after slash-and-burn in the Southern Ecuadorian Andes. Agriculture, Ecosystems & Environment, 188: 275-288. https://doi.org/10.1016/j.agee.2014.03.005
[11] Steiger, J., Gurnell, A.M. (2003). Spatial hydrogeomorphological influences on sediment and nutrient deposition in riparian zones: observations from the Garonne River, France. Geomorphology, 49(1-2): 1-23. https://doi.org/10.1016/S0169-555X(02)00144-7
[12] Poole, G.C. (2010). Stream hydrogeomorphology as a physical science basis for advances in stream ecology. Journal of the North American Benthological Society, 29(1): 12-25.
[13] Powell, W. G. (2009). Identifying land use/land cover (LULC) using data as a hydrologic model input for local floodplain management [research report]. San Marcos, TX: Texas State University.
[14] Sleutel, S., Moeskops, B., Huybrechts, W., Vandenbossche, A., Salomez, J., De Bolle, S., Buchan, D., De Neve, S. (2008). Modeling soil moisture effects on net nitrogen mineralization in loamy wetland soils. Wetlands, 28: 724-734. https://doi.org/10.1672/07-105.1
[15] Gmitrowicz-Iwan, J., Ligęza, S., Pranagal, J., Smal, H., Olenderek, H. (2020). Small floodplain reservoirs in the face of climate change—sink or source of nutrients?. Water, 12(12): 3423. https://doi.org/10.3390/w12123423
[16] Dezzeo, N., Herrera, R., Escalante, G., Chacón, N. (2000). Deposition of sediments during a flood event on seasonally flooded forests of the lower Orinoco River and two of its black-water tributaries, Venezuela. Biogeochemistry, 49: 241-257. https://doi.org/10.1023/A:1006375101368
[17] Olde Venterink, H., Vermaat, J.E., Pronk, M., Wiegman, F., Van Der Lee, G.E., Van Den Hoorn, M.W., Verhoeven, J.T. (2006). Importance of sediment deposition and denitrification for nutrient retention in floodplain wetlands. Applied Vegetation Science, 9(2): 163-174. https://doi.org/10.1111/j.1654-109X.2006.tb00665.x
[18] Hupp, C.R. (2000). Hydrology, geomorphology and vegetation of Coastal Plain rivers in the south‐eastern USA. Hydrological processes, 14(16-17): 2991-3010. https://doi.org/10.1002/1099-1085(200011/12)14:16/17%3C2991::AID-HYP131%3E3.0.CO;2-H
[19] Humphries, M. (2008). Sedimentation and chemical processes on the lower Mkuze floodplain: Implications for wetland structure and function (Doctoral dissertation).
[20] Ross, G., Haghseresht, F., Cloete, T.E. (2008). The effect of pH and anoxia on the performance of Phoslock®, a phosphorus binding clay. Harmful Algae, 7(4): 545-550. https://doi.org/10.1016/j.hal.2007.12.007
[21] Mayer, S., Kölbl, A., Völkel, J., Kögel-Knabner, I. (2019). Organic matter in temperate cultivated floodplain soils: Light fractions highly contribute to subsoil organic carbon. Geoderma, 337: 679-690. https://doi.org/10.1016/j.geoderma.2018.10.014
[22] Xue, X.H., Chang, S., Yuan, L.Y. (2017). Soil nutrient concentration and distribution at riverbanks undergoing different land management practices: Implications for riverbank management. In IOP Conference Series: Earth and Environmental Science, 82(1): 012035. https://doi.org/10.1088/1755-1315/82/1/012035
[23] Bashir, M.A., Wang, H., Pan, J., Khoshnevisan, B., Sun, W., Zhai, L., Zhang, X., Wang, N., Rehim, A., Liu, H. (2021). Variations in soil nutrient dynamics and their composition in rice under integrated rice-crab co-culture system. Journal of Cleaner Production, 281: 125222. https://doi.org/10.1016/j.jclepro.2020.125222
[24] Zavadsky, I., Krstajić, J. (2019). International commision for the protection of the danube river–an overview. Water Research and Management, 9(2): 17-26.
[25] Rehim, A., Khan, M., Imran, M., Bashir, M.A., Ul-Allah, S., Khan, M.N., Hussain, M. (2020). Integrated use of farm manure and synthetic nitrogen fertilizer improves nitrogen use efficiency, yield and grain quality in wheat. Italian Journal of Agronomy, 15(1): 29-34. https://doi.org/10.4081/ija.2020.1360
[26] Hanfi, M.Y., Mostafa, M.Y., Zhukovsky, M.V. (2020). Heavy metal contamination in urban surface sediments: sources, distribution, contamination control, and remediation. Environmental Monitoring and Assessment, 192: 1-21. https://doi.org/10.1007/s10661-019-7947-5
[27] Fu, B., Merritt, W.S., Croke, B.F., Weber, T.R., Jakeman, A.J. (2019). A review of catchment-scale water quality and erosion models and a synthesis of future prospects. Environmental Modelling & Software, 114: 75-97. https://doi.org/10.1016/j.envsoft.2018.12.008
[28] Yu, B., Xie, C., Cai, S., Chen, Y., Lv, Y., Mo, Z., Liu, T., Yang, Z. (2018). Effects of tree root density on soil total porosity and non-capillary porosity using a ground-penetrating tree radar Unit in Shanghai, China. Sustainability, 10(12): 4640. https://doi.org/10.3390/su10124640