Susni Herwanti | Indra Gumay Febryano* | Slamet Budi Yuwono | Muhammad Alfatikha | Hendra Prasetia | Machya Kartika Tsani | Surnayanti
© 2022 IIETA. This article is published by IIETA and is licensed under the CC BY 4.0 license (http://creativecommons.org/licenses/by/4.0/).
OPEN ACCESS
Agroforestry has many benefits, especially in improving the economy and food security. The purpose of this study was to analyze food availability and the level of community food security in Pahawang Island, Indonesia. The data were analyzed descriptively and based on the House hold food security access scale (HFSAS) on 9 variables. The results showed that the food provided from the agroforestry area consisted of vegetables, fruits, tubers and empon-empon while the food that could not be provided from the agroforestry area was rice, fish, tempeh, tofu, chicken, meat and others. etc. are obtained from the sale of agroforestry products. The revenue from this agroforestry product reaches Rp. 641,085, 000 per year or equivalent to 64,108.5 kilograms of rice per year. This means that for 14 days the community can survive if Pahawang Island experiences a disaster that causes people to be unable to leave the island. Based on the calculation results, the average food security score of Pahawang Island is included in the category of moderately food security with a score of 15.6. Agroforestry management in Pahawang Island needs to be maintained because it has proven to be able to improve community food security. The addition of commercial plant species also needs to be done, especially from the types of fruits and woody plants.
agroforestry, food security, food availability, Pahawang Island
Agroforestry is a land management system aimed at overcoming problems due to land conversion and, at the same time overcoming food problems, where woody plants (trees) are planted in the same land management unit as crops and livestock or animals [1]. Agroforestry also has multiple functions, including being able to increase food supply, income, and public health so that community food security increases [2, 3] through intensively sustainable agricultural practices [4]. Agroforestry is widely regarded as a potential strategy that will help farmers adapt to mitigation and adaptation changes, increase low agricultural productivity and contribute to food provision at the household scale [5]. The availability of food based on agroforestry is one of the benchmarks for the community's welfare, especially for people whose lives depend on the land. People who can meet their food needs have good growth and are healthy and prosperous. On the other hand, people who are not food resistant will experience hunger, malnutrition, health problems, and even death [6].
At the 1996 World Food Summit, it was stated that food security occurs when all people, at all times, have physical and economic access to safe and nutritious food that meets their dietary needs and food preferences for an active and healthy life [7]. Furthermore, Mayrowani and Ashari [8] state that food security is a condition where food is fulfilled for households reflected insufficient food, both in quantity and quality, safe, equitable, and affordable considering that food is a factor directly related to national stability. Therefore, food security in an area is an essential factor the Indonesian government considers, especially on Small Islands vulnerable to disasters.
BPS [9] stated that as the largest archipelagic country in the world, consisting of about 13,677 large and small islands, Indonesia, in addition to having a wealth of abundant coastal natural resources, also has a very high potential for natural disasters, namely between including earthquakes, tsunamis, soil, and rock mass movements, volcanic eruptions and tidal waves, floods, abrasion, accretion, seawater intrusion, and strong winds [10, 11]. This high potential for disaster if it is not supported by adequate food security, the lives of coastal communities will be increasingly threatened considering that Small Islands have distinctive characteristics, such as their remote and isolated location from their parent islands, making them very vulnerable to changes caused by nature or humans, have limited carrying capacity of the island and are highly dependent on economic development outside the island, both the main island and the continent.
Coastal communities whose economic life depends on marine and coastal resources generally make a living as fishermen, fishing laborers, cultivators of fish/other marine organisms, fish traders, etc. [12]. However, in certain areas, coastal communities work not only in the marine sector but also in the agricultural sector as agroforestry farmers. Therefore, this agroforestry community will undoubtedly have better food security than people who only rely on business from the sea, especially people whose areas are prone to natural disasters. Therefore, research on the role of agroforestry in supporting food security on the small island needs to be carried out to improve the quality of life of the people on the small island. Therefore, this study aims to analyze the food availability of the community on the small island and analyze the level of food security of the community on the small island.
2.1 Research location
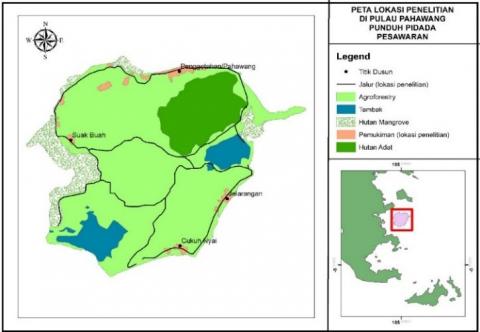
This research was conducted from November to December 2019 in Pahawang Island, Marga Punduh District, Pesawaran Regency, Lampung Province, Indonesia. Pulau Pahawang Island has five subvillages. The subvillages are Cukuh Nyai, Suak Buah, Penggetahan, Jeralangan, and Pahawang [13]. The reason for choosing the location is because the subvillages are close to each other, and the people in the hamlet manage their land with an agroforestry system. The map of the research location is presented in Figure 1.
Figure 1. Research location
2.2 Sampling method
The data was collected in the form of primary and secondary data. Primary data includes name, age, education level, occupation, number of family dependents, area of agroforestry land, and total income from agroforestry land. Secondary data includes data that is already available in written notes. This data includes population data, community agroforestry land area, and a general description of the research location. Data collection techniques were carried out through structured interviews using questionnaires, observations of the activities of forest farmers in agroforestry management efforts to support food security on Pahawang Island, and documentation studies. The feasibility test of the questionnaire was first carried out by distributing questionnaires to several respondents. The questionnaire used is a questionnaire that is declared feasible, meaning that the questions in the questionnaire are understood by the respondent so that they are feasible to use.
2.3 Respondents determination
Determination of respondents was carried out by purposive sampling of the total number of family heads as many as 412 using the Slovin formula as follows:
n=N/(1+Ne2) (1)
where, n is number of samples, N is total population, e is error value tolerance (15%). Based on Slovin's formula, the number of samples taken was 41 respondents who were taken by proportional sampling for each hamlet. Respondents selected as samples are farmers who manage agroforestry.
2.4 Data analysis
Data analysis carried out in this study includes:
a. Analysis of food availability by looking at whether the food in the agroforestry area is always available for consumption every day. This is done by identifying the types of vegetables, fruits, tubers, and grains that are consumed by the people on Pahawang Island every day. The analysis was done descriptively.
b. Descriptive analysis of the level of community food security in Pahawang Island. Food security is measured based on the House hold food security access scale (HFSAS) against 9 items consist of: worried that the family is not eating enough, unable to eat the type of food you like at certain times, food variety is limited during certain months, eating foods, you don't like at certain times, eat smaller portions of food than usual due to lack of resources, eat less food in a day because there is not enough food, not eating anything at certain times, family members sleep hungry when there's not enough food, and go all day without food as long as there is not enough food. Statements using 5 scales, namely not all=0, rarely=1, sometimes=2, often=3, very often=4 [14, 15]. Access to household food security is calculated using the Weight Mean Score (WMS) [15]. According to Sugiyono [16] the calculation of the Weight Mean Score (WMS) formula that has been adjusted to the needs of the study is as follows:
$W M S=\sum_{i=0}^4 \frac{\sum \text { respondents on scale } i x \text { scale value }}{\text { Total respondent }(n)}$ (2)
where, WMS is Average score of access to food security.
A low WMS score means that access to food security is high, while a high WMS score means that access to food security is low. We are determining the level of household food security using a predetermined scale. A low scale indicates food security, a medium scale indicates sufficient food, and a large scale means not food security. The maximum possible value obtained is 36, and the minimum value is 0. The determination of food security uses three categories, namely food security (0-12), moderately food security (12-24), and not food security (24-36).
3.1 General condition of research area
Pahawang Island is part of the islands located in Lampung Bay, Marga Punduh District, Pesawaran Regency, Lampung Province, with 1,020 hectares. This island is located at an altitude of 10–131 m above sea level with topographic conditions consisting of beaches, swamps, land, and hilly areas. According to Davinsy et al. [17] the people of Pahawang Island generally make a living as farmers, laborers, and fishers. This livelihood is carried out by residents alternately depending on the season they face. For example, residents turn to tourism service providers during the holiday seasons, but if agriculture and tourists decrease, people will turn to fishers.
In rural communities that work as farmers, the community manages land in an agroforestry manner with 830.86 ha. According to Alfatikha et al. [18] the composition of plant species found in agroforestry land in Pahawang Island consists of 5 types of vegetables, eight types of fruits, two types of tubers, three types of empon-empon, and three types of industrial plants, which are classified as into 17 types of families (Table 1).
3.2 Socio-economic characteristics of Pahawang Island community
The socio-economic characteristics of the people of Pahawang Island are almost the same as the characteristics of rural communities in Indonesia in general. This situation is because socio-economic characteristics themselves are inherent in the household and will affect socio-economic conditions and decision-making [19, 20]. In this study, the characteristics studied were: age, number of dependents in the family, education, area of arable land, and income.
Most of the respondents (71%) were in the productive category, namely between 15-64 years old, and the remaining 29% were over 64 years old. According to Yulida et al. [21] farmers of productive age have solid physical abilities, so they contribute more labor to their farms so that production is expected to increase whereas older farmers have decreased physical ability to cultivate the land [22]. Older farmers in Pahawang Island still work as agroforestry farmers. This condition is because they feel they are still strong or are forced to work to earn income. After all, there is no regeneration of farmers. The children of farmers, after formal schooling, usually migrate to other areas to seek work experience outside the agricultural sector [23]. Andini et al. [24] stated that farmers are still working in old age because they do not have an old age guarantee (pension), so they must continue to work as long as no one guarantees their life. According to Baliton et al. [25] this condition presents a threat to the sustainability of the agroforestry system because not all family members are willing to be trained to develop and maintain their farms.
The number of dependents in the family is the number of all family members who are still in school and not or not working, where all the necessities of life are borne by the head of the family/head of the household, which will affect the activities and ways of making decisions as well as the ability of farmers to manage agroforestry land farming. The results showed that most family dependents in Pahawang Island amounted to more than five people. The family size is quite large, indicating the availability of labor to adopt high agroforestry technology [26-28]. Therefore, this technology indirectly provides an opportunity to increase income in Pahawang Island.
Table 1. Types of Agroforestry Crops in Pahawang Island
|
No |
Types of Agroforestry Crops |
Scientific name |
Family |
|
|
Vegetables |
|
|
|
1 |
Jengkol |
Pithecellobium lobatum |
Mimosaceae |
|
2 |
Petai |
Parkia speciosa |
Mimosaceae |
|
3 |
Long beans |
Vigna cylindrica |
Leguminosae |
|
4 |
Chilli |
Capsicum frutescens |
Solonaceae |
|
5 |
Tomato |
Lycopersicon esculentum |
Solonaceae |
|
6 |
Gnetum |
Gnetum gnemon |
Gnetaceae |
|
|
Fruits |
|
|
|
7 |
Mango |
Mangifera indica |
Anacardiaceae |
|
8 |
Banana |
Musa sp |
Musaceae |
|
9 |
Coconut |
Cocos nucifera |
Arecaceae |
|
10 |
Duku |
Lansium domesticum |
Meliaceae |
|
11 |
Rambutan |
Nephelium lappaceum |
Sapindaceae |
|
12 |
betel nut |
Areca catechu |
Araceae |
|
13 |
Avocado |
Persea Americana |
Lauraceae |
|
14 |
Durian |
Durio zibethinus |
Bombaceae |
|
|
Tubers |
|
|
|
15 |
Gadung |
Dioscorea hispida |
Dioscoreaceae |
|
16 |
Cassava |
Manihot esculenta |
Euphorbiaceae |
|
|
Horticulture |
|
|
|
17 |
Clove |
Eugenia aromatica |
Myrtaceae |
|
18 |
Cocoa |
Theobroma cacao |
Malvaceae |
|
|
Woody Plants |
|
|
|
19 |
Bayur |
Pterospermum javanicum |
Malvaceae |
|
20 |
Waru Mountain |
Hibiscus similis |
Malvaceae |
|
21 |
Sengon |
Paraserianthes falcataria |
Fabaceae |
|
|
Spices |
|
|
|
22 |
Turmeric |
Curcuma longa |
Zingiberaceae |
|
23 |
Laos |
Alpinia galanga |
Zingiberaceae |
|
24 |
Ginger |
Zingiber officinale |
Zingiberaceae |
The education level of agroforestry farmers is dominated by an elementary school (SD) 59%. These data indicate that the level of education of farmers is relatively low. Low education and implications for the lack of good agricultural planning will also affect other types of work carried out by farmers to increase income, and the choice of work is limited to the informal sector [29]. Besides that, education affects farmers in managing their agroforestry land farming because a person's level of education and knowledge will help them think globally and considerately [30]. Education dramatically determines the level of competence of farmers in carrying out agricultural activities [31]. The higher the level of education, the higher the awareness to adopt technology. Educated farmers have better access to information and innovation.
The land cultivated by farmers varies from 0.5 to 4 ha, with an average land area of 1.5 ha, and about 19 respondents, or 46%, own land with a broad category (> 2 ha). According to Hernanto [32] the area of arable land is classified into three groups: narrowly less than 0.5 ha, a medium between 0.5 ha-2 ha, and an area of more than 2 ha. Farmers who have narrow land tend to be reluctant to invest in trees and conserve soil and vice versa. Smallholder farmers also prefer to invest in short term crops with continuous yields even if the yields are small. This is because most smallholder farmers need certainty of short-term income from uncertain long-term income [33].
The results showed that almost 85% or about 35 respondents had a total income ranging from Rp. 10,000,000-Rp. 30,000,000/year (where US $1 = Rp 15,095.10). The total income comes from agroforestry income and non-agroforestry income such as trading, fishing, carpentry, etc. Agroforestry income is smaller than non-agroforestry income. The average agroforestry income obtained by the respondents is Rp. 9,492,683/year, and the average non-agroforestry income is Rp. 21,402,439/year. Income from agroforestry varies between 0-44,000,000 rupiah per year. The diversity of agroforestry income is obtained due to the presence of different types of commercial crops between respondents, the presence of pests and diseases, the influence of the season that causes crop failure, and some respondents have just purchased land so that they have not yet obtained results from agroforestry land.
3.3 Food availability of Pahawang Island community
Food availability can be obtained from own production, food supply from outside (imports), food reserves, and food assistance [34]. Food production is expected to provide food at affordable prices for consumers. However, food availability is highly dependent on food production, which is heavily influenced by natural, physical, and human resources. Therefore, the food availability of the people of Pahawang Island is very dependent on the production of agroforestry plants. Food is provided from agroforestry land in vegetables, fruits, tubers, and empon-empon. The most widely available food in Pahawang Island is Gadung. Gadung is a type of tuber plant widely processed into snacks in Pahawang Island [18]. Increasing the contribution of root crops as an alternative food source in meeting the need for quality food can significantly influence food security and the quality of resources for low-income communities [35]. Muliawati et al. [36] stated that the diversity of plant species can be a source of food reserves in facing uncertain crop yields as an impact of global climate change. According to Herwanti et al. [37], the more types of plants, the more abundant the food is available in the agroforestry land. The food availability from the agroforestry land is presented in Table 2.
Food that cannot be provided from agroforestry lands, such as rice, fish, tempeh, tofu, chicken, meat, and so on, is obtained from the sale of agroforestry products. Apart from being used for consumption (subsistence), agroforestry products are also sold to get cash so that the receipt of each type can be known. The highest revenues from vegetables, fruits, tubers, industrial plants, timber, and empon-emponan were gnetum, rambutan, gadung, cloves, and ginger, respectively, while the highest revenues for all categories came from fruits. There is no acceptance of woody plants because the woody plants are not yet old enough to be harvested. Revenue from agroforestry products is influenced by several factors: the number of respondents, selling price, and annual crop productivity. Duffy et al. [38] stated that studies of agroforestry in commercial homegardens increased food availability and food utilization indirectly through income generation although the the outputs are recognized was less diverse, whereas agroforestry from traditional homegarden was more successful in providing food diversity and nutritional security. Traditional agroforestry applied to home gardens in Vietnam is able to better protect individuals from health shocks such as malnutrition because it has a variety of species [39]. Table 3 and 4 show agroforestry production and the acceptance details for each category equal to rice.
When equivalent to rice, this revenue can be one of the predictors of food security. According to Darwanto [40], Santosa and Sudrajat [41] rice is the main food commodity that significantly affects food security in Indonesia, so the availability of rice stocks that can be provided nationally is one of the factors that can affect food security. BPS [42] stated that the household rice consumption participation rate in Indonesia is around 72% in 2019. This result means that only 28 percent of households do not consume rice as a staple food. With the growing population and lack of food diversification, the need for rice as the primary food ingredient will continue to increase.
The results showed that the rice needs of respondents in Pahawang Island were 4,510 kg/year. This rice need can be met through cash purchases from agroforestry products. The yield of agroforestry from vegetables, fruits, tubers, industrial plants, woody plants, and empon-emponan has obtained a total of Rp 641,085,000 per year. When converted into several kilograms of rice as Indonesia's minimum food requirement [43] yields 64,108.5 kg of rice per year, with the price of rice being IDR 10,000 per kg in the study area. This result means that the people of Pahawang Island, who manage agroforestry, can survive for 14 days if Pahawang Island experiences a natural disaster by only consuming rice as the minimum food requirement. Furthermore, based on the Decree of the Minister of Health of the Republic of Indonesia in 2001, there is at least a rescue phase that can last for five days after a disaster occurs. This result means that one category of agroforestry can meet the minimum standard of rescue from disasters on Pahawang Island, namely fruits, and overall agroforestry in Pahawang Island exceeds the minimum standard of rescue. Therefore, agroforestry can be said to be able to increase food security due to natural disasters through cash income and from agroforestry results. In line with the study of [44], agroforestry systems are practiced for mitigation strategies in dealing with volcanic hazards and risks and increasing disaster resilience [45]. The survival ability of the Pahawang Island Community based on each agroforestry category is presented in Table 5.
Table 2. Food availability from agroforestry land
|
No |
Types of Food Crops Agroforestry |
Number of Respondents (people) |
Food availability (%) |
Number of Respondents (people) |
Food Unavailability (%) |
|
1 |
Chilli |
36 |
88 |
5 |
12 |
|
2 |
Long beans |
14 |
34 |
27 |
66 |
|
3 |
Tomato |
21 |
51 |
20 |
49 |
|
4 |
Gnetum |
25 |
61 |
16 |
39 |
|
5 |
Jengkol |
22 |
53 |
19 |
47 |
|
6 |
Petai |
21 |
51 |
20 |
49 |
|
7 |
Banana |
35 |
85 |
6 |
15 |
|
8 |
Coconut |
25 |
61 |
16 |
39 |
|
9 |
Mango |
20 |
49 |
21 |
51 |
|
10 |
Duku |
15 |
37 |
26 |
63 |
|
11 |
Rambutan |
14 |
34 |
27 |
66 |
|
12 |
Avocado |
17 |
41 |
24 |
59 |
|
13 |
Durian |
11 |
27 |
30 |
73 |
|
14 |
betel nut |
20 |
49 |
21 |
51 |
|
15 |
Ginger |
29 |
71 |
12 |
39 |
|
16 |
Cassava |
11 |
27 |
30 |
73 |
|
17 |
Laos |
25 |
61 |
16 |
39 |
|
18 |
Turmeric |
21 |
51 |
20 |
49 |
|
19 |
Gadung |
38 |
93 |
3 |
7 |
|
20 |
Clove |
36 |
88 |
5 |
12 |
|
21 |
Cocoa |
29 |
71 |
12 |
29 |
Table 3. Agroforestry production for each category
|
No |
Types of plants |
Respondents who planted |
Harvest Frequency |
Yield/month |
Yield/year |
|
Vegetables category |
|||||
|
1 |
Jengkol |
22 |
2 times a year |
1 quintal/6 months |
2 quintal |
|
2 |
Petai |
21 |
2 times a year |
1.5 empong/month |
3 puffs |
|
3 |
Chilli |
36 |
2 times a week |
0.7 kg/week |
28 kg/year |
|
4 |
Gnetum |
25 |
2 times a year |
50 kg |
100 kg |
|
5 |
Long beans |
14 |
1 time a month |
1 kg |
12 kg |
|
Fruits category |
|||||
|
1 |
Banana |
35 |
12 times a year |
5 bunches |
60 bunches |
|
2 |
Mango |
30 |
2 times a year |
20 kg |
40 kg |
|
3 |
Duku |
15 |
1 time a year |
Ton |
Ton |
|
4 |
Rambutan |
14 |
1 time a month |
1 quintal |
12 quintals |
|
5 |
Avocado |
17 |
4 times a year |
1 quintal |
4 quintal |
|
6 |
Durian |
11 |
2 times a year |
40 fruits |
80 fruits |
|
7 |
Cocoa |
29 |
every 3 years |
25 kg |
75 kg |
|
8 |
Tomato |
21 |
4 times a year |
1 kg |
4 kg |
|
Tubers category |
|||||
|
1 |
Gadung |
38 |
5 times a year |
10 kg |
50 kg |
|
2 |
Cassava |
11 |
4 times a year |
20 kg |
80 kg |
|
Industrial plants category |
|||||
|
1 |
Clove |
36 |
Once a year |
50 |
50 |
|
2 |
Betel nut |
20 |
Every 4 years |
10 |
40 |
|
3 |
Coconut |
25 |
4 times a year |
1 quintal |
4 quintal |
|
Category of woody plants |
|||||
|
1 |
Bayur |
35 |
every 5 years |
|
|
|
2 |
Waru Mountain |
36 |
every 5 years |
|
|
|
3 |
Sengon |
25 |
every 5 years |
|
|
|
Empon-empon category |
|||||
|
1 |
Turmeric |
21 |
12 times a year |
2 kg |
24 kg |
|
2 |
Laos |
25 |
12 times a year |
1 kg |
12 kg |
|
3 |
Ginger |
29 |
12 times a year |
1 kg |
12 kg |
Table 4. Acceptance of agroforestry products equal to rice
|
No |
Types of plants |
Utilization |
Selling Price (Unit) |
Rice demand based on vegetable agroforestry production (rice price 10,000/kg) |
||||
|
Consumed |
% |
Sell |
% |
Processed |
Unprocessed |
|
||
|
Vegetables category |
||||||||
|
1 |
Jengkol |
√ |
30 (7) |
√ |
70 (15) |
- |
Rp 15,000/kg - |
66,000,000 |
|
2 |
Petai |
√ |
40 (8)
|
√ |
60 (13) |
- |
Rp 40,000/empong - |
2,520,000 |
|
3 |
Chilli |
√ |
60 (22) |
√ |
40 (14) |
- |
Rp 35,000/kg |
35,280,000 |
|
4 |
Gnetum |
√ |
80 (20) |
√ |
20 (5) |
- |
Rp 30,000/kg |
87,500,000 |
|
5 |
Long beans |
√ |
100 |
- |
- |
- |
- |
1,680,000 |
|
Total |
Rp. 192,980,000 or the equivalent of 19,298 kg of rice/year |
|||||||
|
Fruits category |
||||||||
|
1 |
Banana |
√ |
20 (7) |
√ |
80 (28) |
- |
Rp 15,000/tandan - |
31,500,000 |
|
2 |
Mango |
√ |
70 (21) |
√ |
30 (9) |
- |
Rp 5,000/kg |
6,000,000 |
|
3 |
Duku |
√ |
20 (3) |
√ |
80 (12) |
- |
Rp 1,000,000/ 500 kg (1/2 ton) |
37,500,000 |
|
4 |
Rambutan |
√ |
80 (11) |
√ |
20 (3) |
- |
Rp 5,000/kg |
84,000,000 |
|
5 |
Avocado |
√ |
80 (14)
|
√ |
20 (3) |
- |
Rp 10,000/kg |
68,000,000 |
|
6 |
Durian |
√ |
30 (3) |
√ |
70 (8) |
|
Rp 15,000/buah |
|
|
7 |
Cocoa |
- |
- |
|
100 (29) |
|
Rp 15,000/kg |
32,625,000 |
|
8 |
Tomato |
√ |
- |
- |
- |
- |
- |
420,000 |
|
Total |
Rp. 273,245,000 or the equivalent of 27,324.5 kg of rice/year |
|||||||
|
Tubers category |
||||||||
|
1 |
Gadung |
√ |
60 (23) |
√ |
40 (15) |
Rp 10,000/wrap/kg |
|
19,000,000 |
|
2 |
Cassava |
√ |
80 (9) |
√ |
20 (2) |
- |
Rp 5,000/kg |
4,400,000 |
|
Total |
Rp 23,400,000 or the equivalent of 2,340 kg of rice/year |
|||||||
|
Industrial plants category |
||||||||
|
1 |
Clove |
- |
- |
√ |
100 (36) |
- |
Rp 57,000/kg |
102,600,000 |
|
2 |
Betel nut |
- |
- |
√ |
100 (20) |
Rp 10,000 |
- |
8,000,000 |
|
3 |
Coconut |
√ |
20 (5) |
√ |
80 (20) |
Rp 300,000/quintal (16) |
Rp 200,000/quintal (4) |
26,400,000 |
|
Total |
Rp 137,000,000 or the equivalent of 13,700 kg of rice/year |
|||||||
|
Category of woody plants |
||||||||
|
1 |
Bayur |
√ |
50 (18) |
√ |
50 (17) |
Not Harvested yet |
Not Harvested yet |
- |
|
2 |
Waru Mountain |
√ |
50 (18) |
√ |
50 (18) |
Not Harvested yet |
Not Harvested yet |
- |
|
3 |
Sengon |
√ |
40 (10) |
√ |
60 (15) |
Not Harvested yet |
Not Harvested yet |
- |
|
Total |
Rp. 0 |
|||||||
|
Empon-empon category |
||||||||
|
1 |
Turmeric |
√ |
100 (21) |
- |
- |
- |
- |
2,520,000 |
|
2 |
Laos |
√ |
100 (25) |
- |
- |
- |
- |
1,500,000 |
|
3 |
Ginger |
√ |
100 (29) |
- |
- |
- |
- |
10,440,000 |
|
Total |
Rp 14,460,000 or the equivalent of 1,446 kg of rice/year |
|||||||
Table 5. The survival ability of the Pahawang Island Community based on each agroforestry category
|
No. |
Category Agroforestry |
Production revenue/year (Rp) |
Fulfillment of rice needs (kg/year) |
Percentage (%) |
Survivability (days) |
|
1 |
Vegetables |
192.980.000 |
19,298 |
30 |
4 |
|
2 |
Fruits |
273.245.000 |
27,324.5 |
43 |
6 |
|
3 |
Tubers |
23.400.000 |
2,340 |
3,6 |
0,5 |
|
4 |
Industrial plant |
137.000.000 |
13,700 |
21 |
3 |
|
5 |
Woody plant |
0 |
0 |
0 |
0 |
|
6 |
Spices |
14.460.000 |
1,446 |
2,4 |
0,5 |
|
|
Total |
641.085.000 |
64,108.5 |
100 |
14 |
3.4 Household food security
The condition of household food security in Pulau Pahawang Hamlet is described by the indicators determined in the HFSAS (Household food security access scale), which are presented in Table 6. Based on the calculation results of the average food security score, Pahawang Island is included in the category of moderately food security with a score of 15.6. This result shows that agroforestry can meet household food needs even though the type of food provided in farmer households is limited.
Based on Table 6, the people of Pahawang Island are worried that their family does not have enough food. This study is indicated by the WMS score of 2.34, the highest score (Rank 1) of the nine parameter questions regarding food security. The characteristics of food security that are referred to in Measurement 1 (P-1) indicate that the household still has sufficient food both in terms of quantity and type. However, the condition of their resources makes the household feel worried that they will, at times in the future, not be able to meet the food they want to support an active and healthy life. Only 20% percent of households experience no anxiety at all.
In addition to worrying that the family does not have enough food, people also feel that they cannot eat the type of food they like at certain times. This result is indicated by a WMS score of 1.98, which is in second place (Rank 2). Then people think that their food variety is limited during certain months, and even they eat the type of food they do not like, which is indicated by a WMS value of 1 .95 and 1.63, which are in third and fifth place.
The situation in measurements 2 to 4 (P2-P4) shows that households still have resources but with certain limitations so that even though these households can eat, they have limited types of food and no longer vary. When households experience conditions related to limited amounts of food, they usually react physically. Some will reduce the number of servings of food. Some may choose to skip a meal or two.
The increasingly critical condition is reflected by the presence of household members who have to go to bed without having dinner, maybe even not eating from morning until sleeping at night. Of all the food security items, the experience rarely felt by the people in Pahawang Island is sleeping hungry when there is not enough food and not eating anything at certain times. This result is indicated by the lowest WMS value (Rank 7). Therefore, the level of food security with agroforestry land in Pahawang Island is moderately food security. This result shows that the existence of agroforestry is sufficient to meet the needs of family households, so that if at any time the community cannot afford to buy necessities outside the island due to problems such as natural disasters, then agroforestry is still able to meet the food needs of the people in Pahawang Island, then agroforestry is still able to meet the food needs of the people in Pulau Pahawang Village and become food reserve stocks both directly and through income generation. Through agroforestry efforts, the people of Pahawang Village are able to survive until aid arrived because the distance from Pahawang Village to the crossing port was only about 30 minutes.
Table 6. Distribution of respondents on access to household food security
|
No |
Measurement |
Very often (4) |
Often (3) |
Occasionally (2) |
Rarely (1) |
None of Them (0) |
WMS |
Rank |
|
1 |
Worried that the family is not eating enough |
10 (24%) |
14 (34%) |
5 (12%) |
4 (10%) |
8 (20%) |
2.34 |
1 |
|
2 |
Unable to eat the type of food you like at certain times |
5 (12%) |
10 (24%) |
11 (27%) |
9 (22%) |
6 (15%) |
1.98 |
2 |
|
3 |
Food variety is limited during certain months |
5 (12%) |
11 (27%) |
10 (24%) |
7 (17%) |
8 (20%) |
1.95 |
3 |
|
4 |
Eating foods, you don't like at certain times |
5 (12%) |
7 (17%) |
8 (20%) |
10 (24%) |
11 (27%) |
1.63 |
5 |
|
5 |
Eat smaller portions of food than usual due to lack of resources |
4 (10%) |
8 (20%) |
8 (20%) |
10 (24%) |
11 (27%) |
1.61 |
6 |
|
6 |
Eat less food in a day because there is not enough food |
3 (7%) |
10 (24%) |
9 (22%) |
9 (22%) |
10 (24%) |
1.68 |
4 |
|
7 |
Not eating anything at certain times |
3 (7%) |
6 (15%) |
8 (20%) |
12 (29%) |
12 (29%) |
1.41 |
7 |
|
8 |
Family members sleep hungry when there's not enough food |
4 (10%) |
6 (15%) |
8 (20%) |
8 (20%) |
15 (35%) |
1.41 |
7 |
|
9 |
Go all day without food as long as there is not enough food |
4 (10%) |
6 (15%) |
11 (27%) |
10 (24%) |
10 (24%) |
1.61 |
6 |
|
|
Total |
|
|
|
|
|
15.6 |
|
The availability of food from agroforestry land in Pahawang Island is quite varied consisting of vegetables, fruits, tubers and empon-empon while food that is not available in agroforestry land is met from the sale of agroforestry products. Revenues from agroforestry products, if equated with rice as the minimum food requirement, are 64,108.5 kilograms of rice per year. This means that there are 14 days for the people of Pahawang Island to be able to survive and save themselves in the event of a natural disaster. Food security on Pahawang Island is categorized as moderately food insecure with a score of 15.6. The agroforestry pattern applied in Pahawang Island needs to be maintained because it can improve community food security. In addition, the addition of variety of species also needs to be done, especially the types of fruit trees and commercial timber whose maintenance is not carried out intensively.
[1] Mbow, C., Smith, P., Skole, D., Duguma, L., Bustamante, M. (2014). Achieving mitigation and adaptation to climate change through sustainable agroforestry practices in Africa. Current Opinion in Environmental Sustainability, 6: 8-14. https://doi.org/10.1016/j.cosust.2013.09.002
[2] De Souza, H.N., Degoede, R.G.M, Brussaard, L., dan Cardoso, I.M., Duarte, E.M.G., Fernandes, R.B.A., Gomes, L.C., Pulleman, M.M. (2012). Protective shade, tree diversity and soil properties in coffee agroforestry systems in the Atlantic Rainforest Biome. Agriculture, Ecosystems & Environment, 146(1): 179-196. https://doi.org/10.1016/j.agee.2011.11.007
[3] Qurniati, R., Febryano, I.G., Zulfiani, D. (2017). How trust influence social capital to support collective action in agroforestry development? Biodiversitas, 18(3): 1201-1206. https://doi.org/10.13057/biodiv/d1844
[4] Bucagu, C., Vanlauwe, B., Van Wijk, M.T., Giller, K.E. (2013). Assessing farmers’ interest in agroforestry in two contrasting agro-ecological zones of Rwanda. Journal Agroforestry Systems, 87: 141-158. https://doi.org/10.1007/s10457-012-9531-7
[5] Luedeling, E., Kindt, R., Huth N.I., Koenig, K. (2014). Agroforestry systems in a changing climate-challenge in projecting future performance. Journal Current Opinion Environmental Sustainability, 6(1): 1-7. https://doi.org/10.1016/j.cosust.2013.07.013
[6] Ilaboya, I.R., Atikpo, E., Omofuma, F.E., Asekhame, F.F., Umukoro, L. (2012). Causes, effects and way forward to food insecurity. Iranica Journal of Energy & Environment, 3(2): 180-188. https://doi.org/10.5829/idosi.ijee.2012.03.02.1673
[7] FAO. (2008). An Introduction to the basic concepts of food security. EC-FAO Food Security Programm. https://www.fao.org/3/al936e/al936e00.pdf
[8] Mayrowani, H., Ashari. (2011). Pengembangan agroforestri untuk mendukung ketahanan pangan dan pemberdayaan petani sekitar hutan. Forum Penelitian Agro Ekonomi, 29(2): 83-98.
[9] BPS. (2021). Luas daerah dan jumlah pulau menurut provinsi, 2021. https://www.bps.go.id/indikator/indikator/view_data_pub/0000/api_pub/UFpWMmJZOVZlZTJnc1pXaHhDV1hPQT09/da_01/1
[10] Ruswandi, R., Saefuddin, A., Mangkuprawira, S., Riani, E., Kardono, P. (2008). Identifikasi potensi bencana alam dan upaya mitigasi yang paling sesuai diterapkan di pesisir Indramayu dan Ciamis. Jurnal Riset Geologi dan Pertambangan, 18(2): 1-19. http://dx.doi.org/10.14203/risetgeotam2008.v18.12
[11] Jokowinarno, D. (2011). Mitigasi bencana tsunami di wilayah pesisir Lampung. Jurnal Rekayasa, 15(1): 13-20.
[12] Lasabuda, R. (2013). Pembangunan wilayah pesisir dan lautan dalam perspektif negara kepulauan Republik Indonesia. Jurnal Ilmiah Platax, 1(2): 92-101. https://doi.org/10.35800/jip.1.2.2013.1251
[13] Febryano, I.G., Suharjito, D., Darusman, D., Kusmana, C., Hidayat. (2014). The roles and sustainability of local institutions of mangrove management in Pahawang Island. Jurnal Manajemen Hutan Tropika, 20(2): 69-76. https://doi.org/10.7226/jtfm.20.2.69
[14] Coates, J., Swindale, A., Bilinsky, P. (2007). Household food insecurity access scale (HFIAS) for measurement of household food access: Indicator guide (v. 3). Food and Nutrition Technical Assistance Project, Academy for Educational Development, Washington, D.C., US.
[15] Olaniyi, O.A., Akintonde, J.O., Adetumbi, S.I. (2013). Contribution on non-timber forest products to household food security among rural women in Iseyin local government area of Oyo State, Nigeria. Research on Humanities and Social Sciences, 3(7): 41-49.
[16] Sugiyono. (2019). Metode Penelitian Kuantitatif, Kualitatif, dan R&D. Alfabeta, Bandung, Indonesia.
[17] Davinsy, R., Kustanti, A., Hilmanto, R. (2015). Kajian pengelolaan hutan mangrove di Desa Pulau Pahawang Kecamatan Marga Punduh Kabupaten Pesawaran. Jurnal Sylva Lestari, 3(3): 95-106. http://dx.doi.org/10.23960/jsl3395-106
[18] Alfatikha, M., Febryano, I.G., Herwanti, S., Yuwono, S.B. (2020). Identifikasi jenis tanaman agroforestri untuk mendukung ketahanan pangan rumah tangga di Desa Pulau Pahawang. Journal of Forestry Research, 3(2): 55-63. https://doi.org/10.32662/gjfr.v3i2
[19] Sukardi, L., Ichsan, A.C., Febryano, I.G., Idris, M.H., Dipokusumo, B. (2021). Analysis of community self-assistance level in water resources conservation in the upper areas of renggung watershed Lombok Island. International Journal of Design and Nature and Ecodynamics, 16(4): 387–392. https://doi.org/10.18280/ijdne.160405
[20] Sukardi, L., Ichsan, A.C., Febryano, I.G., Idris, M.H., Dipokusumo, B. (2022). Determination of the type of multy purpose tree species (MPTS) plant featured in the area of community forest (HKm) central lombok. International Journal of Design and Nature and Ecodynamics, 17(4): 579–584. https://doi.org/10.18280/ijdne.170412
[21] Yulida, R., Cepriadi, C., Minarsih, M. (2012). Persepsi anggota terhadap pelayanan pengelola dalam penyaluran dana usaha ekonomi kelurahan simpan pinjam di Kelurahan Muara Fajar Kecamatan Rumbai Kota Pekanbaru. Jurnal Ilmiah Pertanian, 9(1): 17-27. https://doi.org/10.31849/jip.v9i1.1282
[22] Desmiwati, D., Veriasa, T.O., Aminah, A., Safitri, A.D., Hendarto, K.A., Wisudayati, T.A., Royani, H., Dewi, K.H., Raharjo, S.N.I, Sari, D.R. (2021). Contribution of agroforestry systems to farmer income in state forest areas: A case study of Parungpanjang, Indonesia. Forest and Society, 5(1): 109-119. http://dx.doi.org/10.24259/fs.v5i1.11223
[23] Irianto, H., Mujiyo, M., Qonita, A., Riptanti, E.W. (2019). Socio-economic characteristics of farmers on the existence of floating-rice cultivation demonstration plots in flood prone area in Bojonegoro, East Java. IOP Conference Series: Earth and Environmental Science, 314: 012048. https://doi.org/10.1088/1755-1315/314/1/012048
[24] Andini, N.K., Nilakusmawati, D.P.E., Susilawati, M. (2013). Faktor-faktor yang memengaruhi penduduk lanjut usia masih bekerja. Piramida Jurnal Kependudukan dan Pengembangan Sumber Daya Manusia, 9(1): 44-49.
[25] Baliton, R.S., Wulandari, C., Landicho, L.D., Cabahug, R.E.D., Paelmo, R.F., Comia, R.A., Visco, R.G., Budiono, P., Herwanti, S., Rusita, R., Castillo, A.K.S. (2017). Ecological services of agroforestry landscapes in selected watershed areas in the Philippines and Indonesia. Biotropia - The Southeast Asian Journal of Tropical Biology, 24(1): 71–84. https://doi.org/10.11598/btb.2017.24.1.621
[26] Saliu, O., Oluwagbemi, T., Ifatimehin, O. (2018). Characteristics of agroforestry systems’ adoption by farmers in the North Central Zone of Nigeria. Journal of Environmental Research and Development, 13(1): 7-19.
[27] Moronge, J., Nyamweya, J.M. (2019). Some socio-economic drivers of agroforestry adoption in Temiyotta Location, Nakuru County, Kenya. Journal of Sustainability, Environment and Peace, 2(1): 9-14.
[28] Sanou, J., Bayala, J., Teklehaimanot, Bazie, P. (2012). Effect of shading baobab (Adansonia digitata) and nere (Parkia biglobosa) on yields of millet (Pennisetum glaucum) and taro (Colocasia esculenta) in parkland systems in Burkina Faso, West Africa. Agroforestry Systems, 85: 431-441. https://doi.org/10.1007/s10457-011-9405-4
[29] Budiartiningsih, R., Maulida, Y. (2010). Faktor-faktor yang mempengaruhi peningkatan pendapatan keluarga petani melalui sektor informal di Desa Kedaburapat, Kecamatan Rangsang Barat, Kabupaten Bengkalis. Jurnal Ekonomi, 18(1): 79-93.
[30] Obeng, E.A., Weber, M. (2014). Socio-economic factors affecting agroforestry adoption by smallholder farmers in Ghana. Ghana Journal Forest, 30(1): 43-60.
[31] Manyamsari, I., Mujiburrahmad. (2014). Karakteristik petani dan hubungannya dengan kompetensi petani lahan sempit. Agrisep, 15(2): 58-74.
[32] Hernanto, F. (2009). Ilmu Usahatani. Penebar Swadaya, Jakarta, Indonesia.
[33] Achmad, B., Sanudin, S., Siarudin, M., Widiyanto, A., Diniyati, D., Sudomo, A., Hani, A., Fauziyah, E., Endah Suhaendah, E., Widyaningsih, T.S., Handayani, W., Maharani, D, Suhartono, S., Palmolina, M., Swestiani, D., Sulistiadi, H.B.S., Winara, A., Nur, H.Y., Diana, M., Gartika, D., Ruswandi, A. (2022). Traditional subsistence farming of smallholder agroforestry systems in Indonesia: A review. Sustainability, 14: 1-33. https://doi.org/10.3390/su14148631
[34] Adriani, M., Wirjatmadi, B. (2012). Pengantar Gizi Masyarakat. Kencana, Jakarta, Indonesia.
[35] Sibuea, S.M., Kardhinata E.H., Ilyas, S. (2014). Identifikasi dan inventarisasi jenis tanaman umbi-umbian yang berpotensi sebagai sumber karbohidrat alternatif di Kabupaten Serdang Bedagai. Jurnal Online Agroekoteknologi, 2(4): 1408-1418.
[36] Muliawati, E.S., Budiastuti, M.T.S., Suprayogo, D., Sutrisno, J. (2018). Agrobiodiversity in the rural home gardens as the food reserve for climate change adaptation (Case study: Samin sub-watershed, Central Java, Indonesia). Bulg J Agric Sci, 24: 759-767.
[37] Herwanti, S., Febryano, I.G., Zulfiani, D. (2019). Economic value analysis of community forest food products in Ngarip Village, Ulu Belu Subdistrict, Tanggamus Regency (a case from Indonesia). Forestry Ideas, 25(2): 314-328.
[38] Duffy, C., Toth, G., Hagan, R.P.O., McKeown, P.C., Rahman, S.A., Widyaningsih, W., Sunderland, T.C.H., Spillane, C. (2021). Agroforestry contributions to smallholder farmer food security in Indonesia. Agroforestry System, 95: 1109-1124. https://doi.org/10.1007/s10457-021-00632-8
[39] Duffy, C., Pedeb, V., Toth, G., Kilclinea, K., O’Donoghuea, C., Ryand, M., Spillane, C. (2020). Drivers of household and agricultural adaptation to climate change in Vietnam. Climate and Development, 13(3): 1-14. https://doi.org/10.1080/17565529.2020.1757397
[40] Darwanto. (2005). Ketahanan pangan berbasis produksi dan kesejahteraan petani. Ilmu Pertanian, 12(2): 152-164.
[41] Santosa, S.P., Sudrajat, S. (2010). Kajian ketersediaan dan kebutuhan konsumsi beras di Kabupaten Karanganyar, Jawa Tengah. 1-11
[42] BPS. (2021). Konsumsi Bahan Pokok 2019. https://www.bps.go.id/publication/2021/11/25/68b1b04ce68c7d6a1c564165/konsumsi-bahan-pokok-2019.html
[43] Sajogyo. (1996). Garis Kemiskinan dan Kebutuhan Minimum Pangan. Aditya Media, Yogyakarta, Indonesia.
[44] Rozaki, Z., Rahmawati, N., Wijaya, O., Khoir, I.A., Senge, M., Kamarudin, M.F. (2021). Perception of agroforestry adopter and non-adopter on volcano risk and hazard: a case in Mt. Merapi, Java, Indonesia. Biodiversitas 22(9): 3829-3837. https://doi.org/10.13057/biodiv/d220928
[45] Lasco, R.D., Delfino, R.J.P., Espaldon, M.L.O. (2014). Agroforestry systems: helping smallholders adapt to climate risks while mitigating climate change. WIREs Climate Change, 5(6): 825-833. https://doi.org/10.1002/wcc.301