Imtiyaz Akbar Najar | Raudhah Ahmadi* | Yunika Kirana Abdul Khalik | Nurul Zawiyah Mohamad | Mohd Azizul Hafiz Jamian | Nadeem Akbar Najar
© 2022 IIETA. This article is published by IIETA and is licensed under the CC BY 4.0 license (http://creativecommons.org/licenses/by/4.0/).
OPEN ACCESS
The objective of this research is to develop the framework for sustainable land-use planning on the basis of seismic microzonation to reduce the devastating effects of future earthquakes by utilizing the software geographical information system (ArcGIS). Miri district of Sarawak in Malaysia has been chosen as the study area because of having the highest peak ground acceleration which is 0.09g in terms of the 10% probability of exceedance in 50 years. In addition, the frequency of an earthquake with a magnitude up to 5.3 is approximately every 5-7 years. Therefore, it is vital to introduce land use planning in order to diminish the adverse effects of earthquakes in the future. For this purpose, Google Earth Pro was used for the collection of satellite image data for land use planning purposes. From the results, it was found that the seismic hazard in the Miri district varies from low to high corresponding to 2475 years of return period with low to moderate as predominant over the Miri district. Only a few areas are under high hazard. Also, the land use planning map was compared with the current land use map acquired from satellite imagery and it was found that all built-up is in the low hazard area. It is envisaged that the findings from this research will contribute immensely to the literature that will serve as background information and a guide for analysts, disaster management, engineering designers and seismologists in Malaysia and the world as a whole.
earthquake, geographical information system, land use, peak ground acceleration, seismic microzonation
An earthquake is a natural calamity that is unforeseen and inescapable, causing massive damage to humans, livestock and their surroundings [1-8]. Therefore, nothing big can be done to stop a disaster but a careful, timely and well-informed decision of land administration can mitigate the effects of the disaster effectively. Seismic risk zonation for urban areas, also known as seismic microzonation, is indeed the most important advanced technique for seismic risk research and mitigation approach in heavily populated regions which in addition to the advancement of various areas according to their seismic susceptibilities, also earmarks the location of various active and inactive fault lines in a region [1, 6].
Land-use control and administration are one of the huge countermeasures started and realized by local governments (Australia, New Zealand and the United States) to reduce the effects of earthquakes [9]. However, according to Saunders and Kilvington [10] to reduce the effects of earthquakes, land-use planning is a robust and essential instrument for mitigating the adverse effects of natural disasters like earthquakes on the basis of seismic microzonation as seismic microzonation is the worldwide essential tool to mitigate the risks of earthquakes [6, 11, 12]. The management of seismic risk is currently seen as a segment of urban planning to possibly diminish seismic harms [13-15]. Specifically, it is perceived that land-use planning can decrease the loss of lives and property during seismic tremors [16]. In this way, a method dealing with seismic risk reduction on the basis of land use planning could prompt the local adoption of guidelines, policies and different approaches for assigning urban improvement to less susceptible regions [17]. A lot of open literature is available that corroborates the fact that effective land use planning is key to the enhancement of resilience and disaster mitigation. Therefore, the main aim of this paper is to highlight the significance of incorporating seismic microzonation in land use planning so as to make the cities resilient to seismic disasters.
The concept of a “resilient city” indicates the ability of a city to restore its basic functions and structures after experiencing natural disasters like earthquakes. The type of city that can handle climatic, financial, tectonic, socio-political challenges and thrive in the future is a resilient city [18].
In addition to seismic risk reduction, land use administration has been used by various countries across the globe for achieving different purposes; Edwards et al. [19] evaluated the effectiveness of land use zoning in the protection of built heritage in the Bagan Archeological Zone using satellite based remote sensing technique and have reported in their study that restrictive zoning regime in Bagan between 1987 and 2018 has prevented the urban sprawl and thus endorse the fact that restrictive zoning helped in conserving a monumental site.
With respect to the staggering 2011 seismic tremor in Japan, Kaidzu [20] demands that cadaster assumed a significant job in remaking Sekine and Nanjo [21] and furthermore call attention to the necessities of cadastral estimation due to absent or distorted land borders. Murai [22] suggests to remote sensing (RS) and geographical information system (GIS) for harm evaluation in New Zealand, seismic tremors happened in Darfield (2010) and Canterbury (2011). The role of land use planning was highlighted by Grant et al. [23] in the phases of reconstruction and recovery. Concerning the 2010 tremor in Haiti, Khouri [24] contends that the absence of a cadaster and land use guideline exacerbated things during the reconstruction process.
Aside from the above, Mitchell et al. [25] explored the role of land use planning after earthquakes based on cases in Haiti, New Zealand and Nepal. From the view of Jha et al. [26] land use played an important role in the study of reconstruction after natural disasters. On the other hand, land use planning is referred by Poser and Dransh [27] in order to mitigate the flood damage in their study area, this examination contends that land use planning is interrelated with disaster management, particularly in connection to earthquakes. Although they cannot be prevented or predicted, but their effects can be mitigated to a large extent by careful designing of buildings and demarcating the earthquake-prone areas using various techniques [28, 29]. Seismological risk reduction includes land-use planning regulations that allow earthquake-exposed areas to minimize the risk. Therefore, it is very important to evaluate land-use plans for urban growth in seismic prone areas [30]. Land use planning is an important instrument to diminish the risks from natural disasters like earthquakes and landslides, in turn helping sustainability and enhancing resilience [16].
Motamed et al. [31] proposed a land use allocation model in the district of Tehran, Iran on the basis of seismic hazard analysis and introduced a risk index to evaluate the performance of the model. In addition, Feng et al. [32] proposed the land use planning in China by using the spatial analysis within the GIS technique on the basis of historical seismicity, geology and geodynamics by considerable pertinent mathematical statistics. Also, Aghamohammadi and Ranjbar [33] proposed a land use allocation in Frahzad, Iran by using the GIS modeling tools on the basis of previous records of earthquakes, geological properties and active faults. Saunders and Kilvington [10] introduced the risk-based planning approach (RBPA) in New Zealand as an approach for land use planning for the natural hazard risk reduction. Also, Ohara and Meguro [34] studied the effect of land use control by active fault zoning in Japan by using the GIS approach. In addition, Banba et al. [9] analysed the land use planning in the Markina city of Philipine for the reduction of earthquake hazard on the basis of peak ground acceleration i.e. seismic hazard analysis, population density and building damage assessment. Tudes and Yigiter [35] prepared a model of land use planning using AHP-GIS approach in the Adana, Turkey on the basis of earthquake risk, slope and surface geology.
Satellite pictures from the LISS-3 sensor of Indian remote sensing satellite (IRS) having a spatial resolution of 23.5m were used to set up the land use map through supervised classification in Karnataka to study the urban spread [36]. While, images from different sensors like Landsat MSS (79m. goals), ETM+, TM, and IRS LISS 3 were used by Jat et al. [37] for the preparation of maps portraying land use across different years and utilized it to anticipate the urban development and spread of Ajmer city in Rajasthan. Moghadam and Helbich [38] considered the past urban land use changes in Mumbai city with the assistance of land use maps arranged to utilize the satellite information (Landsat MSS, TM, and ETM+) acquired from GLCF. On the other hand, images from Landsat MSS and TM were used for the land use maps by Feng and Li [39] to analyze urban spread in Nanjing, China. The occurrences of natural disaster earthquakes can neither be prevented nor be predicted but the effects of earthquakes can be alleviated with the proper planning of land-use and by following the suitable techniques of construction [40-42]. So, in order to develop adequate management strategies for the minimization of the earthquake disaster, city planners must have a clear idea of the degree of probable harm (like seismic hazard assessment, site response, and liquefaction susceptibility) to their territory in the event of a future earthquake. The seismic microzonation was carried out by Najar et el. [6] for the district of Miri in which seismic hazard analysis, site response analysis and liquefaction susceptibility were taken into account. In the event of a natural disaster earthquake, the first step in ensuring the region's safety is to understand the region's susceptibility to future earthquakes.
Therefore, in this paper, the framework of land use planning has been introduced by incorporating site-specific ground response analysis, soil liquefaction analysis, and seismic microzonation.
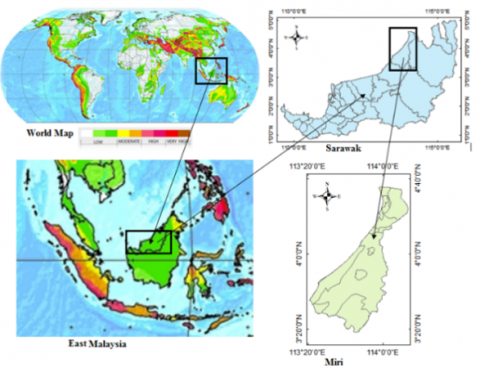
Miri is a seaside city in northeast Sarawak, Malaysia, on the island of Borneo, close to the Brunei border. The study region is defined by longitudes 113.979556 E to 113.816667 E and latitudes 4.35889 N to 4.116667 N. Figure 1 depicts the research area.
Figure 1. Miri city as the study area
Miri being a hub for an industrial estate like, the oil and gas industry, which contributes significantly to the Gross Domestic Product (GDP) of Sarawak, demands that there is a need to make the city safer from the hazard of earthquakes that could hit Sarawak, which is mentioned in the Malaysian National Annex to Eurocode 8 that highest PGA is in Miri Sarawak because of having the highest peak ground acceleration which is 0.09g in terms of the 10% probability of exceedance in 50 years. Therefore, the Miri district is chosen as a study area for this research.
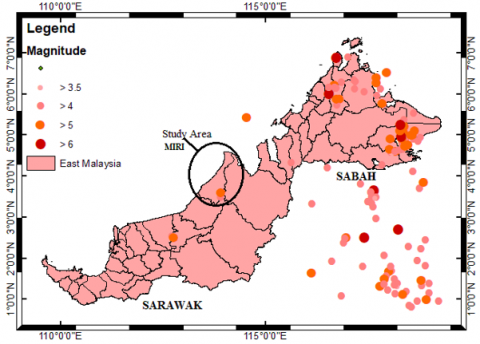
According to previous earthquake data in east Malaysia, it has met many seismic disturbances of local origin with magnitudes ranging from 3.6 to 6.2 from 1984 to 2019 [43]. This suggests a frequency of an earthquake with a magnitude up to 5.3 approximately every 5-7 years [44]. In addition, Sarawak is also affected by long distant earthquakes from the sources of the Straits of Makassar and Southern Philippines, the Celebes Sea and the Sulu Sea [45]. In comparison to other portions of east Malaysia, Sabah is vulnerable to earthquakes of modest magnitude. Seismic activity in east Malaysia has grown since 1900, but damaging earthquakes are thankfully uncommon (Sarawak and Sabah). The historical earthquakes of Sarawak, Malaysia are shown in Table 1 and Figure 2.
Aside from above, previously, on July 26, 1976, a severe earthquake centered in Lahad Datu, Sabah, with a moment magnitude of Mw 5.8 struck east Malaysia [46]. In addition, recently an earthquake that happened in Ranau, Sabah on 5th June 2015 with a moment magnitude of Mw 6.0 has shocked the Southeast Asian public because it was unexpected. A significant number of specialists were also taken aback by the damage it caused. This occurrence of earthquake is regarded as Malaysia's largest recorded earthquake, and 18 people were killed as a result of it [46, 47].
The seismic activity rate in east Malaysia is caused by isolated sources from Sulawesi, Kalimantan, and the southern Philippines, as well as local sources that appear to be related with some local fault lines and weak zones that produce earthquakes of low-to-moderate magnitude [48].
Figure 2. Historical earthquakes around east Malaysia
Table 1. Earthquakes in Sarawak Malaysia [40, 49-51]
|
Lat. (o) |
Long. (o) |
Mag |
Dep. (Km) |
Date |
Place |
|
3.32 |
114.4 |
3.9 |
10 |
27/05/2018 |
Niah near Miri, Sarawak, Malaysia |
|
3.65 |
113.82 |
3.2 |
10 |
25/01/2010 |
Niah near Miri, Sarawak, Malaysia |
|
3.8 |
113.6 |
3.3. |
10 |
23/12/2009 |
Niah near Miri, Sarawak, Malaysia |
|
4.32 |
115.62 |
4.5 |
24.7 |
30/06/2005 |
Sarawak-Sabah border region, Malaysia |
|
3.48 |
113.89 |
4.2 |
10 |
19/04/2005 |
Miri, Sarawak, Malaysia |
|
3.59 |
113.92 |
5.2 |
10 |
01/05/2004 |
Miri, Sarawak, Malaysia |
|
2.52 |
112.71 |
4.7 |
33 |
19/02/1994 |
Sarawak, Malaysia |
|
2.48 |
112.76 |
5.3 |
28.9 |
12/02/1994 |
Sarawak, Malaysia |
Figure 3. The systematic framework of land use planning
This section deals with the system of procedures adopted to arrive at results of the study. This framework is divided into five phases; phase I, phase II, phase III, phase IV and phase V. These phases depict the seismic hazard, site-specific ground response analysis, liquefaction analysis, seismic microzonation, and the land use planning respectively. The GIS-based framework of land use planning in the Miri district on the basis of seismic microzonation is shown in Figure 3.
In this study, the probabilistic seismic hazard assessment (phase I), site response analysis (phase II), and liquefaction analysis (phase III) carried out by [5, 7, 8, 52, 53] respectively for the entire Miri district has been used to develop the seismic microzonation map (phase IV) developed by the study [6].
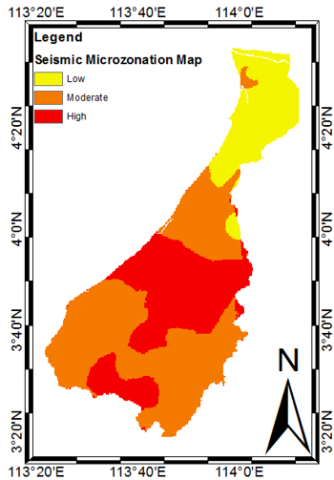
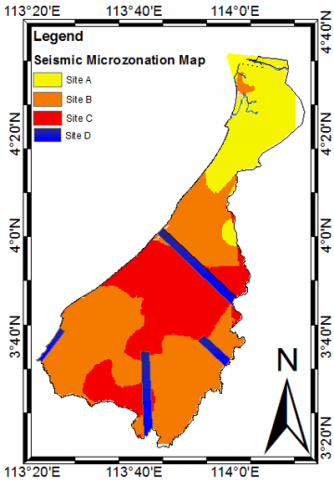
The purpose of this research is to build up the framework of land use planning map in terms of preparedness for the earthquake disaster on the basis of seismic microzonation. The seismic microzonation map used in this study is shown in Figure 4.
Figure 4. Seismic microzonation map of Miri district corresponding to 2475 years [6]
The good quality image of the Miri district was acquired from Google Earth Pro on 20th October 2019. This image was used for the classification of land use/land cover of the Miri district. Google earth pro is an open access data provider.
Table 2 gives the details of satellite data acquired from Google Earth with three spectral bands that correspond to Red (R), Green (G) and Blue (B). The advantage of using Google Earth is that it provides the most current satellite photos with spatial resolution less than 1m [54]. Most common image handling and GIS programming packages, such as ENVI, ArcGIS, ERDAS IMAGINE and others, now also provide facilities for visualising and importing Google Earth pictures. Another feature of Google Earth is that it provides photographs collected at various time intervals, which will be quite useful for urban planners performing land use planning. The main limitation of Google earth is that it may not be conceivable to get the first multispectral band information and subsequently picture classification utilizing unassisted or administered methods cannot be done. Although, if the spatial resolution is very high, which means a clear image, then it is possible to visually see the image, roads, buildings, water bodies, cropland etc.
Table 2. Characteristics of acquired satellite data
|
Sensor |
Provider |
Imagery |
Date of acquisition |
|
Landsat |
Copernicus |
Terramertics |
20th October 2019 |
The satellite image was then processed in the GIS environment. The steps of image processing are as follows:
Initially, the classification of land cover was identified in various classes namely, agricultural land, built up, oil mills, trees, water bodies and this classification was performed by utilizing maximum likelihood technique in ArcGIS, as this strategy is known to be one of the most generally utilized assessments for its effortlessness and suitability as recognized by much satellite-related research considers [55-57]. This digitization was done in GIS software to prepare the land use. Many errors may present in land cover classification due to atmospheric conditions. All buildings and roads are included in the built-up area; open space comprises barren, scrub land, residential layouts and rocky; and agricultural land encompasses of agricultural areas and vegetation. Lakes, tanks, ponds, and rivers are examples of water bodies. The developed area was further segmented into land use types such as recreational, residential, industrial, institutional, and commercial. Residential land use comprises all dwelling units such as detached, semi-detached, and apartment buildings. All shops, stores, markets, and shopping complexes are classified as commercial. All small and large-scale industries were classified as industrial land use. All educational institutions, including schools, colleges, and institutes of higher education and research, are included in the institutional land use. All these classes are described in groups which are shown in Table 3.
Table 3. Description of land use classes under study area
|
Land cover classes |
Description |
|
Agricultural land |
Lands covered with crops |
|
All Housing Zone |
Commercial, industrial, institutional, religious and residential buildings |
|
Water bodies |
Lakes, rivers and water collected due to rain |
|
Trees |
Palm oil trees |
|
Open space |
Non-agriculture, fallow lands and barren |
|
Oil mills |
Crude oil mills and palm oil mills |
|
Coastal area |
Dock yards and beaches |
|
Others |
Forests and national parks |
4.1 Image processing in GIS
As stated above, the satellite image of the quality of maximum resolution of 4800 × 3193 pixels was saved from Google Earth Pro having sensor Landsat 8 OLI/TIRS. The image was then georeferenced in GIS environment by using 4 ground control points (GCPs) of known latitude and longitude values and then image was registered in the ArcGIS. A shape file of Miri district was overlaid on the satellite image after image registration and coordinates were matched. The image was then registered in projected coordinate system using Universal Transverse Mercator (UTM). Digitization of various land use classes were performed to prepare the land use map by using the editing tool in ArcGIS. The image covering within the corporation boundary was clipped using the digitized corporation boundary map. Finally on-screen digitizing of various land use classes were performed to prepare the land use map.
Figure 5. Classification of land use in Miri according to acquired data
The current situation regarding the land use in Miri district is categorised on the basis of available data. The classification and the categories of land use in the study area is shown in Figure 5 and Table 3.
4.2 Overlay operation
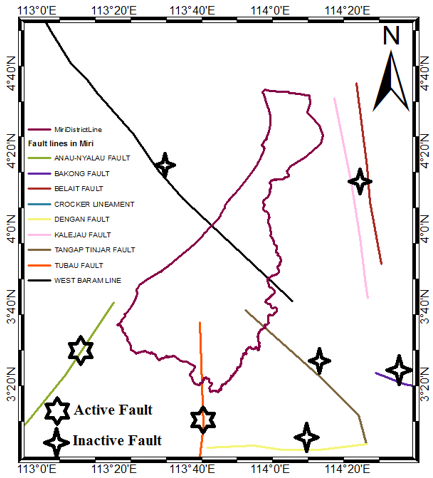
The classified land use map was overlaid in the GIS environment with fault line map in Figure 6 and seismic microzonation map with different site classes in Figure 7 by using the overlay operations to propose land use planning map for the Miri district on the basis of site classification of seismic microzonation map. The site classes are shown in Table 4.
Table 4. Site classification based on seismic microzonation
|
Site Code |
Characteristics |
|
Site A |
Low PGA Low Liquefaction Potential Low Amplification Factor |
|
Site B |
Moderate PGA Moderate Liquefaction Potential Moderate Amplification Factor |
|
Site C |
High PGA High Liquefaction Potential High Amplification Factor |
|
Site D |
Fault Line Area (active and inactive) |
Figure 6. Active and inactive fault lines in and around Miri district
Figure 7. Seismic microzonation map of Miri district with four classes
The land-use allocation model on the basis of seismic microzonation was proposed for Miri district of Sarawak, Malaysia. By using the GIS environment, we recognized which land is presented to hazard, and from that point forward, we choose for making a stable circumstance. The study region is classified into 4 sites; site A, site B, site C and site D on the basis of seismic microzonation and fault lines, which is shown in Table 4.
Spatial modelling and layer arrangement has been prepared in GIS environment [58, 59] by introducing the type of land use, its importance, the geological, geotechnical and earthquake properties of the study area. The objective of this model is to minimize the susceptibility to earthquake hazard in the Miri district for future earthquakes. For diminishing the susceptibility of urban occupants to seismic risk, the distribution of risk intensity ought to be considered in the improvement process. Consequently, the spatial distribution of land-uses could be resolved dependent on the seismic vulnerability of land-use. For instance, in land-uses like schools, as a result of the convergence of individuals, the high casualty rate is normal if there should be an occurrence of an earthquake. While in open space land use zone, the probability of human loss is ultimately low. So it might be normal for the more susceptible land-uses to be situated at places with a low likelihood of seismic activity. Nearby urban land-uses should be perfect so as to diminish the problematic impacts during both peacetime and calamity beginning. For example, human services like healthcare land-use ought not to be adjoining residential land use, for cleanliness contemplations. An open space can be a decent decision for filling the separation among medicinal services and residential land uses. Suitability of land use was checked on the basis of location by following the seismic microzonation map with site classes shown in Figure 7 and suitability matrix for land use as shown in Table 5.
Table 5. Suitability matrix
|
SITE |
||||
|
Land use |
A |
B |
C |
D |
|
Agricultural land |
Suitable |
Suitable |
Suitable |
Suitable |
|
Commercial |
Suitable |
Suitable |
Unsuitable |
Unsuitable |
|
Residential |
Suitable |
Suitable |
Unsuitable |
Unsuitable |
|
Religious |
Suitable |
Suitable |
Unsuitable |
Unsuitable |
|
Emergency |
Suitable |
Suitable |
Unsuitable |
Unsuitable |
|
Educational |
Suitable |
Suitable |
Unsuitable |
Unsuitable |
|
Industrial |
Suitable |
Suitable |
Unsuitable |
Unsuitable |
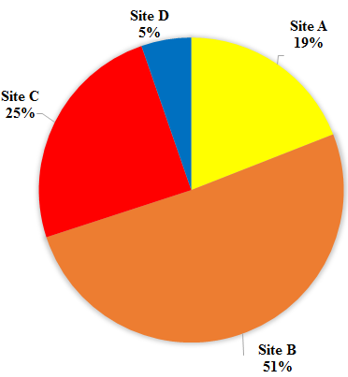
From the results the percentage of different site classes is shown in the pie chart in Figure 8 and Table 6, it indicates that 70% of Miri district is under low-to-moderate hazard which is not a major challenge and 24.68% lies in high hazard and 5.32% of the area is under fault lines which is a challenge for construction. Therefore, it is crucial not to construct on fault line area and leave that space undeveloped.
Figure 8. Pie chart for percentage of different site classes
Table 6. Percentage of different site classes
|
Site Code |
percentage |
|
Site A |
19.03% |
|
Site B |
50.91% |
|
Site C |
24.68% |
|
Site D |
5.3% |
The map of different sites decided on the basis of geological, geotechnical and seismic hazard is shown in Figure 7 depicting that the hazard is minimum in the northern region and gradually increases to its maximum in the central region and then also decreases in the south-eastern and south-western parts of the Miri region. A hazard index was utilized to assess the exhibition of the model for various significant variables and the index was on the basis of site classes as A, B, C and D. The proposed land use map is shown in Figure 9.
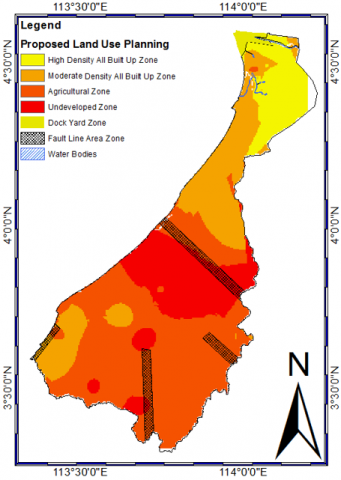
Figure 9. Proposed land use planning map of Miri district corresponding to 2475 years
The aim of this study is to develop the framework of land use planning model on the basis of seismic microzonation in terms of different site conditions containing a variety of geological, geotechnical, and geophysical data in order to determine the suitability of lands in the district of Miri. Land use planning is one non-structural measure used to eliminate hazard by directing future advancement away from a hazard zone and by implementing specific measures for the current built environment as per the risk of disaster. This study examined how land use planning can be implemented in the earthquake risk area. The results demonstrate that, the fault line area should be kept as undeveloped because of higher chances of hazard.
Arguments have arisen about applying land use planning to earthquake risk areas, as this serves as a type of disaster risk information disclosure that might impact the willingness to develop land or property value. However, the results indicate that in the Miri district the urban area including all types of buildings (residential, commercial, emergency, industrial, religious and educational) are located in low hazard zone area.
The land-use allocation model is proposed for Miri district of Sarawak Malaysia corresponding to 2475 years of return period. The land use allocation is based on the seismic microzonation map of Miri Sarawak corresponding to 2475 years of return period is shown in Figure 9. Based on the maximum likelihood technique, critical facilities like emergency zone, high density residential zone, high density commercial and industrial zone are piled in the site A region due to minimum seismic hazard. While on the other hand, where the seismic hazard is maximum, it is kept as undeveloped zone under site D which has fault line area zone. The classification of land use is given in Table 7. The outcome acquired from the estimated model were compared with a land-use obtained from the satellite data. All the built up zone is in site class A because of minimum seismic hazard.
Table 7. Classification of proposed land use
|
Land Use |
Classification |
|
Built Up |
Commercial Buildings Emergency Buildings Industrial Buildings Institutional Buildings Residential Buildings Religious Buildings |
|
Agricultural Zone |
Palm Oil Trees Cropland |
|
Emergency |
Hospitals Fire Services Police station |
|
Fault Line Area Zone |
Active and inactive fault line areas |
|
Undeveloped Zone |
High risk zone with faulty land |
|
Water Bodies |
Rivers, Lakes and Ponds |
|
Dock Yard Zone |
Coastal dock yard area |
The purpose of this study is to develop the framework of land use planning and the land use planning of Miri district of Sarawak Malaysia. By taking geology into the consideration, Miri is a coastal city in northeast Sarawak, Malaysia, situated on the island of Borneo, near the border of Brunei. Miri district has several fault lines in it. Borneo is an island and is viewed as tectonically dynamic and has experienced major tectonic occasions since Miocene till the current day from both onshore and offshore. Borneo is a fragment of the Sunda plate, and it is caged by the Indo-Australian and Philippine Sea plate. Borneo consists of these states; Kalimantan the state of Indonesia, East Malaysia (Sarawak and Sabah) and Brunei (a separate country between Sarawak and Sabah).
In order to achieve this study, the hazard themes like peak ground acceleration (PGA), shear wave velocity (Vs30), liquefaction potential index (LPI), amplification factor (AF) lithology conditions and predominant frequency (PF) have been introduced in the seismic microzonation by following the method of analytical hierarchy process (AHP) [6].
It is important to enter seismic tremor zoning rules in land use planning to make resilient city against earthquakes, so this study enlightened building up a model to distinguish which lands are unprotected against seismic hazard by utilizing GIS environment. GIS have proven to be excellent tools for studying natural risks such as earthquakes, which entail complex relationships between the natural and man-made ecosystems. The use of geographic information systems (GIS) and geospatial modelling in natural hazard risk management is a new study area, and the capacity to offer a geographical and physical context for risk is vital for risk reduction.
Therefore, the results of this model provided the proficiency to urban planners to decide stable locations or change the land-uses. The disaster management could reduce the effects of earthquakes by adopting the tools for land use planning. These accomplishments can reduce future earthquake damage in the city.
This study is supported by the Cross-Disciplinary Research Grant, Universiti Malaysia Sarawak (UniMas), grant no. F02/CDRG/1817/2019 and Centre of Research and Innovative Management (RIEC, UniMas) and both financial supports are really appreciated.
|
AF |
Amplification Factor |
|
AHP |
Analytical Hierarchy Process |
|
GCP |
Ground Control Points |
|
GIS |
Geographical Information System |
|
LPI |
Liquefaction Potential Index |
|
PF |
Predominant Frequency Hz |
|
PGA |
Peak ground acceleration m.s-2 |
|
UTM |
Universal Transverse Mercator |
|
Vs |
Shear Wave Velocity m.s-1 |
[1] Marto, A.M., Adnan, A.A., Hendriyawan, H., Irsyam, M.I. (2011). Microzonation maps for Kuala Lumpur and Putrajaya. Malaysian Journal of Civil Engineering, 23(1): 63-85. https://doi.org/10.11113/mjce.v23.15811
[2] Ahmad, B., Najar, I.A. (2016). Comparative seismic analysis of EL Centro and Japan earthquakes using response spectra method. International Journal of Current Engineering and Technology, 6(5): 1859-1864.
[3] Shah, A.J. (2012). Earthquake disaster management: Indian perspective. 2nd International Confrence on Management, Economics and Social Sciences, Bali, Indonesia, pp. 96-98.
[4] Kahandawa, K.A.R.V.D., Domingo, N.D., Park, K.S., Uma, S.R. (2018). Earthquake damage estimation systems: Literature review. Procedia Engineering, 212: 622-628. http://dx.doi.org/10.1016/j.proeng.2018.01.08
[5] Ahmadi, R.B., Najar, I.A., Sa’don, N.M., Hamza, H., Najar, N.A. (2020). Computational investigation of soil liquefaction susceptibility based on standard penetration test value of miri district of Sarawak Malaysia. International Journal of Advanced Science and Technology, 29(7): 2735-2748.
[6] Najar, I.A., Ahmadi, R.B., Hamza, H., Sa’don, N.M., Ahmad, A. (2020). First order seismic microzonation of miri district using AHP-GIS platform. Test Engineering and Management, 83(2): 13891-13899.
[7] Najar, I.A., Ahmadi, R.B., Jamian, M.A.H., Hamza, H, Ahmad, A., Sin, C.H. (2022). Site-specific ground response analysis using the geotechnical dataset in moderate seismicity region. International Journal of Mechanics, 16(1): 37-45. http://dx.doi.org/10.46300/9104.2022.16.5
[8] Ahmadi, R., Najar, I.A., Abdullahi, A.F., Galin, T. (2021). Response spectra for moderate seismic area - application to Miri district of Sarawak, Malaysia. In IOP Conference Series: Materials Science and Engineering, p. 012020.
[9] Banba, M., Maki, N., Topping, K., Hayashi, H., Kondo, T., Tamura, K., Karatani, Y. (2004). Analysis of land use management for earthquake disaster reduction in the Asia pacific. In Proceedings of the 13th World Conference on Earthquake Engineering, Vancouver, British Columbia, Canada, pp. 1-6.
[10] Saunders, W.S.A., Kilvington, M. (2016). Innovative land use planning for natural hazard risk reduction: a consequence-driven approach from New Zealand. International Journal of Disaster Risk Reduction, 18: 244-255. https://doi.org/10.1016/j.ijdrr.2016.07.002
[11] Pagliaroli, A. (2018). Key issues in seismic microzonation studies: lessons from recent experiences in Italy. Rivista Italiana di Geotecnica, 1(1): 5-48. https://doi.org/10.19199/2018.1.0557-1405.05
[12] Sana, H. (2018). Seismic microzonation of Srinagar City, Jammu and Kashmir. Soil Dynamics and Earthquake Engineering, 115: 578-588. https://doi.org/10.1016/j.soildyn.2018.09.028
[13] Deyle, R.E., Smith, R.A. (1998). Local government compliance with state planning mandates - The effects of state implementation in Florida. Journal of the American Planning Association, 64(4): 457-469. http://dx.doi.org/10.1080/01944369808976004
[14] Burby, R.J., Beatley, T., Berke, P.R., et al. (1999). Unleashing the power of planning to create disaster-resistant communities. Journal of the American Planning Association, 65(3): 247-258. http://dx.doi.org/10.1080/01944369908976055
[15] Olshansky, R.B. (2001). Land use planning for seismic safety: The Los Angeles County experience 1971-1994. Journal of the American Planning Association, 67(2): 173-185.
[16] Burby, R.J., Deyle, R.E., Godschalk, D.R., Olshansky, R.B. (2000). Creating hazard resilient communities through land-use planning. Natural Hazards Review, 1(2): 99-106. http://dx.doi.org/10.1061/(ASCE)1527-6988(2000)1:2(99)
[17] Burby, R.J., Dalton, L.C. (1994). Plans can matter! The role of land use plans and state planning mandates in limiting the development in hazardous areas. Public Administration Review, 54(3): 229-238. http://dx.doi.org/10.2307/976725
[18] Newton, P.W., Doherty, P. (2014). The Challenges to Urban Sustainability and Resilience. In: Pearson, L., Newton, P., Roberts, P. (eds) Resilient Sustainable Cities: A Future. Routledge, New York.
[19] Edwards, B., Frasch, T., Jeyacheya, J. (2019). Evaluating the effectiveness of land-use zoning for the protection of built heritage in the Bagan Archaeological Zone, Myanmar—A satellite remote-sensing approach. Land Use Policy, 88: 104174. https://doi.org/10.1016/j.landusepol.2019.104174
[20] Kaidzu, M. (2014). Land management issue related to recovery from east Japan great earthquake. In Proceedings of XXV FIG International Congress: Engaging the Challenges, Enhancing the Relevance, Kuala Lumpur, Malaysia, 16-21 June 2014.
[21] Sekine, I., Nanjo, M. (2012). Readjustment of cadastral map in the east Japan earthquake disaster area. In Proceedings of the FIG Working Week, Rome, Italy, 6-10 May 2012.
[22] Murai, S. (2012). Lessons from east Japan earthquake and tsunami. In Proceedings of the FIG Working Week, Rome, Italy, 6-10 May 2012.
[23] Grant, D., Mitchell, D., Dyer, M. (2016). Canterbury earthquake response: Lessons for land administration policy. In Proceedings of the FIG Working Week, Christchurch, New Zealand, 30 April–01 May 2016.
[24] Khouri, R. (2011). Spatial data for Haiti reconstruction. In Proceedings of the FIG Working Week, Marrakech, Morocco, 18–22. May 2011.
[25] Mitchell, D., Grant, D., Roberge, D., Bhatta, G.P., Caceres, C. (2017). An evaluation framework for earthquake-Responsive land administration. Land Use Policy, 67: 239-252. http://dx.doi.org/10.1016/j.landuse pol.2017.05.020
[26] Jha, A.K., Barenstein, J.D., Phelps, P.M., Pittet, D., Sena, S. (2010). Safer homes, stronger communities. A Handbook for Reconstruction after Natural Disasters. Washington, DC: The World Bank.
[27] Poser, K., Dransch, D. (2010). Volunteered geographic information for disaster management with application to rapid flood damage estimation. Geomatica, 64(1): 89-98.
[28] Johar, F., Majid, M.R., Jaffar, A.R., Yahya, A.S. (2013). Seismic microzonation for Banda Aceh city planning. Planning Malaysia Journal, 11(2): 137-162. http://dx.doi.org/10.21837/pmjournal.v11.i2.120
[29] Unger, E.M., Zevenbergen, J., Bennett, R., Lemmen, C. (2019). Application of LADM for disaster prone areas and communities. Land Use Policy, 80(1): 118-126. http://dx.doi.org/10.1016/j.landusepol.2018.10.012
[30] Martins, V.N., Cabral, P., Sousa E Silva, D. (2012). Urban modelling for seismic prone areas: The case study of vila franca do campo (Azores archipelago, Portugal). Natural Hazards and Earth System Science, 12(9): 2731-2741. http://dx.doi.org/10.5194/nhess-12-2731-2012
[31] Motamed, H., Ghafory-Ashtiany, M., Amini-Hosseini, K. (2012). An earthquake risk–Sensitive model for spatial land-Use allocation. In Proceedings of the 15th World Conference on Earthquake Engineering, Lisbon, Portugal, 24–28 September 2012.
[32] Feng, M., Feng, M.J., Sheng, Z.W. (2006). Earthquake disaster GIS and spatial-Temporal pattern of earthquake disasters in China. In Proceedings of the 14th World Conference on Earthquake Engineering, Beijing, China. 12–17 October 2008.
[33] Aghamohammadi, H., Ranjbar, A. (2008). Spatial modeling for reducing earthquake disaster damages in Iran. World Applied Sciences Journal, 3(1): 78-81.
[34] Ohara, M.Y., Meguro, K. (2008). A study on the effect of land use control by active fault zoning in Japan, In 13th World Conference on Earthquake Engineering, China, pp. 1-5.
[35] Tudes, S., Yigiter, N.D. (2010). Preparation of land use planning model using GIS based on AHP: Case study Adana-Turkey. Bulletin of Engineering Geology and the Environment, 69(2): 235-245. http://dx.doi.org/10.1007/s10064-009-0247-5
[36] Sudhira, H.S., Ramachandra, T.V., Jagadish, K.S. (2004). Urban sprawl: Metrics, dynamics and modelling using GIS. International Journal of Applied Earth Observation and Geoinformation, 5(1): 29-39. http://dx.doi.org/10.1016/j.jag.2003.08.002
[37] Jat, M.K., Garg, P.K., Khare, D. (2008). Monitoring and modelling of urban sprawl using remote sensing and GIS techniques. International Journal of Applied Earth Observation and Geoinformation, 10(1): 26-43.
[38] Moghadam, H.S., Helbich, M., (2013). Spatiotemporal urbanization processes in the megacity of Mumbai, India: A Markov chains-cellular automata urban growth model. Applied Geography, 40: 140-149.
[39] Feng, L., Li, H. (2012). Spatial pattern analysis of urban sprawl: case study of Jiangling, Nanjing, China. Journal of Urban Planning and Development, 138(3): 263-269. http://dx.doi.org/10.1061/(ASCE)UP.1943-5444.0000119
[40] Hendriyawan. (2007). Seismic macrozonation of peninsular malaysia and microzonation of kuala lumpur city center and putrajaya. Ph.D. dissertation. Department of Civil Engineering, Universiti Teknologi Malaysia, Johor, Malaysia.
[41] Ganapathy, G.P. (2011). First level seismic microzonation map of Chennai City–A GIS approach. Natural Hazards and Earth System Sciences, 11: 549-559. http://dx.doi.org/10.5194/nhess-11-549-2011
[42] Najar, I.A., Ahmadi, R.B., Najar, N.A., Akbar, S., Binti, N.S. (2004). Review of impact of 2004 great Sumatra-Andaman mega thrust earthquake and tsunami on affected countries using ECLAC DaLA framework. Journal of Environmental Engineering and Studies, 5(1): 35-47.
[43] Sooria, S.Z., Sawada, S., Goto, H. (2012). Proposal for seismic resistant design in Malaysia: Assessment of Possible Ground Motions in Peninsular Malaysia. Kyoto University Research Information Repository, 55(B): 81-94. http://hdl.handle.net/2433/161867.
[44] Adnan, A., Ramli, M.Z., Abd Razak, S.K.M. (2015). Disaster management and mitigation for earthquakes: Are we ready? In Proceedings of the 9th Asia Pacific Structural Engineering and Construction Conference, Johor Bahru, Malaysia, 03–05 November 2015.
[45] Lamat, Z., Jamian, Y., Eskandar, M.A.A. (2017). Site specific ground response spectra of Bakun. Pertanika Journal of Science and Technology, 25: 23-27.
[46] Sali, A., Zainal, D., Ahmad, N.T., Omar, M.F. (2017). Satellite application for felt earthquake events in Sabah, Malaysia. International Journal of Environmental Science and Development, 8(2): 153. https://doi.org/10.18178/ijesd.2017.8.2.938
[47] Wang, Y., Wei, S., Wang, X., Lindsey, E.O., Tongkul, F., Tapponnier, P., Sieh, K. (2017). The 2015 M w 6.0 Mt. Kinabalu Earthquake: An infrequent fault rupture within the Crocker fault system of east Malaysia. Geoscience Letters, 4(6): 6-18. http://dx.doi. org/10.1186/s40562-017-0072-9
[48] Harith, N.S.H., Adnan, A., Tongkul, F., Shoushtari, A.V. (2017). Analysis on earthquake databases of Sabah region and its application for seismic design. International Journal of Civil Engineering & Geo-Environmental, 8(2): 1-5.
[49] Harith, N.S.H. (2016). Probabilistic seismic hazard assessment of east Malaysia using proposed empirical GMPE for shallow crustal earthquake. Ph.D. dissertation, Universiti Teknologi Malaysia, Johor, Malaysia.
[50] United States Geological Survey (USGS). (2018). Earthquake Catalog Record. https://earthquake.usgs.gov /earthquakes/search/, accessed on Oct. 12, 2018.
[51] Department of Minerals and Geosciences Malaysia (JMG). (2018). Ministry of Land, Water and Natural Resources. https://www.jmg.gov.my/add_on/mt/swk/tiles/, accessed on Sep. 15, 2018.
[52] MNA-EC8. (2015). NA-2017 to MS EN1998-1, Eurocode 8: Design of Structures for Earthquake Resistance – Part 1: General Rules, Seismic Actions and Rules for Buildings. Malaysia.
[53] Department of Standards. (2015). NA-2017 to MS EN1998-1, Eurocode 8: Design of Structures for Earthquake Resistance – Part 1: General Rules, Seismic Actions and Rules for Buildings. Malaysia.
[54] Malarvizhi, K., Kumar, S.V., Porchelvan, P. (2016). Use of high resolution google earth satellite imagery in landuse map preparation for urban related applications. Procedia Technology, 24: 1835-1842. http://dx.doi.org/10.1016/j.protcy.2016.05.231
[55] Shamsudheen, M., Dasog, G.S., Tejaswini, N.B. (2005). Land use/land cover mapping in the coastal area of north Karnataka using remote sensing data. Journal of the Indian Society of Remote Sensing, 33(2): 253-258. http://dx.doi.org/10.1007/BF02 990043
[56] Wang, H., Cheng, S. (2020). Spatiotemporal variation in land use of northeast China tiger and leopard national park. national parks. International Journal of Design & Nature and Ecodynamics, 15(6): 835-847. https://doi.org/10.18280/ijdne.150609
[57] Abd, H.A.A., Alnajjar, H.A. (2013). Maximum likelihood for land-use / land-cover mapping and change detection using landsat satellite images: A case study of south of Johor. International Journal of Computer & Electronics Research, 3(6): 26-33.
[58] Naharuddin, N., Malik, A., Rachman, I., Muis, H., Hamzari, H., Wahid, A. (2020). Land use planning for post-disaster soil liquefaction area based on erosion hazard index. International Journal of Design & Nature of Ecodynamics, 15(4): 573-578. https://doi.org/10.18280/ijdne.150415
[59] Seddiki, A., Dehimi, S. (2022). Using GIS Combined with AHP for mapping landslide susceptibility in Mila, in Algeria. International Journal of Design & Nature of Ecodynamics, 17(2): 169-175. https://doi.org/10.18280/ijdne.170202