Zuhair Jaber Mushref* | Abdul Hameed Wally abd | Ayad Mohammad Mikhlif | Salah Othman Abed
© 2022 IIETA. This article is published by IIETA and is licensed under the CC BY 4.0 license (http://creativecommons.org/licenses/by/4.0/).
OPEN ACCESS
This research is aiming at employing the modern geographic techniques of the geographic information systems GIS to represent the characteristics of the Al-Rutba district population, which were (55019) people by building a geographical database for the characteristics of the population of Al-Rutba city for the years (2010.2014.2022). Using a set of cartographic representation methods like (Stereoscopic composite columns, proportional distribution method (gradient shading) or the Choropleth method, relative circles, relative squares) through 1/10000 scale maps to eventually achieve the best results when implementing the cartographic output process. In a way that facilitates understanding and perception by finding the most appropriate cartographic representation method for projecting these data on the map according to their importance, relative weight and size.
cartographic representation, population characteristics, geographical techniques, Rutba district
The cartographic representation of any phenomenon facilitates communication and visual Which means the ability to receive, interpret, and analyze visual stimuli in the brain, and to make decisions based on interpreted results [1, 2]. perception between the origin and the user, thus, the temporal and spatial representation of the population according to statistical bases and data gives an accurate and clear picture of the extent of the population density with different indicators. Accordingly, the research subject (A Cartographic Representation of the Characteristics of Al-Rutba District Population) was selected to represent the spatial variation of the population distribution in a desert area with a wide spatial extension that suffers from a severe disorder in the distribution of the population that has negatively impacted the economic activity movement by extracting data at the level of administrative units of the (district) after processing and categorizing them using modern techniques to facilitate their understanding and perception by the recipient [3-5].
1.1 Research problem
The problem of research was identified by the following questions:
(1) Can different Cartography methods be used to facilitate visual perception in population characteristics maps?
(2) What are the appropriate variables for visual perception in the cartographic representation of population data?
1.2 Research hypothesis
Cartography is considered one of the most important visual perceptions in representing the spatial variation of population distribution in the vast cadastral area of research that facilitates the production of clear maps to increase the understanding and perception of the phenomenon distribution.
1.3 Research objective
This study is aiming at giving an accurate view of the role of modern technologies of GIS in the representation of data and information on the characteristics of the population in Al-Rutba district, besides, building a database of population characteristics to reach out to different cartographic models that give the best results in the cartographic output process that facilitates understanding and perceiving the characteristics of the population in the Rutba district.
1.4 Research area location
The research area covers (93445) km2 with a sprawling spatial extension that possesses administrative borders with the governorates of (Najaf and Karbala) and international borders with the Kingdom of Saudi Arabia from the southwest, and the Syrian Arab Republic from the north and the Hashemite Kingdom of Jordan from the west (Figure 1), which makes the population distribution spatially and temporally different, as it is concentrated exclusively in specific locations.
In addition, astronomically, it extends between latitudes (30.15) and (33.75) north and longitudes (38.56) and (42.09) east, Evidence that the geographical location affected the nature of the climate of the region from the lack of rainfall, since it is located within the dry areas, which in turn reflected on the economic life and the density of the population and their spatial distribution [6-8].
Source: The Republic of Iraq, Ministry of Water Resources, Directorate of Public Survey, Map of Iraq and Administrative Anbar, 2022, scale (1000000:1).
Figure 1. Al-Rutba district location in Iraq and Al-Anbar Province
Through this type, table data are converted into stereoscopic graphic columns whose sizes and lengths vary according to the difference in the data of the phenomenon to be represented on the map. Each column's length must be proportional to the value of the phenomenon it represents, taking into account the color of each column to show the size of its anthropomorphism in a clear and visually perceptible way [9-11].
Table 1. The size and proportional population distribution in Al-Rutba district according to the administrative units for the period 2010-2014-2022
|
Administrative unit |
2010 |
(٪) |
2014 |
(٪) |
2022 |
(٪) |
|
Al-Rutba |
30898 |
79.2 |
34898 |
79 |
43183 |
4% |
|
Al Waleed sub-district |
5130 |
13.2 |
5930 |
13.4 |
7642 |
82% |
|
Al Nkheeb sub-district |
2972 |
7.6 |
3369 |
7.6 |
4194 |
14% |
|
Total |
39000 |
100 |
44197 |
100 |
55019 |
100 |
Source: Republic of Iraq, Ministry of Planning and Development Cooperation, Central Agency for Statistics and Information Technology, Iraq population estimates 2022, unpublished data.
This method was implemented to the population distribution according to the administrative units of the district of Al-Rutba for the period (2010 - 2014 - 2022). Through Table 1 and Figure 2, we note that the Al-Rutba district center came at the forefront of the population for all years by about (30898, 34898, 43183) people for the years (2010 - 2014 - 2022) respectively Because the Ramadi district center is the most developed among the other centers in terms of the availability of services, whether infrastructure or community, as well as the availability of job opportunities, while Al-Nukhayb district came with the lowest population numbers by about (2972, 3369, 4194).
Source: Based on data from Table 1.
Figure 2. Geographical distribution of population in Al-Rutba district by administrative units for the period 2010-2014-2022<
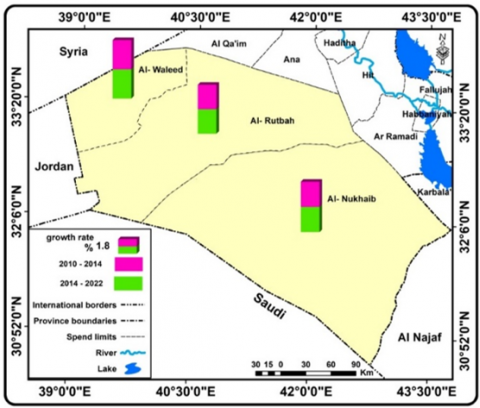
It is a way in which data are represented in the form of a single column divided into sections by the number of variables to be represented by the phenomenon. A color for each variable has been given that facilitates visual differentiation and comparison of the variables that have been represented. This method is less visually perceptible, as it was relied upon in order to compare with the rest of the methods and to show which one is better in the cartographic representation of the characteristics of the population [12-14].
From Table 2 and Figure 3, we note the representation of growth rates in Al-Rutba district with the highest rates from 2010- 2014 in Al-Nukhaib sub-district by about (3.69%), while Al-Waleed sub-district came with the highest rates by about (3.69%) form (2014-2022).
Table 2. Population growth rates in Rutba district for the period (2010-2022)
|
Administrative unit |
Growth rate 2010-2014 |
Growth rate 2014-2022 |
|
Rutba center |
3.18 |
3.09 |
|
Al Waleed sub-district |
3.09 |
3.69 |
|
Al Nukhaib sub-district |
3.69 |
3.18 |
Source: Republic of Iraq, Ministry of Planning and Development Cooperation, Central Agency for Statistics and Information Technology, Iraq population estimates 2022, unpublished data.
Source: Based on data from Table 2.
Figure 3. Population growth rates in Rutba district for the period (2010-2021)
This type of map is known by several names, sometimes called density maps and sometimes shadow maps, it is the type of cartographic representation in which shadows or colors are used to indicate the existing distribution of a phenomenon within a region limited by administrative boundaries or limited by equal lines. It draws the boundaries of the phenomenon in a specific area and then shades or colors this range. The areal shading map may be composite to distinguish a set of common elements by using sets of non-graded shading patterns (zepatons), colors may also be used.
Thus, to represent this method on the map, follow what comes:
(1) A base map should be obtained indicating the boundaries of the administrative units.
(2) Extracting the densities, percentages, rates, in relation to the cadastral units located therein, and covered within each administrative unit.
(3) Choosing category separators, the process of defining the separators depends on:
- Choose the number of categories.
- Choose the lengths of the categories.
Therefore, this method was used in the representation of population density, because it's the best way to show how different administrative units are As the color gradient starts from the light color, which represents the least density of the population, and then goes to the darker color, which represents the most densely populated, and we find in Table 3 and Figure 4 that the center of Al-Rutba district has the highest densities of 1.2 people /km2, while Al-Wali sub-district ranked second with (0.7) people / km2, and Al-Nukheeb district ranked last by about (0.1) people / km2 owing to the low population density compared to the area of the district [1, 15, 16].
Table 3. The general population density in Al-Rutba district at the level of administrative units 2022
|
Administrative unit |
Population |
Area (km2) |
General Density (people/km2) |
|
Al-Rutba center |
43183 |
35035 |
1.2 |
|
Al Waleed sub-district |
7642 |
10325 |
0.7 |
|
Al-Nakheeb sub-district |
4194 |
48085 |
0.1 |
|
Al-Rutba District |
55019 |
93445 |
0.6 |
Source: Republic of Iraq, Ministry of Planning and Development Cooperation, Central Agency for Statistics and Information Technology, Iraq population estimates 2022, unpublished data.
Source: Based on the data in Table 3.
Figure 4. Distribution of the general population density in Al-Rutba district at the level of administrative units 2022
The use of relative circles in mapping is a traditional skill in representing statistical data. The idea of drawing relative circles is based on entering the second dimension, "area", to convert the value into an area symbol proportional to the represented quantity. This method is called Gradated Circles. One of the most important areas of use is the distribution of the population, particularly for comparison between males and females and between urban and rural areas, which makes it easier for the reader to make a visual comparison of the variables represented. This type is based on the iteration of the circle code and in a direct ratio between the size of each circle and the size of data according to the administrative units of the study area, with a color given to each variable that was represented.
To represent data in this way, follow these steps:
(a) Find out the values of the radii of circles, using one of the two following methods:
- The mathematical method is based on the application of the law of the area of a circle (area = radius squared x constant ratio) and considering that the data values to be represented are (area = radius squared x constant ratio) the circles that will be represented, and therefore extracting the square root of the same numbers will represent the radii = 0.564 x m.
- James Flannery's Method: It is an innovative method by James Flannery in 1956 and it is an innovative method by James Flannery in 1956 and is named after him. This method is summarized by extracting the logarithm of values or data, multiplying them by 0.57 instead of 0.50, and then revealing the corresponding numbers. This method is a step to reduce the error of visual perception, as the area of the smaller circles will increase relative to the area of the larger circles so that it appears to the reader's eye in a decent proportion to the smaller circles.
(b) The numbers generated by method (a, b) are converted to radii that can be represented on the map, either by selecting a standard unit to which the outputs are divided or using one of the following methods:
- Arithmetic proportional method.
- Equal-sectional line style.
- Drawn line style according to the values of the square root.
The second method was adopted to convert the resulting numbers into radii through the use of two types of relative circles in representing the characteristics of the population.
This method was used in the cartographic representation of the population distribution by urban and rural. Through this method, it is possible to show the nature of variations in the numbers of both rural and urban populations. It appears from Table 4 and Figure 5 that the number of the rural population exceeds the urban population by about (33711) people and the rural population by 21,308, respectively. At the level of administrative units, the urban population is higher in both Al-Rutba district center and Al-Nukhayb sub-district, while Al-Waleed sub-district has outperformed the urban population in terms of the number of rural residents.
Table 4. Environmental distribution of population (Urban and Rural) in Rutba district at the level of administrative units 2022
|
Administrative Unit |
Urban |
Rural |
Total |
|
Al-Rutba center |
30660 |
12523 |
43183 |
|
Al Waleed |
535 |
7107 |
7642 |
|
Al-Nakheeb |
2516 |
1678 |
4194 |
|
Total |
33711 |
21308 |
55019 |
Source: Republic of Iraq, Ministry of Planning and Development Cooperation, Central Agency for Statistics and Information Technology, Iraq population estimates 2022, unpublished data.
Source: Based on data from Table 4.
Figure 5. Environmental distribution of population (Urban and Rural) in Rutba District at the level of administrative units 2022
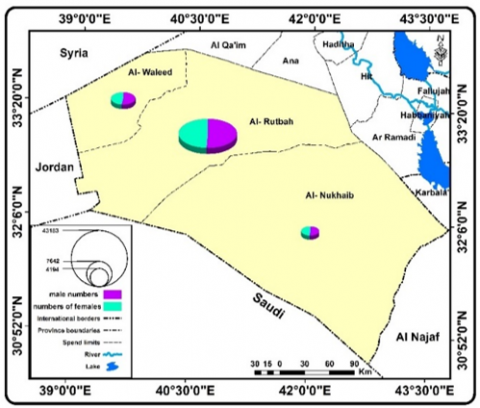
6.1 Stereoscopic divided relativistic circles method
The representation of this method is based on data on the qualitative composition of the population (male and female). From Table 5, it is shown that there are more males than females in the district, while at the level of administrative units, Al-Rutba district center had the highest numbers for males and females, while Al-Nukheeb sub-district came with the lowest numbers for males and females, Figure 6. This method was distinguished from the simplified circles method in giving a stereoscopic picture of the population distribution by adding another visual perceptual feature represented by the increase in the thickness of the circle as the number of population increased.
Table 5. Qualitative composition in Rutba district by administrative units 2022
|
Administrative Unit |
Males |
Females |
Total |
|
Al-Rutba center |
22023 |
21160 |
43183 |
|
Al Waleed |
4050 |
3592 |
7642 |
|
Al-Nakheeb |
2139 |
2055 |
4194 |
|
Total |
28212 |
26807 |
55019 |
Source: Republic of Iraq, Ministry of Planning and Development Cooperation, Central Agency for Statistics and Information Technology, Iraq population estimates 2022, unpublished data.
Source: Based on the data in Table 5.
Figure 6. The qualitative composition of gender ratio in Rutba district according to administrative units 2022
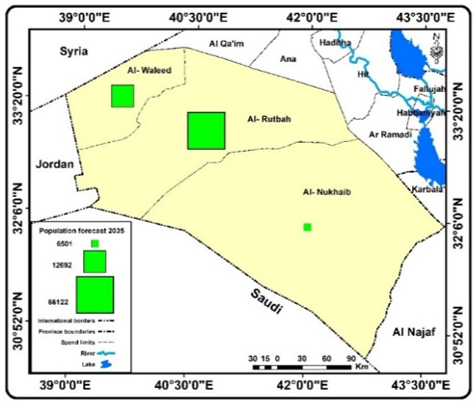
It is the method that uses the two-dimensional square shape and its representation steps are roughly the same as those of the circle method. Instead of the radii, the side length of the square is used, which are as follows:
(1) Determine the length of the side of the square, through the law of the area of the square, which is area = length 2 and the length of the side can be obtained by the following equation: side length= m;
(2) Converting the resulting numbers from step (1) to the side lengths of the squares can be represented on the map by following one of the methods mentioned in the method of relative circles.
This method is commonly used to represent population statistics Unlike relative circles, which can be used to represent more geographical phenomena, such as the population distribution in million cities or the representation of the number of people engaged in economic activities. As for the study area, the data of population projections until the year 2035 have been adopted, through which it is possible to know the extent of the expected population increase in each administrative unit, as shown in Table 6 and Figure 7.
Source: Based on data from Table 7.
Figure 7. Population forecasts in the district of Al-Rutba by administrative units until 2035
Table 6. Population forecasts in the district of Al-Rutba by administrative units until 2035
|
Administrative Unit |
2021 |
(٪) |
|
Al-Rutba center |
66122 |
78 |
|
Al Waleed |
12692 |
15 |
|
Al-Nakheeb |
6501 |
8 |
|
Total |
85315 |
100 |
Source: Republic of Iraq, Ministry of Planning and Development Cooperation, Central Agency for Statistics and Information Technology, Iraq population estimates 2022, unpublished data.
(1) The results of the research showed that the cartographic representation showed the extent of spatial variation in the characteristics of the population among the administrative units of Al- Rutba district.
(2) Research results have shown that geographic information systems (GIS) can choose the appropriate type of cartographic representation for each geographical phenomenon, particularly population phenomena, so that they can be easily understood and perceived visually and then read, interpreted, and thus analyzed.
(1) The need to rely on GIS techniques to produce maps so that they can be completed faster, more precisely, and with lower costs.
(2) Geographical Information Systems (GIS) techniques can choose the appropriate symbols and shapes to represent geographical phenomena in a way that is easy to perceive visually.
[1] Onwuegbuzie, A.J., Dickinson, W.B. (2008). Mixed methods analysis and information visualization: graphical display for effective communication of research results. Qual. Rep., 13(2): 204-225. https://doi.org/10.46743/2160-3715/2008.1595
[2] Abdulhameed, I.M., Sulaiman, S.O., Ahmed Najm, A.B., Al-Ansari, N. (2022). Optimising water resources management by Using Water Evaluation and Planning (WEAP) in the West of Iraq. Journal of Water and Land Development, 53: 176-186. https://doi.org/10.24425/jwld.2022.140795
[3] Yousuf, M.A., Rapantova, N., Younis, J.H. (2018). Sustainable water management in Iraq (Kurdistan) as a challenge for governmental responsibility. Water (Switzerland), 10(11): 1-19. https://doi.org/10.3390/w10111651
[4] Salleh, M.H. (2009). Words over borders: Trafficking literatures in Southeast Asia. Asiat. IIUM J. English Lang. Lit., 3(2): 1-24.
[5] Albelbeisi, A.H., Albelbeisi, A., El Bilbeisi, A.H., Takian, A., Akbari‐Sari, A. (2020). Capacity of Palestinian primary health care system to prevent and control of non‐communicable diseases in Gaza Strip, Palestine: A capacity assessment analysis based on adapted WHO‐PEN tool. Int. J. Health Plann. Manage., 35(6): 1412-1425. https://doi.org/10.1002/hpm.3022
[6] Abdulhameed, I.M., Sulaiman, S.O., Najm, A.B.A. (2021). Reuse wastewater by using water evaluation and planning (WEAP)(Ramadi City–Case Study). in IOP Conference Series: Earth and Environmental Science, 779(1): 12104. https://doi.org/10.1088/1755-1315/779/1/012104
[7] Sulaiman, S.O., Najm, A.B.A., Kamel, A.H., Al-Ansari, N. (2021). Evaluate the optimal future demand of water consumption in Al-Anbar Province in the West of Iraq. Int. J. Sustain. Dev. Plan., 16(3): 457-462. https://doi.org/10.18280/ijsdp.160306
[8] Najm, A.B.A., Abdulhameed, I.M., Sulaiman, S.O. (2020). Water requirements of crops under various Kc coefficient approaches by using water evaluation and planning (WEAP). International Journal of Design & Nature and Ecodynamics, 15(5): 739-748. https://doi.org/10.18280/ijdne.150516
[9] Mushref, Z.J., Khalaf, A.M., Al-Ani, S.O.A. (2021). The model of digital cartographic layers of different scales to calculate the ratios of cartographic generalizations: An applied study to Anah city. International Journal of Sustainable Development and Planning, 16(7): 1245-1252. https://doi.org/10.18280/ijsdp.160705
[10] Khalaf, A.M., Mushref, Z.J., Khaleefah, I.M., Abed, S.O. (2021). Relational modelling of the earth’s surface topography impact on vegetation density using RS and GIS: Rawnduz as a model. Int. J. Des. Nat. Ecodynamics, 16(4): 435-444. https://doi.org/10.18280/ijdne.160410
[11] Tomlinson, R.F. (1988). The impact of the transition from analogue to digital cartographic representation. Am. Cartogr., 15(3): 249-262. https://doi.org/10.1559/152304088783886937
[12] Abdul, S., Ahmed, G., Mushref, Z.J. (2021). Three-dimensional modeling of visual pollution of generator wires in Ramadi City. PalArch's Journal of Archaeology of Egypt/ Egyptology, 18(7): 1659-1668.
[13] abed Hammad, L.M. (2021). Dynamic analysis of the impact of anbar university on increasing traffic congestion in Ramadi. PalArch’s J. Archaeol. Egypt/Egyptology, 18(7): 189-199.
[14] Jaber, Z., Talak, A., Mohammed, A., Abed, K., Othman, S. (2020). Geomatics techniques of assessing the land cover of sehailiya valley’s basin in Iraq. Multicultural Education, 6(3): 133-142. https://doi.org/10.5281/zenodo.4147298
[15] Wang, C., Yu, C. (2021). Design, development and applicability evaluation of a digital cartographic model for 3d cadastre mapping in China. ISPRS Int. J. Geo-Information, 10(3): 158. https://doi.org/10.3390/ijgi10030158
[16] Grünreich, D. (2020). Development of computer-assisted generalization on the basis of cartographic model theory. Gis and Generalization, CRC Press, 47-55.