Ghadeer Jamal Hasham | Majeed Mattar Ramal*
© 2022 IIETA. This article is published by IIETA and is licensed under the CC BY 4.0 license (http://creativecommons.org/licenses/by/4.0/).
OPEN ACCESS
Scientist and researchers were recognized the important of water quality, Water resources are especially susceptible aquatic systems to many pollutants sources. Determination of water quality characteristics are very significance in term of the environmental considerations. This study aims to assess the water quality of the Euphrates river in the Fallujah Euphrates Reach (FER) by measuring the concentration of chemical and physical properties of water using multiple devices. CWQI and WAWQI were also used to assess the quality of water and indicate its suitability for drinking purposes, based on standard specifications from IQS, WHO, and USEPA as a criterion for comparison purposes. The findings show that with the use of CWQI, the quality of water was fair based on IQS, good based on WHO, and marginal based on USEPA, while the quality ranged between good, poor, very poor, and unsuitable for drinking purposes as a result of using WAWQI, with the exception of station 7, where the value of the WAWQI was greater than 100 mg/L, which indicates that the water is not suitable for drinking purposes as a result of the pollution of this station from a point source, which caused the high concentration of turbidity, sulfate, BOD5, and total dissolved solids, and decreased the DO concentration in this station compared to the rest of the stations, which were within the permissible.
water quality, assessment, WAWQI, CWQI, Euphrates, Fallujah city
Rivers are the most important component of water resources utilized to meet human requirements. Surface water quality should be researched from a quality standpoint due to the significant implications it has on the environment and human health [1]. Water quality is influenced by natural factors such as geology, climate, and hydrology, as well as manmade factors such as urban and agricultural drainage and industrial waste [2].
Iraqi rivers' water is becoming more threatened as a result of rising hardness, industrial, salinity, and agricultural pollution, and water scarcity due to climate change-reduced precipitation in the north part of Iraq, as well as poor irrigation planning and the numerous dams erected in Iran, Syria, and Turkey [3, 4]. In addition to the expected decrease in the amount of freshwater accessible in the future, Thus, surface water quality has become a key problem in recent years. Water quality may be determined by evaluating its chemical, physical, and biological qualities. Monitoring the sources of pollutants and attempting to avoid or reduce their impacts is one of the ways that may be used to keep Iraq's surface water safe [5-7].
One of the traditional methods of water quality evaluation involves comparing the observed values of water quality variables within water samples with an accessible reference guideline for the same variables. A large number of characteristics must be determined in order to determine the quality of river water. Even for experts on the topic of water, tabulating and interpreting these factors might be challenging at times. Furthermore, it may not necessarily give a full picture of the water quality situation or an integrated understanding of it. As a result, a variety of measures, such as water quality indexes, have been used to combat the problem. In 1965, Horton (1965) created the first numerical WQI model, which included eight parameters. Following the Horton index, a slew of other indexes have been established by various organizations and writers throughout the world. The original Oregon Water Quality Index and the National Sanitation Foundation Water Quality Index (NSFWQI), for example, were established in the 1970s and 1980s [8]. A WQI is a dimensionless number that works to unify the values of classification curves by integrating many water quality variables into a single number and enabling straightforward data monitoring analysis. The following are some of the advantages and applications of water quality indices: 1-Increasing the objectivity and decreasing the subjectivity of policy decisions 2-To provide a holistic picture of the source's overall quality so that non-technical stakeholders may grasp it. 3-To identify the differences in situations after and before the regulatory policy or law is implemented. 4: Comparing the quality of water from various sources and deciding on the best way to use the water resource at hand [9]. In addition to being one of the most successful methods for communicating information about water quality to concerned individuals and policymakers. As a result, it has become a crucial criterion for surface water evaluation and management. A WQI rating is a rating that reflects the combined impact of many water quality factors. The WQI is determined using the appropriateness of water for human consumption as a criterion [10]. Water quality data is crucial for implementing sustainable water management methods. Water quality is determined by the physical and chemical features of a sample of water, as well as water quality rules, and produces a single number that indicates water quality at a given place and time, based on many water quality criteria. Using appropriate indices is one of the most efficient methods to gather information on water quality trends [11].
Kareem et al. studied the water quality of the Shatt al-Kufa, one of the branches of the Euphrates river, by adopting three indices of water quality in the case of the presence and absence of phosphates. It was the metric that came closest to meeting the criteria. The indices were the Canadian Council of Ministers of the Environment Water Quality Index (CCMEWQI), the Weighted Arithmetic Water Quality Index (WAWQI), and the Oregon Water Quality Index (OWQI). The study included the analysis of fifteen characteristics of water quality, which are: Nitrate, Total Hardness, pH, Dissolved Oxygen, Biological Oxygen Demand, Orthophosphate, Turbidity, Magnesium, Total Dissolved Solids, Calcium, Chloride, Potassium, Sodium, Sulfate, and Alkalinity. The results of using the CCMEWQI in the presence of phosphates showed that the water quality was marginal and fair, while the results showed the use of the index WAWQI showed that the quality of the water was good in the presence of phosphates and bad in the absence of them, while the result of the index OWQI showed that the water quality was very poor in both cases, the presence and absence of phosphates [12].
Abbas and Hassan assessed the water quality of the Euphrates river in the Al-Qadisiyah Governorate called Al-Diwaniyah river using the water quality index called Canadian Water Quality (CWQI) by using nine environmental characteristics to assess the water quality in four locations along the river’s course, which include: dissolved oxygen, pH, total alkalinity, water temperature, phosphate, nitrate, turbidity, nitrite, and total dissolved solids). The results of using the indicator (CWQI) showed that the water quality of the river in this study area ranges from poor to marginal [2].
Applying the water quality indices (WQIs) are very useful, WQIs give a specific water quality value which help to manage and control upon the water quality. In other side some sub-WQIs are cost and time consuming such as BOD5.
The main objective of this study is to assess the water quality of the Euphrates river in the Fallujah Euphrates Reach (FER) by using two indicators of water quality assessment: Canadian Water Quality Index (CWQI) and Weighted Arithmetic Water Quality Index Method (WAWQI) for the purpose of showing the suitability of the Euphrates river water in the study section for drinking purposes by adopting three standard specifications: IQS, WHO, and USEPA. The importance and motivation of this study area were due to there is no new studies were conducted in this area (FER), and the importance of this section as it is the main source of water supply for Fallujah city the largest cities in the Anbar Governorate, and many wastewater point sources were discharged into (FER).
2.1 Study area
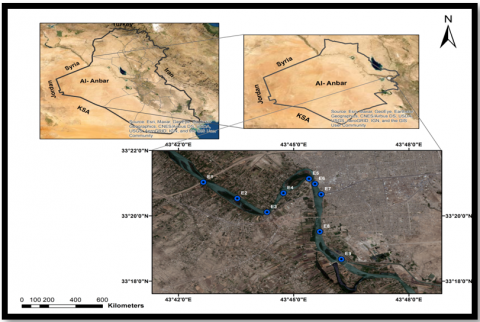
The Euphrates, the Middle East's longest river, rises from Turkey's eastern highlands. Turkey holds 40% of the river, while the remainder is split between Syria and Iraq [13, 14]. The study area is a section of the Euphrates river extending from the Saqlawiyah Bridge to the Fallujah dam called the Fallujah Euphrates Reach, which is located between latitudes 33°21'01.7''N to 33°18'10.9''N and longitudes 43°42'39.1'' E to 43°46'51.7''E as shown in Figure 1. The Euphrates river and its branches extend into the major cities of the Anbar Governorate, such as Ramadi and Fallujah, and it is a major source of water as the residents of these areas depend on it for drinking, agriculture, and industrial purposes in addition to being a drain for sewage after the treatment process, especially in Fallujah city, which is one of the largest cities in Anbar Governorate in western Iraq, which is about 47 km east of the city of Ramadi and 60 km west of Baghdad. The river water in the study area is also affected by human activities represented by industrial, domestic, and agricultural activities [15-17].
Figure 1. Study area boundary and sampling stations
2.2 Sampling
Water samples were collected monthly during the period from October 2021 to March 2022 using high quality polyethylene bottles with a capacity of 1 liter from ten locations along an 11-kilometer stretch of the Euphrates river in the study area. A sample was taken at a depth of 30 cm under the surface of the water, and a GPS map was used to determine the sampling sites based on the available coordinates as shown in Table 1.
Table 1. Sampling stations cordinates
|
Station |
Latitude |
Longitude |
|
S1 |
33°21'01.7'' N |
43°42'39.1'' E |
|
S2 |
33°20'31.9'' N |
43°43'32'' E |
|
S3 |
33°20'06.7'' N |
43°44'18.4'' E |
|
S4 |
33°20'41.7'' N |
43°44'44.1'' E |
|
S5 |
33°21'08.1'' N |
43°45'24'' E |
|
S6 |
33°20'58.7'' N |
43°45'33.4'' E |
|
S7 |
33°20'39.6'' N |
43°45'43'' E |
|
S8 |
33°19'30.9'' N |
43°45'40.9'' E |
|
S9 |
33°18'40.3'' N |
43°46'14.6'' E |
|
S10 |
33°18'10.9'' N |
43°46'51.7'' E |
2.3 Materials
Several devices measure the concentration of chemical and physical properties of water samples for the purpose of evaluating the quality of water and indicating its suitability for drinking purposes. The water quality characteristics that measured including pH-value, Total Dissolved Solids (TDS), Total Suspended Solids (TSS), Turbidity, Electrical Conductivity (EC), Nitrate (NO-3), Sulfates (SO4-2), Dissolved Oxygen (DO) and Biochemical Oxygen Demand (BOD5), All water quality parameters were measured in the laboratory except (DO) which measured in the field. Table 2 shows the water quality parameters and equipments. Sampling and analysis were carried out based on the American Public Health Association (APHA) standards of testing water and wastewater [18].
Table 2. Water quality parameters and equipments
|
Parameters |
Unit |
Instrument |
APHA method |
|
pH |
- |
Digital pH meter |
4500-H+ |
|
TDS |
mg/L |
Conductivity meter |
2540 C |
|
TSS |
mg/L |
Gravimetric method |
2540 D |
|
Turbidity |
NTU |
Digital turbidity meter |
2130 B |
|
EC |
(µS/cm) |
Conductive meter |
2510 A |
|
NO3- |
mg/L |
Steam distillation method |
4500-NO3- |
|
SO4-2 |
mg/L |
(Spectrophotometer) |
4500-SO4 E |
|
DO |
mg/L |
Lovibond Senso direct |
4500-O G |
|
BOD5 |
mg/l |
Oxi direct Device |
5210 B |
2.4 Physical and chemical assessment
Water quality index (WQI) is a mathematical instrument that converts enormous amounts of data on water quality into a single value that represents the current water quality level [19]. Water quality indices are excellent instruments for communicating information about water quality to concerned individuals and policymakers. They are critical factors in evaluating and managing both ground and surface water [20]. Quantification of the water quality index can be determined applying the following methods.
2.4.1 Canadian Water Quality Index (CWQI)
Table 3. CWQI chassification and description [21, 22]
|
Quality |
Class |
Index value |
Description |
|
Excellent |
I |
95-100 |
This range depicts circumstances that are extremely similar to normal, and there are no signs of contamination in the water. |
|
Good |
II |
80-94 |
The water supply must be carefully protected and managed, and conditions should seldom deviate from normal or recommended levels. |
|
Fair |
III |
65-79 |
Water quality is normally safeguarded, although it is occasionally jeopardized; circumstances occasionally diverge from normal or desirable levels. |
|
Marginal |
IV |
45-64 |
Water quality at the limit point. Frequently threatened or poor; conditions often fall outside normal or preferred levels |
|
Poor |
V |
0-44 |
This category depicts water quality that is almost endangered or poor; most circumstances are outside the normal or recommended ranges. |
The CWQI can be calculated in two ways. The first stage is to determine the kind of water supply, the research duration, the allowed parameters and their standard values, as well as the study's objectives. The second phase is calculating each of the three elements that make up the index's primary structural makeup. F1 and F2 can be calculated quickly, while F3 needs a few more steps [21]. Table 3 classifies and describes the water quality according to CWQI [22, 23].
The CWQI is calculated by applying Eqns. (1)-(6) as follow [22, 23]:
$F_1=\frac{N F P}{T N P} \times 100$ (1)
where:
F1= represent scope the percentage of parameters that passed the guideline.
NFP: Number of failed parameters.
TNP: Total number of parameters.
and,
$\mathrm{F}_2=\frac{\mathrm{NFM}}{\mathrm{TNM}} \times 100$ (2)
where:
F2 = represent Frequency the percentage of individual tests that exceeded their standard values
NFM =number of failed tests or measurements.
TNM = Total number of tests or measurements.
and,
$F_3=\frac{N}{0.01 N+0.01}$ (3)
$E X_i=\left(\frac{F M V_i}{S V}\right)-1$ (4)
$N=\frac{\sum_{\mathrm{i}=1}^{\mathrm{n}} \mathrm{EX}_{\mathrm{i}}}{\mathrm{TNM}}$ (5)
where:
F3= Represents Amplitude the amount by which failed test exceeds their standard values.
EXi= (excursion) represents the number of times that test is exceed the guidelines.
FMVi= Failed test value.
SV = Represent the guideline value.
TNM: Represent total number of tests.
N = Represent the normalized sum of excursion.
Finally, CWQI may be expressed mathematically as:
$\mathrm{CWQI}=100-\frac{\sqrt{F 1^2+F 2^2+F 3^2}}{1.732}$ (6)
2.4.2 Weighted Arithmetic Water Quality Index (WAWQI)
One of the most prevalent approaches for calculating WQI is the weighted arithmetic (WA) method. Using the most regularly observed WQ characteristics, the WA technique classifies WQ according to its purity level. In Iraq, this technique of calculating the WQI is commonly utilized. This method's philosophy is mostly determined by the weight of each parameter [24]. Table 4 classifies and grades the water quality based on WAWQI [24].
Table 4. Classification and grade based on WAWQI
|
WQI value |
Grading |
Rating of water quality |
|
0 – 25 |
I |
Excellent water quality |
|
25 -50 |
II |
Good water quality |
|
50 – 75 |
III |
Poor water quality |
|
75 – 100 |
IV |
Very poor water quality |
|
>100 |
V |
Unsuitable for drinking purpose |
The calculation of WAWQI was made by using Eqns. (7)-(10) [24, 25]:
$\mathrm{WQI}=\frac{\sum_{i=1}^{i=n} Q_i W_i}{\sum_{i=1}^{i=n} w_i}$ (7)
where:
wi=Represent the unit weight for each parameter of water quality.
Qi =Represent quality rating curve.
$Q_i=\left(\frac{V_i-V_o}{s_i-V_o}\right) \times 100$ (8)
where:
Vo =represent ideal value for parameters which equal to zero in pure water except DO which equal to 14.6 mg/l and pH which value equal to 7.0 mg/l Vi=represent the estimated concentration of ith parameter through the process of analyzed water.
Si = represent the standard value recommended for i th parameter.
$W_i=\frac{K}{S_i}$ (9)
and
$\mathrm{K}=\frac{1}{\sum \frac{1}{S_i}}$ (10)
where:
K is representing the constant of proportionality.
Table 5 shows the parameters applied to calculate water quality ideces (objective) according to (IQS, WHO and USEPA) [26-30].
2.4.3 Water quality indices variation
Despite using the same characteristics, each indices categorization varies, particularly in the assessment of water sources. The values of indices and their categories are close in the examination of wastewater. The fact that the indices vary in categorization explains the classification disparity and class boundaries were created for the United States and may not be appropriate to Columbia owing to cultural differences and many natural and man-made activities [31].
Akkoyunlu and Akiner used CWQI and NSFWQI to evaluate water quality in eight rivers in Turkey; they show a significant difference between the classes of the water quality in the same site but with different indices [32].
The ultimate categorization of water quality is affected by the amount of factors added in WQI. One must wonder if the few factors used in the WQI computation are the greatest important in defining water quality. Is the commonly computed WQI still meaningful if additional contaminants, such as heavy metals, are present in the water, limiting its quality? In essence, this contradicts Horton's original WQI concept: "Water containing such compounds is not regarded appropriate for index rating."
If, on the other hand, a significant number of factors are included, it is likely that they are not independent, allowing for the use of fewer variables to identify any water quality degradation [33].
Table 5. The parameters applied (objective)
|
Parameter |
Criteria |
||
|
IQS |
WHO |
USEPA |
|
|
EC |
2000 |
2500 |
- |
|
pH |
8 |
8 |
8 |
|
NO3 |
50 |
- |
- |
|
SO4 |
250 |
400 |
250 |
|
TSS |
1000 |
- |
- |
|
TDS |
1000 |
1000 |
500 |
|
Turbidity |
5 |
5 |
5 |
|
BOD |
<5 |
10 |
5 |
|
DO |
8.3 |
6 |
8.5 |
3.1 Physical and chemical parameters
Table 6 and Figures 2-10 show the average concentration of the chemical and physical properties of the Euphrates river within Fallujah city in the period between October 2021 and March 2022. The standard specifications (IQS, WHO, and USEPA) were adopted as a criterion for the purpose of comparison to show the suitability of Euphrates river as drinking source.
Table 6. Average water quality parameters results and standard criteria
|
Stations |
pH |
TDS (mg/L) |
TSS (mg/L) |
Turbidity (NTU) |
EC (µs/cm) |
NO3 |
SO4 |
BOD5 |
DO |
|
S1 |
7.9 |
912 |
6 |
3 |
1130 |
5 |
360 |
4 |
7 |
|
S2 |
7.8 |
920 |
8 |
2 |
1134 |
3 |
355 |
4 |
8 |
|
S3 |
7.7 |
918 |
10 |
5 |
1125 |
4 |
366 |
3 |
8.3 |
|
S4 |
7.8 |
912 |
8 |
4 |
1133 |
5 |
362 |
5 |
8 |
|
S5 |
7.9 |
906 |
7 |
5 |
1140 |
6 |
357 |
6 |
7 |
|
S6 |
7.8 |
914 |
12 |
3 |
1135 |
10 |
359 |
5 |
7.3 |
|
S7 |
7.9 |
920 |
18 |
6 |
1132 |
8 |
367 |
7 |
5 |
|
S8 |
7.7 |
916 |
8 |
2 |
1133 |
9 |
358 |
8 |
8 |
|
S9 |
7.7 |
912 |
4 |
1 |
1137 |
6 |
355 |
5 |
9 |
|
S10 |
7.8 |
918 |
8 |
2 |
1132 |
5 |
363 |
7 |
8.4 |
|
Objective(IQS) |
6.5-8.5 |
1000 |
1000 |
5 |
2000 |
50 |
250 |
>5 |
8.3 |
|
Objective (WHO) |
6.5-8.5 |
1000 |
- |
5 |
2500 |
- |
400 |
10 |
6 |
|
Objective (USEPA) |
6.5-8.5 |
500 |
- |
1-5 |
- |
- |
250 |
5 |
8.5 |
The results of the properties analysis showed that, the average pH-value of all stations was within the recommended (IQS, WHO, and USEPA) limit of (6.5-8.5). The average concentration of TDS for the entire stations was less than the recommended values based on (IQS and WHO) criteria of (1000 mg/L), while it exceeded the permissible guide of USEPA specification (500 mg/L). The presence of TDS in the water is not considered a primary pollutant, but it is an indication of the presence of chemical pollutants in the water as a result of sewage or leakage from residential areas. The average concentration of TSS in the water was much less than the permissible range according (IQS, WHO, and USEPA). The average Turbidity value in stations were less than the permissible limit of (5 NTU), except for the seventh station, where the Turbidity value was 6 because this point near a point source, which is the beside of the Resalah water station, the polluted water returns directly to the river, that is, the presence of a reference pipe for the overflowing water from this station to the river. The average value of electrical conductivity (EC) for all stations and for all the months of the test did not exceed the recommended values 2000 and 2500 (µS/cm) according to the IQS and WHO respectively. The average nitrate concentration was less than the recommended values according to the Iraqi standard (50 mg/L) in all stations. The average concentration of sulfate exceeded the permissible values of the IQS and USEPA standards, the highest concentration of sulfate was at S7, it was (367 mg/L), and this may be due to the high acidity of the water due to pollution, while all average concentration were within the recommended limits of the WHO standard (400 mg/L). The average concentration of DO in the water samples was measured directly in the field, DO concentration in all stations were within the recommended by (IQS, USEPA and WHO) criteria (> 5mg/L). the minimum concentration was on stations 7 (S7), where its concentration was (5 mg/L) due to the presence of point sources causing pollution which may contains organic biodegradable substances causing DO depletion. The average concentration of BOD5 in some stations exceeded the recommended limits based on IQS and USEPA criteria, the average concentration of BOD5 in all stations comply with the recommended criteria by WHO, it can be considered that the Euphrates River in this section is polluted but moderately because BOD5 concentration did not exceed (8 mg/L) [34].
Figure 2. pH-value in (FER)
Figure 3. Total dissolved solids concentration in (FER)
Figure 4. Total suspended solids concentration in (FER)
Figure 5. Turbidity concentration in (FER)
Figure 6. Electrical conductivity concentration in (FER)
Figure 7. Nitrate concentration in (FER)
Figure 8. Sulphate concentration in (FER)
Figure 9. Biochemical Oxygen Demand concentration in (FER)
Figure 10. Dissolved Oxygen concentration in (FER)
3.2 CWQI
Table 7 shows the three basic factors (F1, F2 and F3) of the indicator CWQI were calculated. Figures 11 and 12 show the three basic factors (F1, F2 and F3) of the indicator CWQI and WAWQI indices respectively. CWQI was used to evaluate the river water quality and indicate its suitability for drinking purpose sand. The (IQS, WHO, and USEPA) criteria were adopted as a standard guide for comparison [27-29, 34, 35]. The results of the CWQI showed that the water quality was fair based on IQS and USEPA guides, while was good based on WHO criteria.
Table 7. CWQI parameters and CWQI
|
Criteria |
F1 |
F2 |
F3 |
CWQI |
Class |
|
IQS |
44.44 |
18.88 |
6.54 |
71.86 |
Fair |
|
WHO |
22.22 |
11.11 |
3.03 |
85.55 |
Good |
|
USEPA |
55.55 |
28.88 |
13.93 |
62.96 |
Marginal |
Figure 11. Factors values based on IQS, WHO, and USEPA
Figure 12. CWQI classification based on IQS, WHO, and USEPA
3.3 WAWQI
The WAWQI is one of the most commonly used techniques in Iraq to assess surface water by determining the weight of each parameter based on the recommendations of IQS, WHO, and USEPA as shown in Table 8 and Figure 13. The results of WAWQI by adopting the IQS showed that the water quality were poor and very poor in some stations, and in station 7 S7), the index value was greater than 100, which indicated that the water quality was not suitable for drinking purposes, and the quality ranged from good to poor and very poor based on the WHO standard, while WAWQI’s value according to USEPA was ranged between poor and very poor, based on Table 4 with the indicator’s value in (S5 and S7) stations being greater than 100, which were caused by water pollution due to the effluent discharge point of Fallujah wastewater treatment plant.
Table 8. WAWQI parameters and WAWQI
|
Stations |
Sub-WAWQI |
||
|
|
IQS |
WHO |
USEPA |
|
S1 |
81.76 |
70.8 |
85.04 |
|
S2 |
81.76 |
58.48 |
73.64 |
|
S3 |
79.86 |
73.81 |
83.08 |
|
S4 |
88.66 |
73.6 |
92.15 |
|
S5 |
99.67 |
80.87 |
103.53 |
|
S6 |
85.2 |
69.33 |
88.29 |
|
S7 |
112.95 |
90.75 |
117.12 |
|
S8 |
92.98 |
63.1 |
96.39 |
|
S9 |
65.84 |
47.85 |
68.41 |
|
S10 |
87.41 |
62.13 |
90.84 |
|
Average WAWQI |
87.61 |
69.07 |
89.85 |
|
Class |
fair |
good |
marginal |
Figure 13. Average concentration of physical and chemical parameters by using the recommendations IQS, WHO, and USEPA according to WAWQI
The water quality of the Euphrates River was assessed using two WQIs in this article. The selected WQIs have various methods of implementation. The water quality of the Euphrates River at ten sampling stations was fair for CWQI according to IQS criteria, good according to WHO criteria, marginal according to USEPA criteria. The stations water quality ranged from poor and very poor, which is unsuitable for drinking purposes based on IQS criteria. The stations water quality ranged from good, poor, and very poor based on WHO criteria.
The value of WAWQI ranged between good, poor, very poor, and unsuitable in (S5 and S7) stations. The use of CWQI gave realistic results because this index has the ability to take into account all the parameters of water quality compared to other indices, and there is no difference in importance between the parameters; each has the same importance. This index can express the suitability of water for drinking purposes, aquatic life, and other uses, while the other indices each have a specific use. As well as the WAWQI being used because of its common use in Iraq for evaluating the quality of surface water for drinking purposes, the results of its application showed that (S5 and S7) stations suffers from pollution caused by water pollution due to the effluent discharge point of Fallujah wastewater treatment plant.
There are many problems face the research include, the access difficulty to the sampling stations due to security issues.
Future research direction is to monitor taps drinking water quality of Fallujah city and adding other variables such as heavy metals and biological parameters.
[1] Shojaei, M., Nazif, S., Kerachian, R. (2015). Joint uncertainty analysis in river water quality simulation: A case study of the Karoon River in Iran. Environmental Earth Sciences, 73(7): 3819-3831. https://doi.org/10.1007/s12665-014-3667-x
[2] Abbas, A.A.A., Hassan, F.M. (2018). Water quality assessment of Euphrates river in Qadisiyah Province (Diwaniyah River), Iraq. Iraqi Journal of Agricultural Sciences, 49(2): 251-261.
[3] Ewaid, S.H. (2017). Water quality evaluation of Al-Gharraf river by two water quality indices. Applied Water Science, 7(7): 3759-3765. https://doi.org/10.1007/s13201-016-0523-z
[4] Ramal, M.M., Jalal, A.D., Abdulhameed, U.H. (2021). Heavy metal assessment in taps drinking water of Ramadi city using water quality Indices, Anbar Province, Iraq. International Journal of Sustainable Development and Planning, 16(7): 1349-1357. https://doi.org/10.18280/ijsdp.160715
[5] Chabuk, A., Al-Madhlom, Q., Al-Maliki, A., Al-Ansari, N., Hussain, H.M., Laue, J. (2020). Water quality assessment along Tigris River (Iraq) using water quality index (WQI) and GIS software. Arabian Journal of Geosciences, 13(14). https://doi.org/10.1007/s12517-020-05575-5
[6] Ghalib, H.S., Ramal, M.M. (2021). Spatial and temporal water quality evaluation of heavy metals of Habbaniyah Lake, Iraq. International Journal of Design & Nature and Ecodynamics, 16(4): 467-475. https://doi.org/10.18280/ijdne.160414
[7] Ramal, M.M., Abdulhameed, U.H., Jalal, A.D. (2021). Trace elements risk assessment in taps drinking water of Ramadi City, Anbar Province, Iraq. International Journal of Safety and Security Engineering, 11(6): 623-634. https://doi.org/10.18280/ijsse.110602
[8] Ismail, A.H., Robescu, D. (2019). Assessment of water quality of the Danube river using water quality indices technique. In Environmental Engineering and Management Journal, 18: 1727-1737. https://doi.org/10.30638/eemj.2019.163
[9] Ewaid, S.H., Abed, S.A., Al-Ansari, N., Salih, R.M. (2020). Development and evaluation of a water quality index for the Iraqi rivers. Hydrology, 7(3). https://doi.org/10.3390/HYDROLOGY7030067
[10] Yisa, J., Jimoh, T. (2010). Analytical studies on water quality index of river Landzu. American Journal of Applied Sciences, 7(4): 453-458. https://doi.org/10.3844/ajassp.2010.453.458
[11] Abdullah, S.A., Abdullah, A.H.J., Ankush, M.A. (2019). Assessment of water quality in the Euphertes River, Southern Iraq. Iraqi Journal of Agricultural Sciences, 50(1): 312-319.
[12] Kareem, S.L., Jaber, W.S., Al-Maliki, L.A., Al-husseiny, R.A., Al-Mamoori, S.K., Alansari, N. (2021). Water quality assessment and phosphorus effect using water quality indices: Euphrates River- Iraq as a case study. Groundwater for Sustainable Development, 14. https://doi.org/10.1016/j.gsd.2021.100630
[13] Akanda, A., Freeman, S., Placht, M., Nakhlah, A. (2007). The Tigris-Euphrates River Basin: Mediating a Path Towards Regional Water Stability. The Fletcher School Journal for Issues Related to Southwaet Asia and Islamic Cilvilization, 1-12.
[14] Sameer, S.M., Mustafa, A.S., Al-Somaydaii, J.A. (2021). Study of the sustainable water resources management at the upper Euphrates Basin, Iraq. International Journal of Design & Nature and Ecodynamics, 16(2): 203-210. https://doi.org/10.18280/ijdne.160210
[15] Mahmood, B. (2021). Environmental properties and analysis of the Euphrates river within Anbar governorate in Iraq: A review. Iraqi Journal of Desert Studies, 150-163. https://doi.org/10.36531/ijds/21110109
[16] Saod, W.M., Yosif, Y.M., Abdulrahman, M.F., Mohammed, A.H. (2021). Water quality index along the Euphrates between the cities of Al-Qaim and Falluja: A comparative study. In IOP Conference Series: Earth and Environmental Science (Vol. 779). IOP Publishing Ltd. https://doi.org/10.1088/1755-1315/779/1/012058
[17] Nasif Al Fahdawi, Y.M., Mashee Al Ramahi, F.K., Hamadi Alfalahi, A.S. (2021). Measurement Albedo Coefficient for Land Cover (Lc) and Land Use (Lu), Using Remote Sensing Techniques, A Study Case: Fallujah City. In Journal of Physics: Conference Series (Vol. 1829). IOP Publishing Ltd. https://doi.org/10.1088/1742-6596/1829/1/012003
[18] Gilcreas, F.W. (2012). Standard methods for the examination of water and wastewater. 22nd edition. American Public Health Association, Washington, DC. Corpus ID: 109254533.
[19] Bouslah, S., Djemili, L., Houichi, L. (2017). Water quality index assessment of Koudiat Medouar Reservoir, northeast Algeria using weighted arithmetic index method. Journal of Water and Land Development, 35(1): 221-228. https://doi.org/10.1515/jwld-2017-0087
[20] Tokatli, C. (2019). Drinking water quality assessment of ergene river basin (Turkey) by water quality index: Essential and toxic elements. Sains Malaysiana, 48(10): 2071-2081. https://doi.org/10.17576/jsm-2019-4810-02
[21] Mutasher, A.K.A., Al-mohammed, F.M., Aljibori, H.S.S. (2021). Groundwater quality assessment for irrigation purpose using water quality index in green belt project in Karbala city-Iraq. Journal of Engineering Science and Technology, 16(5): 4060-4078.
[22] Al-Mohammed, F.M., Al-Saadi, R.J.M., Al-Fawzy, A.M., Mohammed-Ali, S.H., Mutasher, A.K.A., Hommadi, A.H. (2021). The analysis of water quality using Canadian water quality index: Green belt project/Kerbala-Iraq. International Journal of Design and Nature and Ecodynamics, 16(1): 91-98. https://doi.org/10.18280/ijdne.160112
[23] Canadian Council of Ministers of the Environment. (2001). Canadian water quality guidelines for the protection of aquatic life. CCME Water QUALITY INDEX 1.0 User’s Manual.
[24] Noori, M.D. (2020). Comparative analysis of weighted arithmetic and CCME Water Quality Index estimation methods, accuracy and representation. In IOP Conference Series: Materials Science and Engineering, 737(1): 012174.
[25] Noori, M.M., Abdulrazzaq, K.A., Mohammed, A.H., Abbas, A.I. (2017). Assessment of water quality and suitability of Euphrates river in Iraq for drinking purpose by applying water quality indices (WQIs) and geographical information system (GIS) techniques. International Journal of Science and Nature, 8(4): 741-756.
[26] Iraqi Drinking-Water Standard. (2009). IQS: 417. Central Organization for Quality Control and Standardization, Council of Ministers, Republic of Iraq, pp. 1-9.
[27] Iraqi Standard Specification (IS) for drinking water, №417, 2001. https://pdfcoffee.com/-447--pdf-free.html.
[28] WHO. (2011). Guide lines for drinking water Quality. 4th Edition Geneva, p. 120.
[29] Mahmood, B.A. (2021). Environmental properties and analysis of the Euphrates river within Anbar governorate in Iraq: A review. Environmental Pollution, 11(1): 150-163. http://dx.doi.org/10.36531/ijds/21110109
[30] Sulthonuddin, I., Hartono, D., Said, C. (2020). Using Nemerow’s pollution index method for water quality assessment of Cimanuk River in West Java. Proceedings of the 1st International Conference on Environmental Science and Sustainable Development, ICESSD 2019, 22-23 October 2019, Jakarta, Indonesia. https://doi.org/10.4108/eai.22-10-2019.2291494
[31] Fernández, N., Ramírez, A., Solano, F. (2004). Physico-chemical water quality indices - a comparative review. Bistua: Revista de la Facultad de Ciencias Básicas, 2(1): 19-30.
[32] Akkoyunlu, A., Akiner, M.E. (2012). Pollution evaluation in streams using water quality indices: A case study from Turkey’s Sapanca Lake Basin. Ecol. Indic., 18: 501-511. https://doi.org/10.1016/j.ecolind.2011.12.018
[33] Li, D.L. (2019). Water quality monitoring and management. Detection of River Water Quality, 211-220. https://doi.org/10.1016/B978-0-12-811330-1.00007-7
[34] Ayandiran, T.A., Fawole, O.O., Dahunsi, S.O. (2018). Water quality assessment of bitumen polluted Oluwa river, South-Western Nigeria. Water Resources and Industry, 19: 13-24. https://doi.org/10.1016/j.wri.2017.12.002
[35] Ibrahim, S.A., Al-Tawash, B.S., Abed, M.F. (2018). Environmental assessment of heavy metals in surface and groundwater at Samarra City, Central Iraq. Iraqi Journal of Science, 59(3): 1277-1284. https://doi.org/10.24996/IJS.2018.59.3A.16