Devianti* | Irwansyah | Yuswar Yunus | Nunik Destria Arianti | Dewi Sartika Thamren | Agustami Sitorus
© 2022 IIETA. This article is published by IIETA and is licensed under the CC BY 4.0 license (http://creativecommons.org/licenses/by/4.0/).
OPEN ACCESS
The extension of oil palm plantations in Indonesia has encroached on land with a slope of more than 15%, which impacts the possibility of erosion and landslides. However, conservation efforts to reduce erosion are yet to be fully established. Therefore, the present work studies the effect of biopores infiltration holes on erosion at oil palm plantations area with land slopes greater than 15%. Besides, surface runoff with erosion is modeled to find the relationship. The method used in this study is to combine mechanical conservation methods in the form of biopores infiltration holes in an area that already has cover crops, such as Mucuna Bracteata. Two experimental plots were designed, namely (i) plots without biopores infiltration holes and (ii) plots with biopores infiltration holes. The results showed that soil erodibility in the oil palm plantations area was of a high of 0.65. Applying biopores infiltration holes in the field reduced surface runoff and erosion rates by 31.81% and 29.66%, respectively. The relationship of surface runoff with erosion rates on the land shows a very close case where the coefficient of determination in each plot is 0.96 and 0.92.
Aceh, appropriate technology, conservation, sloping land, erosion rates, surface runoff
The expansion of oil palm plantations area increases rapidly from year to year. Technically, increasingly extensive oil palm plantations will impact erosion that occurs mainly on land with a high slope. Based on data from the Central Statistics Agency (BPS 2018) on statistics on oil palm in Indonesia, the area is 12.76 million ha. It is estimated that more than 30% of the land area is on sloping land of more than 15%. Besides, oil palm cultivation that does not prioritize environmental aspects (absence of soil conservation) can increase land damage due to the amount of erosion and the use of agricultural machinery, which becomes difficult to apply [1].
Erosion can be caused by rain, topography, soil characteristics, and land uses. Rainfall factors dominate erosion in tropical climates [2, 3]. Erosion is caused by the intensity of rain in tropical climates higher than those in subtropical climates. It is in line with the results of research by Saragih et al. [4], who reported that an increase in rainfall intensity would increase the chance of erosion.
Efforts that can be implemented to reduce erosion in oil palm plantations area are conservation. Conservation can be divided into mechanical conservation, biological conservation, and chemical conservation [5]. Factors that can be modified to reduce erosion are cover crops and mechanical conservation applications [6]. Cover crops play an important role in holding rainwater not directly to hit the soil surface. One of the conservation efforts that can be carried out in oil palm plantations is making terraces, planting cover crops, and use of compost [7-10]. he conservation method aims to reduce surface runoff and reduce the kinetic energy of raindrops.
The implications of various conservation methods in oil palm plantations are very little investigated. Consequently, the effectiveness of the application of conservation methods in oil palm plantations is yet to be fully established, which causes difficulties in making conservation decisions. Research from Tohiran et al. [11] reported using livestock to maintain the cover crop population as a conservation effort in oil palm plantations. However, this study did not examine its effects on the erosion caused. Other studies report that soil erosion and sedimentation can increase due to logging and reduced vegetation in oil palm plantations [12, 13]. However, the study did not detail the amount of erosion that occurred.
The popular conservation of mechanics today is biopores infiltration holes applications. Several studies have shown that the use of biopores infiltration holes can reduce surface runoff and erosion rates [14-16]. On the one hand, information on applying biopores infiltration holes in oil palm plantations is essential for its effectiveness. This is useful for decision-making in oil palm plantations to conserve their plantation land. On the other hand, its application has not been investigated in depth for palm oil plantation areas. Therefore, the present work studies identified and analyzed the effectiveness of mechanical conservation of erosion in the oil palm plantation area. Mechanical conservation that will be investigated is the effect of biopores infiltration holes with land-covered plants in the oil palm plantations area.
2.1 Research sites
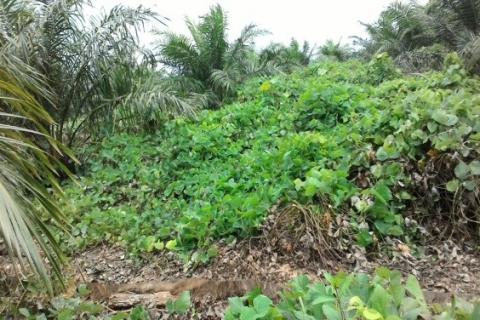
The study was conducted in oil palm plantations smallholder farmers located at coordinates 97˚54´57.100 "BT and 2˚46'37.300" LU. The sloping land of the experimental plot in this study was below 15%. The age of the oil palm plant at the investigation site is four until five years, with a plant spacing of 9.0 - 8.0 m. Mucuna Bracteata as a cover crop has grown on the experimental plot. The height of Mucuna Bracteata reaches 30-40 cm from the soil surface (Figure 1).
Figure 1. Conditions of the research experimental plots
2.2 Characteristics of experimental plots
The experimental field consists of two plots viz. (i) plots that have Mucuna Bracteata as a cover crop without biopores infiltration holes and (ii) plots that have Mucuna Bracteata as a cover crop with biopores infiltration holes. The dimensions of the experimental plot used in this study were 18 m ´ 8 m. Six biopores infiltration holes with a diameter of 10 cm were made in each experimental plot. The distribution of biopores infiltration holes in this study was carried out with three holes in one row, and there were two lines in one test plot. The biopores infiltration hole is filled with compost made from oil palm empty fruit bunches of 1000 g per biopores hole. The slope of the experimental plot is 27.78%. At the bottom of the experimental plot is placed a reservoir with 50 liters to accommodate runoff and erosion during rain. Ombrometer is placed on the side of the experiment plot. The measuring of the physical characteristics of the experimental plots is presented in Table 1. Permeability in this research measuring using the falling head permeability test method. The study was conducted from January 15, 2017, until April 10, 2017. Direct rainfall measurements and measurements of erosion rates were obtained 30 times.
Table 1. Characteristics of the experimental plots
|
Properties of soil on site |
Value |
Units |
|
Permeability |
2.26 |
cm/hr |
|
Soil structure |
Granular |
- |
|
C-organic |
1.32 |
% |
|
Soil texture |
Clay |
- |
|
Silt fraction |
46 |
% |
|
Sand fraction |
33 |
% |
|
Clay fraction |
21 |
% |
|
Plant management coefficient (C) |
0.16 |
- |
|
Soil conservation coefficient (P) |
0.1 |
- |
2.3 Surface runoff and erosion in the experimental plots
The volume of surface runoff is measured at each rain event for each plot. Runoff volume and soil weight collected are then analyzed using Equations 1 and 2, used by several researchers [6, 17, 18].
$V=(h \times A)-\frac{B T_{W}}{B D}$ (1)
$E=\frac{B T_{F} \times B T_{D}}{B T_{S}}$ (2)
where: V-runoff volume (cm3), h-level of water in the reservoir (cm), A-area of container (cm2), BTW-weight of wet soil (g), BD-bulk density (g·cm-3), E-erosion rate (kg/plot), BTF-dry erosion soil sample weight (g), BTS- Initial weight of soil erosion sample (g), BTD-the weight of the erosion soil that has settled and dried for 24 hours (g).
2.4 Estimating the erosion using USLE method
The USLE method is used to estimate the amount of erosion that occurs. It aims to form an empirical mathematical model for evaluating the erosion rate that occurs in oil palm plantations. The model comparison and direct measurement are then evaluated with the coefficient of determination (R2). The total erosion rates (loss of soil per unit area) can be calculated using Eq. (3).
$A=R_{D} \times K \times L \times S \times C \times P$ (3)
$R_{D}=\frac{2.467 \times\left(P_{D}\right)^{2}}{0.02727 \times\left(P_{D}\right)+0.725}$ (4)
$100 K=1.292 \times\left[\begin{array}{l}\left(2.1 \times M^{1.14} \times 10^{-4} \times(12-a)\right)+ \\ (3.25 \times(b-2))+(2.5 \times(c-3))\end{array}\right]$ (5)
where, A-amount of land loss per unit area of land (ton·ha-1·year-1), RD-erosivity factor of rainfall, K-soil erodibility factor, L-slope length (cm), S-slope factor, C-crop management factors, P-soil conservation practice factors, PD- daily rainfall (mm), M-percentage of particle size (%), a-percentage organic material (%), b-soil structure, c-soil permeability.
3.1 Erosivity and erodibility
Erosivity is determined using total rainfall data for 24 hours without calculating the maximum rainfall intensity. Erosion rates were calculated using Eq. (5) and presented in Figure 2. Total rainfall during the observation was 779.4 mm, with an average of 25.98 mm. The highest rainfall is 127 mm, and the lowest is 1.8 mm. The highest erosion was 371.41 with 127 mm rainfall, and the lowest erosivity was 0.11 with 1.8 mm rainfall. In this case, erosivity is directly proportional to the high rainfall. It is caused by the high kinetic energy of the rain when it hits the ground surface, causing the soil to splash and transport to a lower place. Results of laboratory analysis of parameters of soil characteristics such as soil texture, soil aggregate stability, infiltration capacity, organic content, and soil chemistry obtained erodibility in the land 0.65 (calculated using the Eq. (5)). Erodibility value is included in the high category, according to Hardiyatmo [5].
In this study, we find that an erodibility of 0.65 is in the high category. According to a research Paper [19], soil permeability in the area is included in the slow to the middle class (2.26 cm/hr). The high value of erodibility causes the soil to be spattered easily and will increase the amount of soil moved to a lower place so that the erosion will be increasing. It follows the research results of Utomo [20], which states that increasing the erodibility value makes it easier for the soil to be eroded. In other research, Asdak [21] declares that the level of erodibility is determined by soil characteristics such as soil texture, soil stability and aggregate, infiltration capacity, organic content, and soil chemical content. The soil characteristics are dynamic, which can change with changes in time and land use.
Figure 2. Relationship of erosivity with rainfall and erosion rates prediction of USLE method
3.2 Surface runoff in the experimental plots
The measurement results in both experimental plots show that the application of biopores infiltration holes decreases surface runoff (Figure 3). Application of biopores infiltration holes can reduce runoff up to 31.81%. Biopores infiltration holes because they can hold water before flowing on the soil surface. This phenomenon is in line with some research who reported that the ability of the soil to absorb water could be increased when using biopores infiltration holes [6, 22, 23].
Figure 3. Rainfall and surface runoff on experimental plots
Surface runoff that occurs in plots without biopores infiltration holes is presented in Figure 3. Rainfall that causes surface runoff is 25 events, and five rainfall events do not generate runoff. The total runoff that occurred was 0.784 mm (105.93 l/plot). The highest surface runoff occurred on January 20 of 0.125 mm, and the lowest occurred on March 1 of 0.005 mm. The increase in rainfall is not in line with the increase in surface runoff that arises. It is caused by several factors such as the rain interval, the amount of surface runoff on the previous day, the intensity of the rain, and the duration of the rain.
The surface runoff in the experimental plot using biopores infiltration holes is presented in Figure 3. The availability of biopores infiltration holes makes the surface runoff in this plot always smaller than the other experimental plots. It's because the biopores infiltration holes will function as a reservoir and infiltration of rainwater. Besides, the Mucuna Bracteata also has a role in slowing the surface runoff velocity.
The effect of the rainfall interval on surface runoff can be seen in the March 8 rain event with a rainfall of 5 mm, which causes surface runoff of 0.013 mm. But on March 9 (rainfall is the same as March 8) it was able to produce more significant surface runoff of 0.022 mm. It is caused by the March 8 rainfall interval occurring three days before, and March 9 occurred one day earlier. The rain interval will have an impact on the water content in the soil. Soil that has a higher water content when it rainfall will cause more surface runoff than land that has lower water content. It is caused by the soil having higher water content will absorb lower water and not infiltrated water will surface runoff (and vice versa).
The influence of the magnitude of surface runoff on previous events on subsequent surface runoff events can be seen on March 8 and 9 which have the same rainfall (7.0 mm) but have a different surface runoff. A surface runoff causes it on March 8 occurred three days earlier so that the pores of the soil are still filled with air so that rainfall is easily infiltrated. Meanwhile, on March 9, the soil was yet filled with water due to surface runoff one day before, so that rainfall in this incident was difficult to infiltrate.
Surface runoff does not occur in rainfall less than 5 mm even though there was a significant surface runoff on the previous day. It can be seen in the rainfall on 8 February (3.5 mm rainfall), which did not occur surface runoff because of the occurrence of rainfall that can be infiltrated. The effect of rainfall intensity and duration can be seen on February 16 (14.2 mm rainfall, the maximum intensity of 4.11 mm/hr). The period of rainfall at that time was 8 hours. The surface runoff that occurs is still smaller than the surface runoff on March 16 (rainfall 9.5 mm, the maximum intensity of 9.5 mm/hr), with the duration of rainfall events being one hour. It is caused by high rainfall intensity causing the soil pores to fill quickly to be saturated. According to Lathifah and Yunianto [24], the high value of surface runoff is also caused by sloping land factors and types of cover crops.
Rainfall intervals, rainfall intensity, duration of the rainfall, and previous surface runoff affect subsequent surface runoff even though biopores infiltration holes have been given. This experimental plot's highest and lowest surface runoff was 0.089 mm (January 20), 0.002 mm (March 1), respectively. The total surface runoff was 0.542 mm. Rainfall smaller than or equal to 5 mm does not cause surface runoff in this experimental plot.
The difference in the rainfall interval will affect the amount of water in the soil biopores. The porosity of the soil, which tends to be saturated, can cause more significant surface runoff. The phenomenon occurred on March 8 and 9, with the same rainfall (7.0 mm) but produced different surface runoff 0.003 mm and 0.021 mm, respectively. It is influenced by the previous rainfall interval that occurred three days ago for a surface runoff on March 8 and one day earlier for a surface runoff on March 9.
The intensity and duration of rainfall can cause differences in the amount of surface runoff. It can be seen in the occurrence of surface runoff on February 16, and March 16 with the intensity of rainfall, each of which is 4.11 mm/hr, 9.5 mm/hr, and the duration of rain is eight hours, one hour, respectively. The intensity and time of the rainfall caused a difference in the surface runoff of 0.014 mm.
3.3 Erosion rates in the experimental plot
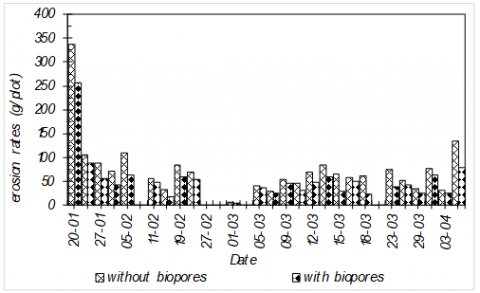
The erosion rates in the two experimental plots are presented in Figure 4. In general, the erosion rates in the experimental plot by application of biopores infiltration holes are lower than without using biopores infiltration holes. The reduction in erosion rates using biopores infiltration holes was 29.66%. It decreases is caused by the biopores infiltration holes that can accommodate the mass of the soil so that the soil carried by rainwater can settle in the biopores infiltration holes. Besides, the low erosion rates are caused by the low surface runoff in plots using biopores infiltration holes.
The erosion rates that occur without biopores infiltration holes are presented in Figure 5. A total of 25 rainfall events causes erosion rates, and five rainfall events do not cause erosion rates in test plots without biopores infiltration holes. The total erosion rates in this plot are 1892.92 g/plot, with an average erosion rate of 75.17 g/plot. The lowest erosion rates occurred on March 1, which amounted to 7.27 g/plot and the highest erosion rates occurred on January 20, which amounted to 337.67 g/plot.
Figure 4. Comparison of erosion rates with biopores infiltration holes applications
Figure 5. The rate of erosion without biopores absorption holes
Figure 6. The rate of erosion with the application of biopores infiltration holes
The erosion rates in the experimental plot using the biopores infiltration holes are presented in Figure 6. The total erosion rates in the experimental plot are 1330.79 g/plot, with an average erosion rate of 53.23 g/plot. Erosion occurred in this plot is 25 times. The largest erosion rate occurred in 127 mm rainfall is 258.28 g/plot, and the lowest erosion rate is 4.00 g/plot with 5 mm rainfall.
High rainfall does not always cause high erosion too. For example, on April 1, a rainfall of 24.5 mm caused more significant erosion (64.17 g/plot) than on May 23 of 50.5 mm (39.20 g/plot). Different rainfall intensities and rainfall duration cause the difference in erosion rates. On April 1, the maximum rainfall intensity was 14.07 mm, with a period of four hours of rainfall. However, on May 23, the maximum rainfall intensity was 10.20 mm, with a rainfall duration of 12 hours.
The total erosion rate is not always in line with the total rainfall. However, rainfall intensity and rainfall duration play a crucial role in causing erosion. High rainfall intensity causes the soil to be carried faster to lower places because a lot of rainwater cannot enter the soil directly. It causes rainwater that flows on the land's surface to have more considerable kinetic energy to move the soil that has been splashed. Low rainfall intensity, even though it has a long rain duration, will cause the soil to have enough time to infiltrate water into the soil so that the surface runoff kinetic energy is also less to move the soil. For example, rainfall of 51.3 mm causes lower surface erosion than rainfall of 24.5 mm, i.e., 70.59 g/plot, 78.26 g/plot, respectively. The same rainfall intensity also caused different amounts of erosion as in the erosion event on April 8 (erosion that occurred at 29.86 g/plot) and erosion on April 9 (55.44 g/plot). Rainfall event on April 8, the highest rainfall intensity was 4.82 mm with two hours of rain. However, on April 9, the highest rainfall intensity was 7.00 mm, with a duration of one hour.
The difference between erosion rates of the USLE model with the actual erosion rates is in the range of 0.01 - 4.91 kg/ha, where the actual erosion rates are higher than the erosion rates of the USLE model. The high actual erosion rates are caused by varying soil permeability due to rainfall intensity and duration of rain. The USLE model does not predict it, so there is a difference in the predicted erosion rates. Besides, not all rain causes erosion because it can be absorbed before surface runoff occurs. It also proves that the USLE erosion rates model is not appropriate for predicting erosion rates in different rainfall and sloping land more significant than 20%. Asdak [21] explained that the USLE erosion rates model is better used on sloping land of 3.0 -20.0%.
3.4 Relationship of erosion rates experiment and the USLE method
A comparison of the actual erosion rates and the estimation of the USLE method was carried out to determine the accuracy of the USLE model in predicting the erosion rates at this study site. The relationship is presented in Figure 7, with a coefficient of determination of 81.38%. The coefficient of determination value is obtained by plotting the erosion rates of experiment data with erosion rates from USLE. The error of each data between the measurement and the estimate is then compared to get a total error value. Next, a predictive certainty value of one will be compared with the total error value. The sloping land from plots is known to be 27.78% (steep with hilly relief). The combined value of the LS factor is 4.8, crops management value (C) is 0.16, soil conservation value (P) is 0.1, and CP factor value is 0.016. The highest erosion rates occur at the highest erosivity equal to 18.54 kg/ha, and the lowest is at 0.01 kg/ha at erosivity 0.11. Total erosion in the study site was 57.98 kg/ha.
Figure 7. Relationship of erosion rates experiment with USLE erosion rates method
3.5 Relationship of surface runoff and erosion rate
Figure 8. Relationship of surface runoff with erosion rates
Surface runoff is one of the causes of erosion because of its an essential factor in moving soil particles that have been destroyed by rainwater. Besides, the sloping land at the location of the investigation makes the surface runoff velocity and volume increase. This phenomenon is in line with the results of the research of Utomo [20], which states that an increase in runoff volume will impact decreasing infiltration time so that the resulting erosion is more significant.
The model of the relationship of surface runoff to erosion rates in both plots is presented in Figure 8. The results show that surface runoff and erosion rates have a close relationship on both plots, with a determination coefficient of 96.15% (without biopores) and 92.74 % (with biopores), respectively. However, plots without biopores infiltration holes have more considerable surface runoff than plots that use biopores infiltration holes.
The soil mechanical properties in the oil palm plantation area at the site of this investigation show high erodibility to allow the land to erode easily. The use of biopores infiltration holes provides minor erosion by 29.66% and can decrease runoff by 31.81% compared to land without biopores infiltration holes. Surface runoff and erosion rates have a close relationship in the two experimental plots of 96.15% (without biopores) and 92.74% (with biopores), respectively. This study suggests using biopores infiltration holes in oil palm plantation areas with a sloping land of up to 27.78% to reduce the impact of erosion. The next work of this research is to conduct an erosion prediction model on oil palm plantations on land slopes greater than 30.0% on a broader scale.
[1] Cebro, I.S., Sitorus, A. (2019). Performance evaluation of a hand tractor to climbing sloping land. International Journal of Scientific & Technology Research, 8(8): 781-786.
[2] Turkelboom, F., Poesen, J., Trébuil, G. (2008). The multiple land degradation effects caused by land-use intensification in tropical steeplands: A catchment study from northern Thailand. Catena, 75(1): 102-116. http://dx.doi.org/10.1016/j.catena.2008.04.012
[3] Ochoa, P., Fries, A., Mejía, D., Burneo, J., Ruíz-Sinoga, J., Cerdà, A. (2016). Effects of climate, land cover and topography on soil erosion risk in a semiarid basin of the Andes. Catena, 140: 31-42. http://dx.doi.org/10.1016/j.catena.2016.01.011
[4] Saragih, A., Wiwik, Y.W., Wahyuni, S. (2014). Pengaruh Intensitas Hujan dan Kemiringan Lereng Terhadap Laju Kehilangan Tanah Menggunakan Alat Rainfall Simulator. Journal Universitas Jember, 1(1): 1-8.
[5] Hardiyatmo, H.C. (2006). Penanganan tanah longsor dan erosi: Gadjah Mada University Press.
[6] Devianti, Jayanti, D.S., Sartika, D.T. (2019). Analysis of surface runoff at oil palm plantation areas from the uses of bio-pore infiltration holes (BIH). International Journal of Scientific & Technology Research, 8(8): 1-10.
[7] Moradi, A., Teh Boon Sung, C., Goh, K.J., Husni Mohd Hanif, A., Fauziah Ishak, C. (2015). Effect of four soil and water conservation practices on soil physical processes in a non-terraced oil palm plantation. Soil and Tillage Research, 145(1): 62-71. http://dx.doi.org/10.1016/j.still.2014.08.005
[8] Bulan, R., Yasar, M., Yudinata, Sitorus, A. (2019). Design and construction of chopper machine AE02-Type for oil palm frond. INMATEH-Agricultural Engineering, 57(1): 165-172.
[9] Bulan, R., Raju, Yasar, M., Sitorus, A. (2019). Model of mechanization implementation on the handling of oil palm fronds (OPF) waste into compost and mulch in Aceh Province, Indonesia. presented at the IOP Conference Series: Earth and Environmental Science, 2019. http://dx.doi.org/10.1088/1755-1315/260/1/012034
[10] Dhandapani, S., Ritz, K., Evers, S., Sjögersten, S. (2019). Environmental impacts as affected by different oil palm cropping systems in tropical peatlands. Agriculture, Ecosystems & Environment, 276: 8-20. http://dx.doi.org/10.1016/j.agee.2019.02.012
[11] Tohiran, K.A., Nobilly, F., Zulkifli, R., Ashton-Butt, A., Azhar, B. (2019). Cattle-grazing in oil palm plantations sustainably controls understory vegetation. Agriculture, Ecosystems & Environment, 278(1): 54-60. http://dx.doi.org/10.1016/j.agee.2019.03.021
[12] Hartemink, A.E. (2005). Plantation agriculture in the tropics: environmental issues. Outlook on AGRICULTURE, 34(1): 11-21. http://dx.doi.org/10.5367/0000000053295150
[13] Mercer, E.V., Mercer, T.G., Sayok, A.K. (2014). Effects of forest conversions to oil palm plantations on freshwater macroinvertebrates: A case study from Sarawak, Malaysia. Journal of Land Use Science, 9(3): 260-277. http://dx.doi.org/10.1080/1747423X.2013.786149
[14] Nespoulous, J., Merino-Martín, L., Monnier, Y., Bouchet, D.C., Ramel, M., Dombey, R., Viennois, G., Mao, Z., Zhang, J.L., Cao, K.F., Le Bissonnais, Y., Sidle, R.C., Stokes, A. (2019). Tropical forest structure and understorey determine subsurface flow through biopores formed by plant roots. CATENA, 181(1): 104061. http://dx.doi.org/10.1016/j.catena.2019.05.007
[15] Schneider, A.K., Hohenbrink, T.L., Reck, A., Zangerlé, A., Schröder, B., Zehe, E., van Schaik, L. (2018). Variability of earthworm-induced biopores and their hydrological effectiveness in space and time. Pedobiologia, 71(1): 8-19. http://dx.doi.org/10.1016/j.pedobi.2018.09.001
[16] Li, T., Shao, M.A., Jia, Y., Jia, X., Huang, L. (2018). Small-scale observation on the effects of the burrowing activities of mole crickets on soil erosion and hydrologic processes. Agriculture, Ecosystems & Environment, 261(1): 136-143. http://dx.doi.org/10.1016/j.agee.2018.04.010
[17] Reitz, M. Sanford, W.E. (2019). Estimating quick-flow runoff at the monthly timescale for the conterminous United States. Journal of Hydrology, 573(1): 841-854. http://dx.doi.org/10.1016/j.jhydrol.2019.04.010
[18] Khosh Bin Ghomash, S., Caviedes-Voullieme, D., Hinz, C. (2019). Effects of erosion-induced changes to topography on runoff dynamics. Journal of Hydrology, 573(1): 811-828. http://dx.doi.org/10.1016/j.jhydrol.2019.04.018
[19] Rusdi, M., Roosli, R., Ahamad, M.S.S. (2015). Land evaluation suitability for settlement based on soil permeability, topography and geology ten years after tsunami in Banda Aceh, Indonesia. The Egyptian Journal of Remote Sensing and Space Science, 18(2): 207-215. http://dx.doi.org/10.1016/j.ejrs.2015.04.002
[20] Utomo, W.H. (1994). Erosi dan konservasi tanah: Rajawali Pers, 1994.
[21] Asdak, C. (2018). Hidrologi dan pengelolaan daerah aliran sungai: Gadjah Mada University Press.
[22] Santosa, S. (2018). Effect of fruits waste in biopore infiltration hole toward the effectiveness of water infiltration rate on baraya campus land of Hasanuddin University. presented at the Journal of Physics: Conference Series, 979(1): 012037. http://dx.doi.org/10.1088/1742-6596/979/1/012037
[23] Yulia, Nurzal, E. (2019). The study of area infiltration rate by using biopori holes as an effort to reduce water level and groundwater conservation. Presented at the IOP Conference Series: Materials Science and Engineering, 506: 012030. http://dx.doi.org/10.1088/1757-899X/506/1/012030
[24] Lathifah, D.H., Yunianto, T. (2013). Hubungan antara Fungsi Tutupan Vegetasi dan Tingkat Erosi DAS Secang Kabupaten Kulonprogo. Jurnal Bumi Indonesia, 2(1).