Khalideh Al Bkoor Alrawashdeh* | La' al A. Al-Samrraie | Huthaifa Ahmad Al Issa | Isam Qasem | Ahmed A. Hussien | Kamel K. Al-Zboon | Rebhi A. Damseh | Eid Gul
© 2022 IIETA. This article is published by IIETA and is licensed under the CC BY 4.0 license (http://creativecommons.org/licenses/by/4.0/).
OPEN ACCESS
Olive mill wastewater (OMW) has a high impact the environment. OMW has a high organic load, as well as high hazardous properties and low biodegradability. This necessitates the development and optimization of innovative treatment technologies. The classic Fenton's process (FP), which acts under environmental circumstances, offers an interesting option. The focus of this research is to investigate the FP (at various H2O2 concentrations and Fe+2/H2O2 ratios) influences OMW's anaerobic digestion (AD). The results revealed that the higher removal efficiency of TCOD, BOD5, and polyphenols was achieved at FP-2-2 (2 g/kgVS of H2O2 concentrations and a ratio of 0.006 of Fe+2/H2O2 (w/w)), which attained higher biogas yield (0.311 Nm3/kgVS) and CH4 content (68.3%). The particle swarm optimization (PSO) algorithm was developed to model and optimize biogas and CH4 production by detecting the optimal TCOD, BOD5, and polyphenol reduction by implementing various FPs. According to the PSO model, the optimum values of H2O2 and Fe+2/ H2O2 ratio were 2.0256 g/kgVS and 0.00608 for maximum removal efficiency of TCOD, 2.0019 g/kgVS for maximum removal efficiency of BOD5, and 2.0679 g/kgVS for maximum removal efficiency of polyphenols. Also, the curve fitting cftool was used by the MATLAB program to predict the biogas production at a different dose of FP. The result of fitting showed a good agreement between actual and predicted results.
anaerobic digestion, Fenton process, olive mill wastewater, PSO algorithm, VS, TCOD reduction, Fe+2/H2O2 ratio
Olive mill wastewater (OMW) biowaste is a promising biogas source [1-4]. The anaerobic digestion (AD) process is regarded as a promising technique for eliminating biowaste accumulation [5-8]. Additionally, the characteristics of the OMW components necessitated a short residence time for high performance degradation, which ranged from 14 to 40 days [3, 9], with volatile solids (VS) reduction accounting for 32% of total solids (TS) [1, 3]. Most recent investigations have reported that the OMW AD process has several limitations as a result of the presence of toxic compounds, necessitating the use of an OMW substrate for pre-treatment before performing the AD process [1, 4]. The pretreatment of OMW improves biogas production and process stability during the AD process [10, 11]. The pretreatment of OMW improves the microorganism metabolism and growth, which is critical for decreasing the organic load (OL) and converting it into methane (CH4), carbon dioxide (CO2,) and a small portion of CO, H2, through sequential processes [2, 7, 11]. Pretreatments include the aerobic process [1], the thermal process [4, 12], increasing or removing some heavy metals [2, 7, 11], enzymatic process, microwave-absorbing [13], alkaline pretreatment [14], using free nitrous acid [12, 15], and Fenton process [15-17].
The Fenton process (FP) is an oxidation reaction that generates hydroxyl radicals by catalyzing the decomposition of H2O2 with iron ions Fe+, where iron ions act as catalysts for the generation of free radicals like OH- [16, 18], according to the Eq. (1) and (2) [19, 20].
Fe2+ + H2O2 → Fe3+ + HO− + HO (1)
Fe2+ + HO → Fe3+ + HO− (2)
H2O2 + HO → H2O + HO2 (3)
These above reactions scavenge Fenton's main oxidant, which might reduce the effectiveness of the process. To prevent the scavenging effect, the H2O2/Fe2+ ratio needs to be properly selected [15]. Lucas and Peres [21] studied the effects of temperature, pH, H2O2/COD weight ratio, and H2O2/Fe2+ molar ratio on OMW- Fenton's peroxidation. The results showed that the optimum COD removal at H2O2/COD = 1.75 (w/w), H2O2/Fe2+ = 15 (mole/mole), T= 30℃, and pH= 3.5. Also, they identified the Arrhenius constant, which was about 28.2 kJ/mol.
As a result, this technique has potential for full-scale use since it occurs at ambient conditions [18] and requires no specialized equipment [20]. Furthermore, H2O2 has no environmental or safety risks. As a result, numerous researches have been conducted on the applicability of this method to wastewater treatment [22-24]. This suggests that FP can improve the BOD5/COD ratio in the effluent, hinting that this chemical process can be followed by a biological system. If the pre-treated OMW meets the regulatory limitations for local sewage treatment, it can be transported to the municipal sewerage system for ultimate depuration.
After cationic polyelectrolyte coagulation and acid cracking, Gomec et al. [25] found that the FP for OMW at 2000 mg/L H2O2 and Fe2+ improved COD reduction, and they obtained that the COD removal reached 89%. Furthermore, Rivas et al. [26] obtained that the stoichiometric ratio of 3 H2O2 / COD removed or basis mol/mol. FP has been shown to remove COD slightly while degrading a significant polyphenolic percentage, resulting in an effluent that biological systems may depurate [15]. Mert et al. [27] investigated the reduction of COD and total phenols using the acid cracking process, as well as the influence of FP on OMW degradation, and observed that acid cracking removed more than 67% of COD and about 72% of total phenols, whereas FP (H2O2 = 3500 mg/L, and FeSO4= 3000 mg/L) removed 81% TCOD and 86% T-Phenols.
According to Maamir et al. [28], exposing OMW to FP (H2O2/Fe2+ = 1000 mol/mol, Fe2+ = 1.5 mM) increased CH4 production by up to 24%. Furthermore, when the FP-OMW was employed without dissolved iron, the highest CH4 production of 63% was achieved after 30 days of the AD process, and the biogas yield was lower. This was attributed to the oxidation process producing hazardous by-products. Esteves et al. [29] used a continuous stirred tank reactor to demonstrate the stability of the FP - OMW in continuous conditions for the degradation of a mixture of phenolic content. Total organic carbon reduction and phenolic content reductions were 47.5% and 96.9%, respectively, with Fe2+ = 100 ppm, H2O2= 2.0 g/L, and T = 30℃ and residence time of 120 minutes. Furthermore, there was a significant reduction in toxicity as well as an increase in biodegradability.
Reis et al. [30] investigated the conjunction of ion exchange and FP of OMW to recover iron in order to avoid the shortcoming related to iron substrate synthesis. They found that FP was able to remove up to 81 percent COD in 60 minutes at pH 3.5, Fe2+ = 50 mg/L, and Fe2+/H2O2 = 0.002 (w/w). Additionally, even with significant levels of dissolved iron, the ion exchange running parameters may be adjusted to retain the appropriate iron removal performance. As a result, this sequential treatment appears to be a promising strategy for avoiding the development of iron sludge following FP.
The particle swarm optimization (PSO) algorithm is a strong modeling approach that may be used for estimating, modeling between analytical and statistical predicting, and making decisions [31]. It may also solve and depict complicated systems, such as the AD process, which has complex input-output interactions. Its benefit is the hidden layer's nonlinear sigmoid function, which, in comparison to linear regression, gives computational flexibility and appropriate estimation performance of the target variable [32]. PSO functions similarly to a genetic algorithm, but it's simpler to set up and has lower complexity to be adjusted [33]. PSO selection as an optimization technique has a strong motivation. PSO, like all other intuitive optimization techniques, seems to be a stimulus-free approach and is less susceptible to the complexity of optimal solutions than traditional mathematical procedures. Moreover, when compared to other optimization algorithms, PSO techniques can produce high-quality responses between short-term and steady computing conversion characteristics. In addition, the hybrid algorithm, such as artificial neural network-PSO, was examined and created in many situations with greater dependability, according to the authors' best assessments [32, 34-36].
This study aimed to investigate the FP influence on OMW digestion as a pretreatment step for improving the AD process. The main parameters of the AD; process stability, biogas production, methane content, and organic load reduction were obtained with various ratios of H2O2/ Fe+2 and H2O2 concentrations. Also, in this study, we optimized pretreatment conditions in the terms of H2O2 concentration and the Fe+2/ H2O2 ratio by using the PSO algorithm.
This study's contributions to meeting the goal are as follows: The experimental setup for pre-treatment then investigated the removal efficiency of TCOD, BOD5, and polyphenols. In the second stage of the experimental setup, AD tests were conducted and the biogas production was monitored and recorded to investigate the pre-treatment effect on the test results. creation of the PSO structure based on recorded data, as well as performance evaluation of the suggested PSO framework in order to acquire the best pre-treatment conditions. In addition, the PSO basis modeling and optimization method were created and presented in this work to forecast biogas production at any time for different H2O2 concentrations and the Fe+2/ H2O2 ratios.
2.1 Raw material
The OMW substrate was collected from an olive mill plant for three-phase oil extraction in December 2020. OMW was kept at 5°C until it was needed. OMW samples' substrates were prepared in accordance with UNI 5667-13/2000 for use in AD testing [1, 4, 5, 10]. To begin, the sample is combined on a surface and shaped into a cone. To ensure adequate distribution, it is advised that the material be dropped from the top of the cone during this phase. After that, the heap is evenly divided into quarters, and two of the quarters are chosen and merged. This process is continued until the final two quarters create the appropriate mass sample. The quartering approach was used in accordance with general recommendations (UNI EN ISO 5667-13: 2000 "Water Quality-Sample-Guide to the sampling of sludge from wastewater treatment operations") and modified for our case study, which had a total quantity of fresh organic waste of 20 kg at the start.
A thermogravimetric analyzer (TGA 701, LECO, St. Joseph, MI, USA) was used to acquire the proximate analysis [37-41] and physicochemical characteristics of samples. The analysis procedure was reported by Alrawashdeh et al. [1, 4, 39, 40]. After samples have been signed in and crucibles (empty) have been put into the sample carousel, the analysis may begin. The environment inside the furnace is controlled by one of three analytical gases (air, N2, or O2). Each process step has its own temperature ramp rate, temperature, environment, and time options. For N2 and air, the sample gas flush rate was 30 mL/minute. A simple software instruction prompted the gas swap from N2 to O2. The location of the crucibles above the balance stand, where sample weights are recorded, is continuously indexed. the humidity measured by the difference of the mass, TGA run at 10℃ /min to 105℃ to remove all moisture in the N2 atmosphere. To obtain the volatile solid (VS), the TGA was set to 550℃ for volatilization. After drying the samples in a nitrogen atmosphere for 10 min, the difference in mass was recorded as the VS content. After the volatiles were burned off, the covers were removed from the Crucibles, and the samples were warmed to 550℃ in an O2-rich atmosphere to get the ash. The fixed carbon (F.C), which was attained with O2, was the mass was reduced throughout the ashing process.
The inoculum was obtained from a mesophilic AD system [4, 39]. The proximate analysis comprises TS, VS humidity (U), fixed carbon (F.C), and AS measurements. These analyses were achieved as mentioned above and as outlined by Alrawashdeh et al. [1, 4]. Table 1 summarizes the characteristics of OMW and the inoculum substrate.
An atomic absorption spectrophotometer (OptimaTM 8000 ICP-OES) was used to measure Fe+ concentrations [11]. The total chemical oxygen demand (TCOD) and soluble chemical oxygen demand (SCOD) were determined using standard Alpha- standard for water and wastewater measurement. techniques [42]. Biopolymers (proteins and polysaccharides) were measured according to Hallaji et al. [16]. The dilutions approach was used to determine the biochemical oxygen demand (BOD5) [43]. The main characterizations of the OMW utilized in this investigation are shown in Table 2.
2.2 Experimental setup
2.2.1 FP preparation
Pretreatment of FPs was carried out in 2-liter reactors at a temperature of T=30℃ [21, 30]. The literature study was used to determine the prescribed H2O2 concentrations for the FP [18, 21, 30, 44, 45]. H2SO4 was used to modify the pH of OMW to 3.5 [21, 30, 45]. The iron catalyst (FeSO4) is then added, followed by the H2O2. According to Reis et al. [30], the pretreatment lasted 80 minutes to achieve maximal organic load bio-gradeability and solubilization. The Fe2+ to H2O2 ratio was adjusted to be in the range of 0.002 – 0.01 (w/w) with various concentrations of H2O2 (2-6 gH2O2 / kgVS).
2.2.2 Biochemical methane potential (BMP) tests
For BMP tests, 19 vessels with the capacity of 2 L were made of transparent PVC. The vessel is equipped with two necks; the main one is used to enter the feedstock and for pH adjustment and control, while the other is utilized to collect the produced biogas during BMP experiments [3-40]. The vessel is also equipped with a regulator to capture the samples and effluent. The matching gas volume was connected to each vessel. The tests were replicated, and the average of the findings was computed using the same tests. Two vessels were used as blanks (containing only the inoculum) and two vessels were utilized as controls (containing the substrate without any pretreatment). The occupied volume was 20% of the total capacity of the vessel, which was filled with OMW and inoculum (85%: 15% v/v) [1, 4].
The 15 BMP reactors were filled with 200 mL of the substrate, 170 mL of OMW, and 30 mL of inoculum, then were sealed with a stopper and a screw cover [1, 27]. Under mesophilic conditions, all reactors were linked to gas volumetric detection as reported in [10]. All reactors were immersed in a warm water bath at control temperature. The reactors were manually shaken twice per day for one minute throughout the AD testing. During BMP tests, the pH of the pre-treated OMW substrate was adjusted to the favorite value (7.0-7.5).
The designated concentrations for pre-treatments of OMW are reported in Table 3. The FPs were implemented in various ratios in step-wise mode: 0.002, 0.004, 0.006, 0.008, and 0.01 of Fe2+/H2O2(w/w). Each ratio was applied to a different ratio of H2O2: VS; 2, 4, and 6 (g/kgVS).
Biogas samples were extracted through a rubber stopper of the reactor with a gas-tight syringe of 250 lμ. A gas chromatograph was used to analyze the biogas samples (Agilent 490 Micro GC Biogas Analyzers, USA). The GC measures the concentration of CH4, CO2, CO, O2, and C2. It comprises a thermal detector and capillary column, with working temperatures of 80℃, 100℃, and 180℃ for the detector and column injector, respectively, and a flow rate of 10 ml/min for Ar and He.
Table 1. The characterization of OMW and inoculum
|
Substrate |
Moisture, U(%) |
Total Solide, TS (%) |
Volatile solids, VS (%) |
Ash (%) |
Fixed Carbone (%) |
pH |
|
OMW |
88.35±1.03 |
11.65±0.79 |
4.97±2.17 |
3.96±1.28 |
2.72±0.63 |
5.70±0.64 |
|
Inoculum |
97.85±2.16 |
2.15±0.53 |
0.84±1.06 |
1.31±1.35 |
0 |
6.44±2.33 |
Table 2. The main characteristics of OMW
|
Substrate |
TCOD (mg-1) |
BOD5 (mg-1) |
BOD5/TCOD |
Phenols (mg-1) |
Lignin (mg-1) |
|
OMW |
163,000 |
57,098 |
0.35 |
20,300 |
13,950 |
|
Inoculum |
420.33 |
300.2 |
0.714 |
216.44 |
6.31 |
Table 3. Designated concentrations for pre-treatments
|
H2O2 (g/kgVS) |
Fe+2(kg)/ H2O2(kg) |
FP# |
H2O2 (g/kgVS) |
Fe+2(kg)/ H2O2(kg) |
FP# |
H2O2 (g/kgVS) |
Fe+2(kg)/ H2O2(kg) |
FP# |
|
2 |
0.002 |
2-1 |
4 |
0.002 |
4-1 |
6 |
0.002 |
6-1 |
|
0.004 |
2-2 |
0.004 |
4-2 |
0.004 |
6-2 |
|||
|
0.006 |
2-3 |
0.006 |
4-3 |
0.006 |
6-3 |
|||
|
0.008 |
2-4 |
0.008 |
4-4 |
0.008 |
6-4 |
|||
|
0.01 |
2-5 |
0.01 |
4-5 |
0.01 |
6-4 |
2.2.3 Design of PSO algorithm
PSO is a well-known optimization method that was inspired by the frequent interactions of birdwatchers [46]. PSO has a faster convergence rate compared to other optimization methods, which allows it to be used in a wide range of study fields [34]. Every particle is released in this optimization method to adjust its ideal position across the search area while taking into account the positions of nearby particles. As a result, the particle finds the best-suited place on its own, leading to an optimum solution. A pre-specified fitness value is used to evaluate the efficiency of all particles. Every particle has a particular velocity at which it travels through space.
Despite the fact that bioreactors are supposed to operate under steady conditions, the process is vulnerable to large variations in both flow and load, resulting in performance decreases and lower biogas quality. As a result, optimizing biomethane output in the field under variable loads is extremely challenging. Modeling the process is a good idea since it helps you to track, regulate, and forecast how the system will behave even in temporary situations. The goal of this study was to compare and contrast several modeling methodologies for anaerobic digestion. Modeling the AD process may be done using a variety of mechanistic mathematical models. The key benefit of utilizing these models is that they aid in the development of a clear grasp of the dynamical systems [47-50]. In the field of AD, PSO was proven to produce the greatest outcomes when compared to other evolutionary approaches for optimizing feedstock for biogas plants [51]. The approach remained steady when a set of indicators were changed [47]. PSO has been used for the variable estimation model for modeling VFA, showing its added benefit of indirectly seeking the optimum solution in a multi- dimensional space without evolutionary algorithms [48].
In this study, PSO was utilized to obtain the most biogas in terms of quantity and quality. The PSO was used to assess kinetic parameters in steady and transient stages with restricted parameters in continuous and BMP tests, demonstrating the algorithm's efficacy in non-linear systems.
The main key parameters of BMP tests were investigated to obtain the optimization conditions of the AD process with pre-treatment. Fenton pre-treatment with different ratios and with different H2O2 concentrations was implemented on OMW substrate. The test period lasted 40 days until the biodegradability stability was achieved.
3.1 Effect of FP on TCOD, BOD5, and Polyphenol’s removal during the pretreatment process
3.1.1 Experimental investigation for removal efficiency of TCOD, BOD5, and Polyphenols
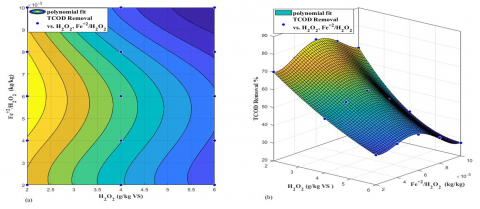
Figures 1.a, 1.b, and 1.c depict the effects of Fe2+/ H2O2 ratio and H2O2 concentration on TCOD, BOD5, and polyphenol removal efficiency. The concentration of H2O2 had a significant influence on hydroxyl radical production; thus, the higher the hydroxyl radical generation, the more mineralization happens. The concentration of H2O2 in the substrate is crucial for the anaerobic digestion process [46, 52-54].
Considering that the only way to mineralize an activated substance with H2O2 alone is by oblique oxidation of organics through hydroxyl radicals, H2O2 efficiency and concentration are critical. However, when FeO4 is used, a mechanism known as the Fenton reaction is activated. The findings suggest that as H2O2 concentrations increased (2 to 6 g/kgVS), a higher decrease was observed. For higher TCOD, a concentration of 2 g/kgVS of H2O2 was found to be optimal as shown in Figure 1. The hydroxyl radical concentration is fully reliant on two factors: Fe+2 and H2O2 concentrations (according to Eqns. (1) and (2)), according to studies [55-60]. The removal efficiency increased as the Fe+2 to H2O2 (w/w) ratio increased, but as the H2O2 to Fe+2 weight ratio increased, the removal efficiency dropped [50]. H2O2 self-decomposed at greater concentrations than the optimal value. Finally, the drop in COD removal could be related to the formation of H2O2 by the reaction of two hydroxyl radicals. The creation of HOO•, which has a substantially lower reactive characteristic than the hydroxyl radical, however, slows down the reaction rate [56].
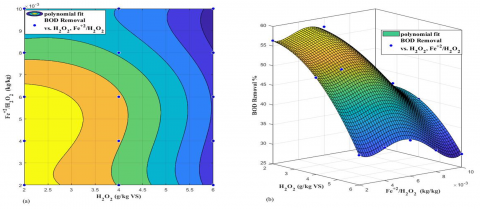
The performance of BOD5 was increased as the H2O2 concentration decreased. The optimum removal efficiency was achieved at 2 g/kgVS of H2O2 concentration and a Fe+2 H2O2 ratio of 0.006. After this ratio, the removal efficiency dramatically decreased. In general, the results showed an increase in BOD5/COD ratio for all tests but in variable values. Also, the increase in the value of the BOD5/COD ratio is possibly related to the compounds' high biodegradability when H2O2 is added gradually at the beginning, according to Guerreiro et al. [56].
a. Response contour (a) and response surface pot (b) for TCOD polyphenol removal efficiency at different dose of Fe2+/H2O2 ratio and H2O2
b. Response contour (a) and response surface pot (b) for BOD5 removal efficiency at different dose of Fe2+/H2O2 ratio and H2O2
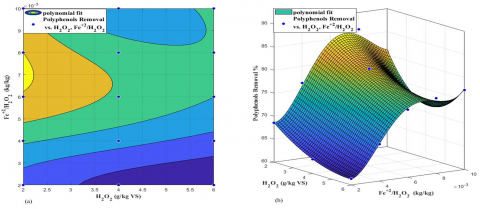
c. Response contour (a) and response surface pot (b) for polyphenol removal efficiency at different dose of Fe2+/H2O2 ratio and H2O2
Figure 1. Response contour and response surface for COD, BOD5 and polyphenols at different dose of Fe2+/H2O2 ratio and H2O2
Table 4. MATLAB results for the equations of the surface of FP pre-treatment conditions and optimum solutions
|
Response |
Polynomial fit |
R2 |
Adj.R2 |
SSE |
RMSE |
Optimum TCOD |
|
TCOD |
129.9 -20.4 *A -3.446e+04 *B +1.44 *A2 +4892 *A*B +1.044e+07 *B2 -523.4 *A2*B -7.267e+05 *A*B2 -1.169e+09 *B3 +6.172e+04 *A2*B2 +1.518e+07 *A*B3 +4.554e+10 *B4 |
0.9995 |
0.9978 |
1.844 |
0.784 |
A=2.0256 B=0.0060824 TCOD=79.4393 |
|
BOD |
63.93 +6.622 *A -1.409e+04 *B -1.418 *A2 -1417 *A*B +5.654e+06 *B2 +70.23 *A2*B +1.921e+05 *A*B2 -8.128e+08 *B3 -6384 *A2*B2 -3.828e+06 *A*B3 +3.545e+10 *B4 |
0.9985 |
0.9933 |
2.035 |
0.823 |
A=2.0019 B=0.0048563 BOD=58.2274 |
|
Polyphenols |
109.2-14.18 *A -3.016e+04 *B +1.39 *A2 +5925 *A*B +8.923e+06 *B2 -605.5 *A2*B -7.972e+05 *A*B2 -9.47e+08 *B3 +6.569e+04 *A2*B2 +1.852e+07 *A*B3 +3.529e+10*B4 |
0.982 |
0.9167 |
12.559 |
2.046 |
A= 2.0679 B= 0.0071059 Polyphenols = 85.6017 |
* A = H2O2, B= Fe+2 / H2O2
Considering that the only way to mineralize an activated substance with H2O2 alone is by oblique oxidation of organics through hydroxyl radicals, H2O2 efficiency and concentration are critical. However, when FeO4 is used, a mechanism known as the Fenton reaction is activated. The findings suggest that as H2O2 concentrations increased (2 to 6 g/kgVS), a higher decrease was observed. For higher TCOD, a concentration of 2 g/kgVS of H2O2 was found to be optimal as shown in Figure 1. The hydroxyl radical concentration is fully reliant on two factors: Fe+2 and H2O2 concentrations (according on Eqns. (1) and (2)), according to studies [55-60]. The removal efficiency increased as the Fe+2 to H2O2 (w/w) ratio increased, but as the H2O2 to Fe+2 weight ratio increased, the removal efficiency dropped [50]. H2O2 self-decomposed at greater concentrations than the optimal value. Finally, the drop in COD removal could be related to the formation of H2O2 by the reaction of two hydroxyl radicals. The creation of HOO•, which has a substantially lower reactive characteristic than the hydroxyl radical, however, slows down the reaction rate [56].
The performance of BOD5 was increased as the H2O2 concentration decreased. The optimum removal efficiency was achieved at 2 g/kgVS of H2O2 concentration and a Fe+2 H2O2 ratio of 0.006. After this ratio, the removal efficiency dramatically decreased. In general, the results showed an increase in BOD5/COD ratio for all tests but in variable values. Also, the increase in the value of the BOD5/COD ratio is possibly related to the compounds' high biodegradability when H2O2 is added gradually at the beginning, according to Guerreiro et al. [56].
The maximum polyphenols reduction was 83.03%, as shown in Figures 1.a, 1.b, and 1.c, and it was obtained after 80 min at 2 g/kgVS of H2O2 concentration and Fe2+/H2O2 ratio of 0.006. Polyphenol removal was shown to be more effective than TCOD and BOD5 conversion to soluble and degradable substances. Furthermore, it was demonstrated that appropriate active phase dosing is necessary to achieve the best responses: efficient and high phenol conversion with minimal side products and minimized catalyst degradation [55]. The elimination of polyphenols is obviously predicated on the polyphenols to H2O2 ratio. With 2 g/kgVS of H2O2 and an FT ratio of 0.008, the maximum conversion was achieved. The conversion dropped slightly after the 0.008 ratios [16].
3.1.2 Data analysis
The data was analyzed using design expert software and MATLAB analysis. The coefficient of determination (R2) was used to explain the correctness of the polynomial model (see Figures 1.a, 1.b, and 1.c). Surface plots (3 dimensions) and corresponding contour plots (2 dimensions) for TCOD, BOD5, and polyphenol removal efficiency were presented based on the effects of H2O2concentration and Fe2+/ H2O2 ratio in the actual data. For H2O2 concentration (second-order) and Fe2+/ H2O2 concentration (fourth-order), the surface equations (given in Table 4) contain polynomials with various powers (fourth-order).
Table 4 shows the variation in mean square error (MSE), adjust R2, R2, and sum square error (SSE) with respect to iteration. The model was extremely significant according to the statistical analysis. The lower the SSE and MSE, the higher the adjusted R2 and R2, indicating that the regression has superior estimating power.
To achieve the optimal parameter configuration for FP pre-treatment, the researchers strongly recommended utilizing an optimization approach. In this research, PSO was utilized to improve the FP pre-treatment parameters. The removal effectiveness for TCOD, BOD5, and polyphenols changed according to the findings in Figures 1. a, 1. b, and 1. c, as well as Table 4, which were obtained under various circumstances of two variables (H2O2 concentration and Fe2+/ H2O2 ratio) (increases and after optimum value decreases).
During the implementation of the PSO algorithm, several parameters of the PSO algorithm, such as swarm size (2000), the maximum number of iterations (1000), inertia coefficient (0.5), and a correction factor (0.1), initial velocity (zero) should be provided. As a result, the suggested PSO algorithm has been executed several times with various parameter values. The best removal efficiency and quick convergence for the PSO can be reached when the values of TCOD (79.4393%), BOD5 (58.2274%), and polyphenols (85.6017%) are (values from Table 4), respectively, based on repeated runs. Furthermore, the best values of H2O2 concentration and Fe2+/H2O2 ratio have been set as reported in Table 4.
3.2 Effect of FP on VS reduction during the AD process
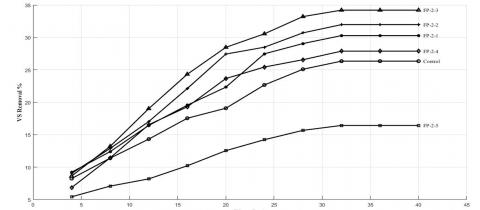
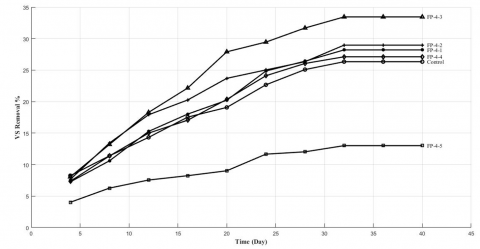
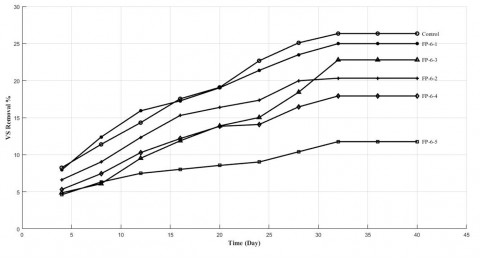
During the BMP tests, pH was measured and controlled to remain within a range of 7-7.5 for all tests. For all the tests, the VS removal efficiency was measured by extracting the sample during the tests. Figure 2 shows the tendency of the VS reduction under various ratios of Fe2+/H2O2 and various H2O2 concentrations. Whereas the removal efficiency behavior for 2 and 4 of H2O2 (g/kgVS) was identical, it was increased and reached its maximum efficiency at a ratio of 0.006 of Fe2+/H2O2 and then decreased dramatically. While at 6 of H2O2 (g/kgVS), the removal efficiency is characterized by an unsteady response due to unbalancing of the concentration. In general, the decrement in reduction during the test was associated with the test stability and a decrease in organic matter decomposition [2, 11, 39].
a. The VS removal efficiency during AD process with 2 of H2O2 (g/kgVS)
b. The VS removal efficiency during AD process with 4 of H2O2 (g/kgVS)
c. The VS removal efficiency during AD process with 6 of H2O2 (g/kgVS)
Figure 2. VS removal efficiency of AD tests at different dose of Fe2+/H2O2 ratio and H2O2
Figure 2.a, 2.b, and 2.c show that the test FP-2-3 of 2 H2O2 (g/kgVS) and the ratio of 0.006 of Fe2+/H2O2 had a greater VS removal efficiency of 34.2 percent, while the test FP-6-5 of 2 H2O2 (g/kgVS) and the ratio of 0.006 of Fe2+/H2O2 had the lowest efficiency of 0.006 of Fe2+/H2O2. However, in compared to the first days of the testing, the decreases after day 24 were sluggish. In general, the tests' behavior was trended toward a progressive decrease in TS and VS for the tests with increasing H2O2 concentrations, as illustrated in Figure 2. The tests with the lowest digestive efficiency were those with an H2O2 content of 6 (g/kgVS). Also, when the H2O2 concentration increased, the reduction reduced, with TS reductions ranging from 4.59% ± 2.28% (day 4) to 11.76% ± 1.34% (day 4) for the FT-6-5 digestion. However, when tests with concentration 6 of H2O2 (g/kgVS) are compared to control tests, the removal efficiency of tests with concentration 6 of H2O2 (g/kgVS) is 44.65% - 55.7% for VS and TS, respectively. At a higher concentration of H2O2, the microorganisms' metabolism and growth were limited, resulting in a reduction in organic load and also the AD process performance. Also, the removal efficiency decreases obviously at a ratio of 0.006 Fe2+/H2O2 (w/w) and decreases notably at the concentration of 6 of H2O2, a similar result was obtained by Hallaji et al. [16]. Hallaji et al. [16] study showed that the addition 2.5 of H2O2 (mg/gVS) led to increasing in biogas and methane production. The complete inhibition of methanogenesis resulted from high H2O2 concentrations ≥ 4 and Fe2+/H2O2 (w/w) ≥ 0.008. While the findings revealed that acidogenesis is less susceptible to environmental variables such as H2O2 concentrations and Fe2+/H2O2 concentrations [18].
3.3 Effect of FP on biogas production and methane contents
3.3.1 Experimental results
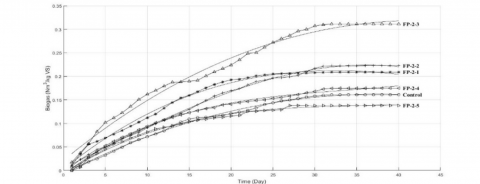
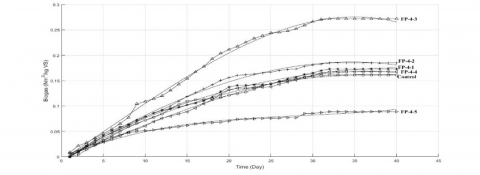
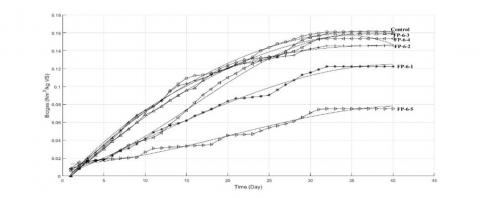
Figures 3, 4, and 5 show the comparison between the performance of the control substrate digestion and the pre-treated substrate digestion with different concentrations of H2O2 and Fe2+/H2O2 ratio in terms of the cumulative biogas. In comparison to control substrate digestion, no time lag for biogas production was noted at the start of pre-treated substrate fermentation. The biogas yield of 0.311, 0.272, 0.222, and 0209 Nm3/kgVS were achieved by the digestion of FP-2-3, FP-4-3, FP-2-2, and FP-2-1, respectively. However, an increase in biogas yields was observed for all pre-treated samples at H2O2 concentration ≤ 4 and Fe2+/H2O2 ≤ 0.008 in comparison to control samples.
As illustrated, the use of a high concentration of H2O2 in FP pre-treatment led to a decrease in the efficiency of the AD process. The maximum yield of biogas was observed at H2O2 concentrations of 2 (g/kgVS) with improving the fermentation performance (+93.17%), and it decreased significantly after concentrations of 4 (g/kgVS). The behavior of biogas production indicates that the increasing H2O2 concentration led to toxicity in the substrate and reduced digestive activity. These results are consistent with what is stated in Hallaji et al. [16] and Feki et al. [57]. Feki et al. [57] reported that during semi-continuous digestion of electrical Fenton-pre-treated sludge, biogas production was observed to increase. Compared to raw sludge, EF-pre-treated sludge generated the greatest biogas production (0.81 L/g VS) and the highest COD removal efficiency (96.6%).
Also, Figures 3-5 illustrate that the biogas yield was affected by the Fe2+/H2O2 ratio, and the ratio of Fe2+/H2O2 (w/w) ≤ 0.008 improves biogas production but at a specific concentration of H2O2. The results revealed that biogas generation was related to the rate and quality of organic load decomposition components. For all tests, greater biogas production was observed from day 10 to day 23, whereas reduced biogas production was observed from day 32 onwards.
Figure 3. Accumulative biogas production of various ratios of Fe2+/H2O2 and H2O2 = 2 (g/ kgVS)
Figure 4. Accumulative biogas production of various ratios of Fe2+/H2O2 and H2O2 = 4 (g/kgVS)
Figure 5. Accumulative biogas production of various ratios of Fe2+/H2O2 and H2O2 = 6 (g/kgVS)
Table 5. Methane content for all tests.
|
CH4 (%) |
|||||
|
H2O2(g\kgVS) |
Fe+2 (kg)/H2O2 (kg) |
||||
|
0.002 |
0.004 |
0.006 |
0.008 |
0.01 |
|
|
2 |
60.93±0.07 |
63.08±0.51 |
68.3±0.83 |
60.11±2.0 |
54.28±1.81 |
|
4 |
49.66±1.02 |
53.04±0.92 |
60.70±0.57 |
46.72±1.9 |
37.15±0.36 |
|
6 |
50.22±2.41 |
43.06±1.85 |
50.51±0.03 |
46.76±2.54 |
40.01±1.2 |
Table 5 shows the methane content for all tests. The CH4 content was improved at H2O2 concentrations ≤ 2 (g/kgVS) and 0.006 ≤ ratio of Fe2+/H2O2. Methanogenesis is a very sensitive stage among the four stages of biogas production. The results show that the toxicity in the substrate, as a result of a high concentration of H2O2 and a high ratio of Fe2+/H2O2, led to methane inhibition [58]. The results show that the daily biogas production of H2O2 = 4 g/kgVS started from the first day of the test and increased at a low rate until day 24 then it became steady until day 32 after that stopped until the last day of the test. Also, the accumulative production of biogas oscillated for the tests FP-6. The maximum CH4 percentage is 68.3% ± 0.83%, 63.08% ± 0.51%, 60.93% ± 0.07%, 60.7% ± 0.75%, and 60.11% ± 2% of FP-2-3, FP-2-2, FP-2-1, FP-4-3 and FP-2-4, respectively.
3.3.2 Prediction of biogas production through PSO model
Curve fitting was used to obtain the equation for biogas production. This equation predicts the trend and behavior of recorded biogas production at any time during the AD test with different concentrations of H2O2 and the Fe2+/H2O2 ratio. These values are represented by a polynomial equation of third order Eq. (4). All the constants of the equations at each concentration were obtained by using a curve fitting cftool which was implemented by the MATLAB program [59, 60]. Figures 5.a, 5.b, and 5.c show the measured values of biogas production at several FP pre-treatment conditions with a curve fitting polynomial. Also, Table 6 illustrates the polynomial equation which represents the biogas production at any time during the test with statistical parameters, which represents better estimation as a result of smaller values of SSE and MSE, in addition to higher values of R2 and adjustR2 which were obtained.
$y=p_{o}+p_{1} x+p_{2} x^{2}+p_{3} x^{3}$ (4)
In this research, the FP with OSP algorithm (FP-OSP) was implemented to predict and optimize biogas production from OMW digestion. The findings revealed that advanced oxidation is a wide category of technological advancement that rely on powerful oxidants like H2O2 for oxidation. By taking into account the Fe2+/H2O2 ratio, H2O2 can achieve greater conversion levels under atmospheric circumstances at a given concentration. The findings were confirmed by prior research on using Fenton pre-treatment to enhance biogas production and methane content. Hallaji et al. [16] also found that a 5 (mg/gVS) H2O2 concentration and 0.0067 of Fe2+/H2O2 (mg/mg) led to higher degradation. The optimal dosage findings provided an alternative choice and efficient method for increasing biogas output, as well as a clear financial benefit for engineering applications.
Tables 1 and 2 outlines the key properties of the previously bio-digested OMW employed in this study. The results obtained show that the high quantities of organic solids and low biodegradability (BOD5/COD ratio of 0.35) highlight the significance of proper treatment prior to cycling back into the AD process [16]. Experimentally, the optimized ratio of BOD5/COD which was obtained after the pretreatment was at concentration 2 of H2O2 (g/kg VS) and Fe2+/H2O2 ratio of 0.006. The BOD5/COD ratio was 0.58, indicating that it is appropriate for biological treatment. While the optimizing analysis by OPS algorithm specified the most accurate value of the BOD5/COD ratio, which was 0.73.
The improved COD, BOD5, and polyphenols are linked to higher biogas yield and CH4 content, implying that higher amounts of organic matter have been consumed by microorganisms, resulting in lower VS at the end of the AD process. This study's improved organic load removal is critical because it lays the path for the development of an integrated, long-term system for treating OMW. These results agree with results concluded in most studies [15-16, 21, 25, 33].
Table 6. The equation predicates the biogas production which effected by FP pre-treatment and statistical parameters
|
$y=p_{o}+p_{1} x+p_{2} x^{2}+p_{3} x^{3}$ |
||||
|
Biogas FP-2 |
po |
P1 |
P2 |
P3 |
|
FP-2-Control |
-0.007431 |
0.009188 |
-0.0001279 |
8.97e-08 |
|
FP-2-1 |
0.002155 |
0.01462 |
-0.0003021 |
1.575e-06 |
|
FP-2-2 |
0.004336 |
0.008928 |
1.03e-05 |
-2.463e-06 |
|
FP-2-3 |
0.0213 |
0.01467 |
-0.0001967 |
3.833e-07 |
|
FP-2-4 |
-0.008299 |
0.01326 |
-0.0003544 |
3.512e-06 |
|
FP-2-5 |
-0.006653 |
0.01136 |
-0.0003082 |
2.898e-06 |
|
Biogas FP-4 |
po |
P1 |
P2 |
P3 |
|
FP-4-Control |
-0.007426 |
0.009186 |
-0.0001278 |
8.797e-08 |
|
FP-4-1 |
-0.00464 |
0.009454 |
-0.0001439 |
5.02e-07 |
|
FP-4-2 |
-0.009473 |
0.01015 |
-9.56e-05 |
-9.861e-07 |
|
FP-4-3 |
-0.006508 |
0.01087 |
6.919e-05 |
-4.278e-06 |
|
FP-4-4 |
-0.003729 |
0.006542 |
2.809e-05 |
-2.139e-06 |
|
FP-4-5 |
-0.003147 |
0.007211 |
-0.0002227 |
2.569e-06 |
|
Biogas FP-6 |
po |
P1 |
P2 |
P3 |
|
FP-6-Control |
-0.007426 |
0.009186 |
-0.0001278 |
8.797e-08 |
|
FP-6-1 |
0.0001293 |
0.003903 |
3.728e-05 |
-1.425e-06 |
|
FP-6-2 |
-0.007824 |
0.01021 |
-0.0002225 |
1.59e-06 |
|
FP-6-3 |
-0.00868 |
0.008478 |
-9.757e-05 |
-2.344e-07 |
|
FP-6-4 |
0.006166 |
0.001585 |
0.0002836 |
-5.883e-06 |
|
FP-6-5 |
0.01295 |
0.0002676 |
9.879e-05 |
-1.617e-06 |
In Zahedi et al. [15], the amount of CH4 enhancement caused by FP pre-treatment was 27%, while in Hallaji et al. [16], Wang et al. [61], Erden and Filibeli [45], and Pilli et al. [17], it was 25%, 20%, 19.4%, and 15%, respectively. In this study, the content of CH4 enhancement was achieved with FP-2-3 (20.2%), where 56.8% of the CH4 content was achieved by digestion of the control substrate, which supports the efficacy of FP in increasing CH4 methane production from the AD of OMW.
BMP tests were implemented to investigate the Fenton pre-treatment process (with different H2O2 concentration and Fe2+/H2O2 ratio) influence on AD process performance. In addition, the PSO algorithm was used to optimize biogas and methane production at an optimum dose of H2O2 and Fe2+/H2O2 ratio. Moreover, the curve fitting cftool was implemented by the MATLAB program to predicate the bigas at any time with any concentration of H2O2 and Fe2+/H2O2 ratio. The experimental results reveal that in the BMP test treated with FP-2-3 (2 (g/kg VS) of H2O2 and 0.006 (kg/kg) of Fe2+/H2O2). The removal efficiency of TCOD, BOD5, and polyphenol was characterized by high performance with FP-2-3. Also, FP-2-3 achieved higher VS removal during the AD process, and it improved the biogas production (93.75%) in comparison with the control digestion yield, and the methane content by 20.2%. By utilizing the OPS algorithm, the results showed that the optimum values of H2O2 and Fe2+/H2O2 ratio that achieve maximum removal efficiency of TCOD, BOD5, and polyphenols were 2.0256 g/kgVS, 0.00608, 2.0019 g/kgVS, and 2.0679 g/kgVS.
This research has been carried out with the financial assistance of the European Union under the ENI CBC Mediterranean Sea Basin Programme. B_A.2.1_0088_MED-QUAD.
[1] Alrawashdeh, K.A.B., Al-Essa, A.H. (2020). Anaerobic co-digestion mill wastewater-activated sludge effect of aerobic pretreatment on the performance of OMW anaerobic digestion. Waste and Biomass Valorization, 11(9): 4781-4788.
[2] Yue, Z.B., Yu, H.Q., Wang, Z.L. (2007). Anaerobic digestion of cattail with rumen culture in the presence of heavy metals. Bioresource Technology, 98(4): 781-786. https://doi.org/10.1016/j.biortech.2006.03.017
[3] Brisolara, K.F., Qi, Y. (2011). Biosolids and sludge management. Water Environment Research, 83(10): 1351-1375. https://doi.org/10.2175/106143011X13075599869416
[4] Al bkoor Alrawashdeh, K. (2019). Improving anaerobic co-digestion of sewage sludge with thermal dried olive mill wastewater. Waste and Biomass Valorization, 10(8): 2213-2219. https://doi.org/10.1007/s12649-018-0234-9
[5] Liao, X., Li, H., Cheng, Y., Chen, N., Li, C., Yang, Y. (2014). Process performance of high-solids batch anaerobic digestion of sewage sludge. Environmental Technology, 35(21): 2652-2659. https://doi.org/10.1080/09593330.2014.916756
[6] Camarillo, R., Rincón, J. (2012). Effect of inhibitory compounds on the two-phase anaerobic digestion performance of diluted wastewaters from the alimentary industry. Chemical Engineering Journal, 193: 68-76. https://doi.org/10.1016/j.cej.2012.04.022
[7] Guo, Q., Majeed, S., Xu, R., Zhang, K., Kakade, A., Khan, A., Li, X. (2019). Heavy metals interact with the microbial community and affect biogas production in anaerobic digestion: A review. Journal of Environmental Management, 240: 266-272. https://doi.org/10.1016/j.jenvman.2019.03.104
[8] Chojnacka, K. (2010). Biosorption and bioaccumulation–the prospects for practical applications. Environment International, 36(3): 299-307. https://doi.org/10.1016/j.envint.2009.12.001
[9] Oz, N.A., Uzun, A.C. (2015). Ultrasound pretreatment for enhanced biogas production from olive mill wastewater. Ultrasonics Sonochemistry, 22: 565-572. https://doi.org/10.1016/j.ultsonch.2014.04.018
[10] Olivieri, G., Russo, M.E., Giardina, P., Marzocchella, A., Sannia, G., Salatino, P. (2012). Strategies for dephenolization of raw olive mill wastewater by means of Pleurotus ostreatus. Journal of Industrial Microbiology and Biotechnology, 39(5): 719-729. https://doi.org/10.1007/s10295-011-1072-y
[11] Alrawashdeh, K.A.B., Gul, E., Yang, Q., Yang, H., Bartocci, P., Fantozzi, F. (2020). Effect of heavy metals in the performance of anaerobic digestion of olive mill waste. Processes, 8(9): 1146. https://doi.org/10.3390/pr8091146
[12] Ennouri, H., Miladi, B., Diaz, S.Z., Güelfo, L.A.F., Solera, R., Hamdi, M., Bouallagui, H. (2016). Effect of thermal pretreatment on the biogas production and microbial communities balance during anaerobic digestion of urban and industrial waste activated sludge. Bioresource Technology, 214: 184-191. https://doi.org/10.1016/j.biortech.2016.04.076
[13] Sólyom, K., Mato, R.B., Pérez-Elvira, S.I., Cocero, M.J. (2011). The influence of the energy absorbed from microwave pretreatment on biogas production from secondary wastewater sludge. Bioresource Technology, 102(23): 10849-10854. https://doi.org/10.1016/j.biortech.2011.09.052
[14] Zhang, D., Chen, Y., Zhao, Y., Ye, Z. (2011). A new process for efficiently producing methane from waste activated sludge: alkaline pretreatment of sludge followed by treatment of fermentation liquid in an EGSB reactor. Environmental Science & Technology, 45(2): 803-808. https://doi.org/10.1021/es102696d
[15] Zahedi, S., Icaran, P., Yuan, Z., Pijuan, M. (2017). Enhancing sludge biodegradability through free nitrous acid pre-treatment at low exposure time. Chemical Engineering Journal, 321: 139-145. https://doi.org/10.1016/j.cej.2017.03.120
[16] Hallaji, S.M., Torabian, A., Aminzadeh, B., Zahedi, S., Eshtiaghi, N. (2018). Improvement of anaerobic digestion of sewage mixed sludge using free nitrous acid and Fenton pre-treatment. Biotechnology for Biofuels, 11(1): 1-12. https://doi.org/10.1186/s13068-018-1235-4
[17] Pilli, S., Yan, S., Tyagi, R.D., Surampalli, R.Y. (2015). Overview of Fenton pre-treatment of sludge aiming to enhance anaerobic digestion. Reviews in Environmental Science and Bio/Technology, 14(3): 453-472. https://doi.org/10.1007/s11157-015-9368-4
[18] Erden, G., Filibeli, A. (2010). Improving anaerobic biodegradability of biological sludges by Fenton pre-treatment: Effects on single stage and two-stage anaerobic digestion. Desalination, 251(1-3): 58-63. https://doi.org/10.1016/j.desal.2009.09.144
[19] Neyens, E., Baeyens, J. (2003). A review of classic Fenton’s peroxidation as an advanced oxidation technique. Journal of Hazardous Materials, 98(1-3): 33-50. https://doi.org/10.1016/S0304-3894(02)00282-0
[20] Walling, C. (1975). Fenton's reagent revisited. Accounts of chemical research, 8(4): 125-131.
[21] Lucas, M.S., Peres, J.A. (2009). Removal of COD from olive mill wastewater by Fenton's reagent: Kinetic study. Journal of Hazardous Materials, 168(2-3): 1253-1259. https://doi.org/10.1016/j.jhazmat.2009.03.002
[22] Ochando-Pulido, J.M., Pimentel-Moral, S., Verardo, V., Martinez-Ferez, A. (2017). A focus on advanced physico-chemical processes for olive mill wastewater treatment. Separation and Purification Technology, 179: 161-174. https://doi.org/10.1016/j.seppur.2017.02.004
[23] Burbano, A.A., Dionysiou, D.D., Suidan, M.T., Richardson, T.L. (2005). Oxidation kinetics and effect of pH on the degradation of MTBE with Fenton reagent. Water Research, 39(1): 107-118. https://doi.org/10.1016/j.watres.2004.09.008
[24] Benzaquén, T.B., Isla, M.A., Alfano, O.M. (2015). Fenton and photo‐Fenton processes for the degradation of atrazine: a kinetic study. Journal of Chemical Technology & Biotechnology, 90(3): 459-467. https://doi.org/10.1002/jctb.4324
[25] Gomec, C.Y., Erdim, E., Turan, I., Aydin, A.F., Ozturk, I. (2007). Advanced oxidation treatment of physico-chemically pre-treated olive mill industry effluent. Journal of Environmental Science and Health, Part B, 42(6): 741-747. https://doi.org/10.1080/03601230701466021
[26] Rivas, F.J., Beltrán, F.J., Gimeno, O., Frades, J. (2001). Treatment of olive oil mill wastewater by Fenton's reagent. Journal of Agricultural and Food Chemistry, 49(4): 1873-1880. https://doi.org/10.1021/jf001223b
[27] Mert, B.K., Yonar, T., Kiliç, M.Y., Kestioglu, K. (2010). Pre-treatment studies on olive mill efluent using physicochemical, Fenton and Fenton-like oxidations processes. J. Hazard. Mater, 174: 122-128. https://doi.org/10.1016/j.jhazmat.2009.09.025
[28] Maamir, W., Ouahabi, Y., Poncin, S., Li, H.Z., Bensadok, K. (2017). Effect of Fenton pretreatment on anaerobic digestion of olive mill wastewater and olive mill solid waste in mesophilic conditions. International Journal of Green Energy, 14(6): 555-560. https://doi.org/10.1080/15435075.2017.1307201
[29] Esteves, B.M., Rodrigues, C.S., Madeira, L.M. (2018). Synthetic olive mill wastewater treatment by Fenton’s process in batch and continuous reactors operation. Environmental Science and Pollution Research, 25(35): 34826-34838. https://doi.org/10.1007/s11356-017-0532-y
[30] Reis, P.M., Martins, P.J., Martins, R.C., Gando-Ferreira, L.M., Quinta-Ferreira, R.M. (2018). Integrating Fenton’s process and ion exchange for olive mill wastewater treatment and iron recovery. Environmental Technology, 39(3): 308-316. https://doi.org/10.1080/09593330.2017.1299797
[31] Nguyen, H., Moayedi, H., Foong, L.K., Al Najjar, H.A.H., Jusoh, W.A.W., Rashid, A.S.A., Jamali, J. (2020). Optimizing ANN models with PSO for predicting short building seismic response. Engineering with Computers, 36(3): 823-837. https://doi.org/10.1007/s00366-019-00733-0
[32] Tufaner, F., Avşar, Y., Gönüllü, M.T. (2017). Modeling of biogas production from cattle manure with co-digestion of different organic wastes using an artificial neural network. Clean Technologies and Environmental Policy, 19(9): 2255-2264. https://doi.org/10.1007/s10098-017-1413-2
[33] Le, L.T., Nguyen, H., Dou, J., Zhou, J. (2019). A comparative study of PSO-ANN, GA-ANN, ICA-ANN, and ABC-ANN in estimating the heating load of buildings’ energy efficiency for smart city planning. Applied Sciences, 9(13): 2630. https://doi.org/10.3390/app9132630
[34] Shariati, M., Mafipour, M.S., Mehrabi, P., Bahadori, A., Zandi, Y., Salih, M.N., Poi-Ngian, S. (2019). Application of a hybrid artificial neural network-particle swarm optimization (ANN-PSO) model in behavior prediction of channel shear connectors embedded in normal and high-strength concrete. Applied Sciences, 9(24): 5534. https://doi.org/10.3390/app9245534
[35] Akbaş, H., Bilgen, B., Turhan, A.M. (2015). An integrated prediction and optimization model of biogas production system at a wastewater treatment facility. Bioresource Technology, 196: 566-576. https://doi.org/10.1016/j.biortech.2015.08.017
[36] Lazzús, J.A. (2013). Neural network-particle swarm modeling to predict thermal properties. Mathematical and Computer Modelling, 57(9-10): 2408-2418. https://doi.org/10.1016/j.mcm.2012.01.003
[37] Mouftahi, M., Tlili, N., Hidouri, N., Bartocci, P., Alrawashdeh, K.A.B., Gul, E., Fantozzi, F. (2020). Biomethanation potential (BMP) study of mesophilic anaerobic co-digestion of abundant bio-wastes in southern regions of Tunisia. Processes, 9(1): 48. https://doi.org/10.3390/pr9010048
[38] Al bkoor Alrawashdeh, K., Slopiecka, K., Alshorman, A.A., Bartocci, P., Fantozzi, F. (2017). Pyrolytic degradation of Olive Waste Residue (OWR) by TGA: Thermal decomposition behavior and kinetic study. Journal of Energy and Power Engineering, 11: 497-510. https://doi.org/10.17265/1934-8975/2017.08.001
[39] Al bkoor Alrawashdeh, K., Pugliese, A., Slopiecka, K., Pistolesi, V., Massoli, S., Bartocci, P., Fantozzi, F. (2017). Codigestion of untreated and treated sewage sludge with the organic fraction of municipal solid wastes. Fermentation, 3(3): 35. https://doi.org/10.3390/fermentation3030035
[40] Kennedy, J., Eberhart, R.C. (1997). A discrete binary version of the particle swarm algorithm. In 1997 IEEE International conference on systems, man, and cybernetics. Computational Cybernetics and Simulation, 5: 4104-4108. https://doi.org/10.1109/ICSMC.1997.637339
[41] Gul, E., Alrawashdeh, K.A.B., Masek, O., Skreiberg, Ø., Corona, A., Zampilli, M., Fantozzi, F. (2021). Production and use of biochar from lignin and lignin-rich residues (such as digestate and olive stones) for wastewater treatment. Journal of Analytical and Applied Pyrolysis, 158: 105263. https://doi.org/10.1016/j.jaap.2021.105263
[42] Centi, G., Perathoner, S. (2014). Perspectives and state of the art in producing solar fuels and chemicals from CO2. Green Carbon Dioxide: Advances in CO2 Utilization, 1-24. https://doi.org/10.1002/9781118831922.ch1
[43] Apha A. (2012). Standard methods for the examination of water and wastewater. Washington: American Public Health Association. http://srjcstaff.santarosa.edu/~oraola/Assets/APHA_SM_20.pdf.
[44] APHA, AWWA and WEF. (1992). Standard methods for the examination of water and wastewater, 18th ed. Washington, DC: American Public Health Association. https://law.resource.org/pub/us/cfr/ibr/002/apha.method.2130.1992.html.
[45] Erden, G., Filibeli, A. (2011). Effects of Fenton pre-treatment on waste activated sludge properties. Clean-Soil, Air, Water, 39(7): 626-632. https://doi.org/10.1002/clen.201000199
[46] Lindfield, G., Penn, J. (2017). Chapter 3 - Particle Swarm Optimization Algorithms, Introduction to Nature-Inspired Optimization, Academic Press, 2017: 4968. https://doi.org/10.1016/B978-0-12-803636-5.00003-7
[47] Gaida, D., Luis, S.B.A., Wolf, C., Back, T., Bongards, M., McLoone, S.F. (2011). Optimal control of biogas plants using nonlinear model predictive control. In Proceedings of the ISSC 2011, Dublin, Ireland, 56.
[48] Sendrescu, D., Roman, M. (2013). Parameter identification of bacterial growth bioprocesses using particle swarm optimization. In 2013 9th Asian Control Conference (ASCC), pp. 1-6. https://doi.org/10.1109/ASCC.2013.6606279
[49] Bai, J., Liu, H., Yin, B., Ma, H. (2015). Modeling of enhanced VFAs production from waste activated sludge by modified ADM1 with improved particle swarm optimization for parameters estimation. Biochemical Engineering Journal, 103: 22-31. https://doi.org/10.1016/j.bej.2015.06.015
[50] Akbaş, H., Bilgen, B., Turhan, A.M. (2015). An integrated prediction and optimization model of biogas production system at a wastewater treatment facility. Bioresource Technology, 196: 566-576. https://doi.org/10.1016/j.biortech.2015.08.017
[51] Yang, J., Lu, L., Ouyang, W., Gou, Y., Chen, Y., Ma, H., Fang, F. (2017). Estimation of kinetic parameters of an anaerobic digestion model using particle swarm optimization. Biochemical Engineering Journal, 120: 25-32. https://doi.org/10.1016/j.bej.2016.12.022
[52] Ferrentino, R., Merzari, F., Andreottola, G. (2020). Optimisation of Fe2+/H2O2 ratio in Fenton process to increase dewaterability and solubilisation of sludge. Environmental Technology, 41(22): 2946-2954. https://doi.org/10.1080/09593330.2019.1589583
[53] Virkutyte, J., Jegatheesan, V. (2009). Electro-Fenton, hydrogenotrophic and Fe2+ ions mediated TOC and nitrate removal from aquaculture system: Different experimental strategies. Bioresource Technology, 100(7): 2189-2197. https://doi.org/10.1016/j.biortech.2008.10.050
[54] Su, C.C., Chang, A.T., Bellotindos, L.M., Lu, M.C. (2012). Degradation of acetaminophen by Fenton and electro-Fenton processes in aerator reactor. Separation and Purification Technology, 99: 8-13. https://doi.org/10.1016/j.seppur.2012.07.004
[55] Babuponnusami, A., Muthukumar, K. (2012). Advanced oxidation of phenol: a comparison between Fenton, electro-Fenton, sono-electro-Fenton and photo-electro-Fenton processes. Chemical Engineering Journal, 183: 1-9. https://doi.org/10.1016/j.cej.2011.12.010
[56] Guerreiro, L.F., Rodrigues, C.S., Duda, R.M., de Oliveira, R.A., Boaventura, R.A., Madeira, L.M. (2016). Treatment of sugarcane vinasse by combination of coagulation/flocculation and Fenton’s oxidation. Journal of Environmental Management, 181: 237-248. https://doi.org/10.1016/j.jenvman.2016.06.027
[57] Feki, E., Battimelli, A., Sayadi, S., Dhouib, A., Khoufi, S. (2020). High-rate anaerobic digestion of waste activated sludge by integration of electro-Fenton process. Molecules, 25(3): 626. https://doi.org/10.3390/molecules25030626
[58] Campo, G., Cerutti, A., Zanetti, M., Scibilia, G., Lorenzi, E., Ruffino, B. (2018). Enhancement of waste activated sludge (WAS) anaerobic digestion by means of pre-and intermediate treatments. Technical and Economic Analysis at a Full-Scale WWTP. Journal of Environmental Management, 216: 372-382. https://doi.org/10.1016/j.jenvman.2017.05.025
[59] Wahde, M. (2008). Biologically Inspired Optimization Methods: An Introduction. WIT press, Southampton, UK.
[60] Danielsson, O. (2014). Modeling and simulation of anaerobic manure digestion into biogas. Master’s Thesis in Applied Physics, Department of Physics & Engineering Physics Applied Physics. Chalmers University of Technology. Gothenburg, Sweden. Master’s Thesis 2014:5. https://edisciplinas.usp.br/pluginfile.php/4318017/mod_resource/content/1/Oskar%20Danielsson.pdf.
[61] Wang, Q., Jiang, G., Ye, L., Yuan, Z. (2014). Enhancing methane production from waste activated sludge using combined free nitrous acid and heat pre-treatment. Water Research, 63: 71-80. https://doi.org/10.1016/j.watres.2014.06.010