Muhammad Osama Akbar | Hassaan Malik | Farhad Hassan | Muhammad Saad Shahbaz Khan*
© 2022 IIETA. This article is published by IIETA and is licensed under the CC BY 4.0 license (http://creativecommons.org/licenses/by/4.0/).
OPEN ACCESS
In recent years, due to rapid urbanization and industrialization, there is an increasing trend of air pollution that has brought the most alarming situation for the health of humans in some developing countries. Among various air pollutants, the most dangerous contaminants are CO (Carbon Monoxide), NO2 (Nitrogen Dioxide) as well as O3 (Ozone). This paper conducted a crucial analysis by utilizing the GEE cloud-based platform with Sentinel-5P TROPOMI satellite imagery of multi-temporal range to analyze the changes of NO2, CO, and O3 at a surface level during the nationwide lockdown in Pakistan due to COVID-19. As the whole country "shuts down", the sudden suspension of industrial activities and sparse vehicles on roads greatly reduced the air pollution. Our study found a notable reduction in NO2 (28.88%), CO (15.81%), and O3 (8.41%). The improvement in the air quality helps people who are suffering from respiratory and related diseases. Our study is helpful for the environmental department to design effective policies and take measures to improve and maintain the air quality.
COVID-19, air pollutants, carbon monoxide, nitrogen dioxide, ozone
Along with the rapid urbanization and industrialization in developing countries, air pollution has become one of the main urban issues and public focuses, as air quality has profound impacts on health. Induced through social actions or non-human progressions, several constituents pass into the stratosphere [1]. As soon as constituents are emanated to a greater extent when extreme surpassing the self-decontamination capability of the surrounding, it will cause changes in the composition of the atmosphere [2]. Once the measure, density, & extent of impurities in the troposphere touches a detrimental extent, air pollution is formed, which compromises people’s wellbeing, healthiness, and welfare of surroundings. The environmental effects of air pollution are divided into two hazard categories i.e. severe and chronic hazards. Extreme hazards are mainly caused by air emissions, mostly due to the accumulation of outside air, which increases rapidly over a short period, such as heavy haze [3]. Severe risks, mainly show symptoms of respirational and eye irascibility, rib cage aching, cough, tender esophagus, head nuisance, unsettled stomach, aortic pump debilitation, lung disorders, & serious occurrences of lingering heart & mental illness, are caused by inhaling into large amounts of pollutants [4]. Air pollution can cause acute and chronic diseases. There is strong evidence that long-term exposure to air pollution increases the risk of suffering from the following diseases: ischemic heart disease, stroke, chronic obstructive pulmonary disease (COPD), lung cancer and upper respiratory and digestive tract cancer, adverse pregnancy outcomes [Namely, low birth rate, premature delivery, weight loss (infants weighing less than 5 pounds)], diabetes and cataracts. The International Agency for Research on Cancer (IRCA) of the World Health Organization has classified air pollution as a carcinogen. Some of the direct health effects of exposure to air pollution include irritation of the eyes, nose, and throat; shortness of breath; coughing; exacerbating pre-existing diseases such as asthma attacks and chest pain. Age, pre-existing diseases, other risk factors for diseases, and sensitivity to pollutants may all affect a person's response to pollutants. This usually leads to severe chronic obstructive pulmonary disease (COPD) [5]. The larger the value of the AQI, the higher the level and category, and the darker the characterizing color, means that the more serious the air pollution situation, the greater the health hazard to the human body. When citizens look at the AQI, they don’t need to remember the specific value and level of the AQI. They only need to pay attention to the excellent (green), good (yellow), light pollution (orange), moderate pollution (red), heavy pollution (purple), and severe pollution. Six evaluation categories and characteristic colors including pollution (brown-red). When the category is excellent or good, and the color is green or yellow, the general population can perform normal activities; when the category is lightly polluted and the color is orange, red, purple, or maroon, all groups of people need to pay attention to the recommendations and in 2019 before the lockdown in Multan the color for Pakistan was red and it placed between 180-200 AQI that indicates the quality of air unhealthy for children, and people with heart and lung disease. After lockdown for 2020, the air quality is still unhealthy but significantly improved and now Pakistan is placed 153 AQI with orange color. Air pollution is the biggest environmental risk facing global public health. People all over the world are exposed to air pollution, whether in the workplace, during travel, or at home. In many developing countries, people rely on wood and other solid fuels, such as the use of raw coal for cooking and heating, and the use of kerosene for lighting, which increase air pollution in the home and harm the health of people living in such environments. While the connection between air pollution and development, the economy and the environment mean that reducing air pollution is closely related to the achievement of the Sustainable Development Goals (SDG), and directly affects the realization of the following goals: Good health and well-being, affordable clean energy, Sustainable Development Goal, Sustainable Cities and Communities, and it indirectly affects many other sustainable development goals. The control of air pollution can also reduce the huge economic losses related to human health, loss of productivity, the decline in crop yields, and a decline in the competitiveness of globalized cities. Due to the outbreak of the COVID-19 pandemic, the Pakistani government as per the recommendations from epidemiologists almost completely shut down the country to maintain the safe social distancing and suppress the spreading of coronavirus [6]. In Pakistan, the first case was reported on 26th February 2020. Till 1st September 2020, the total number of affected patients rose to 296K, recovered patients were 281K, and the number of deaths was 6.3K [7]. Nowadays, the increasing trend of coronavirus is impressively down due to effective nationwide lockdown control measures are taken by the Pakistani government [8]. During the lockdown, only a few vehicles were seen on the road. All small- and large-scale factories, shopping malls, offices were closed completely [9]. These are all the primary sources of air pollution, and in less developed countries almost 90% of deaths happen yearly due to air pollution, while in the developed countries the death rate is much lower [10].
Analyzed the change of air pollutants, including ozone, nitrogen dioxide, and carbon monoxide, in Pakistan before and during the lockdown due to COVID-19. We use the data from the Sentinel-5P satellite which is a global air pollution monitoring satellite. This satellite is equipped with a Tropospheric Monitoring Instrument (TROPOMI), which can effectively observe trace gas components in the atmosphere around the world. This study carried an analysis based on a comparison approach to measure the changes under the two different periods before lockdown from 21st October 2019 to 20th March 2020 and during the lockdown from 21st March 2020 to 21st August 2020. The novelty of this research is based on its uniqueness as it is implemented in the Pakistan region. The important parameter of this research is that it is based on different variants of air pollutants. Pakistan is amongst the countries with a high pollution rate and it is the second most polluted country in the world and therefore the pollutants are of shear importance [11]. Considering the importance and nature of these air pollutants in Pakistan, it makes it critical for the policymakers to foresee these changes to aid the prospect of the country and for a sustainable future [12].
The workflow of our study is shown in Figure 1, which indicates all of the most important components that are used to investigate the atmospheric change due to the imposition of COVID-19 lockdown.
2.1 Satellite imagery
The Sentinel-5 Precursor (Sentinel-5P) has been used to research the concentration of nitrogen dioxide (NO2), carbon monoxide (CO), ozone (O3). This low-orbit polar satellite was launched by the European Space Agency on 13th Oct. 2017 for monitoring the pollution of the air at surface level. Especially, it is a multispectral sensor that tracks reactance values at wavelengths that measure amounts of ozone, methane, formaldehyde, aerosols, carbon monoxide, nitrogen oxide, and sulfur dioxide as well as cloud characteristics such as cloud fraction, cloud base, and pressure at ultraviolet-visible (250-500 nm), near-infrared (675-775 nm) and short-wave infrared (2305-2385 nm) [13].
2.2 Preprocessing of satellite imagery
Image preprocessing makes the satellite imagery usable for further processing to extract the desired results. There are a series of operations that are needed to perform on raw satellite imagery data for preprocessing [14].
Figure 1. Methodology of the study to analyze the change of air pollutants due to COVID-19 Lockdown
2.3 Geographical filter boundaries
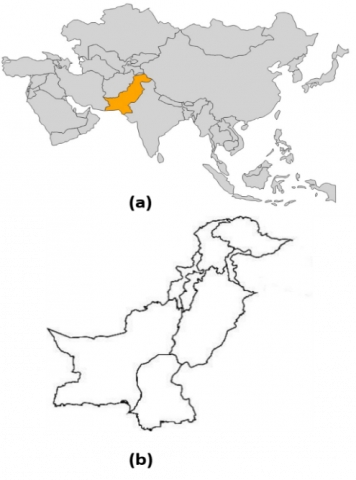
The selected region for this research is Pakistan situated in South Asia as shown in Figure 2 and the Greater Middle East at a latitude and longitude of 30°00N, 70°00E. Pakistan is surrounded on the southern side by 1,046 kilometers of coastline of the Arabian Sea and is bordered in the west by Afghanistan and Iran, in the east by India, and in the far northeast by China [15]. Pakistan has a region of 803,940 sq. km (310,403 sq. mi), covering 1,875 km (1,165 mi) northeast to southwest from the Hindu Kush as well as the Himalayas to the Arabian Sea, and 1,006 km (625 mi) southeast to North West. Comparatively, the area covered by Pakistan is marginally less than half the size of the state of California. Low rainfall, large-scale deforestation, coal mining, and oil and gas mining have caused climate problems, with that issue the plateau facing severe environmental problems. In the mid-1990s, at 71.9 million metric tons a year, or 0.59 metric tons per capita per year, Pakistan was among the 50 countries producing the world's top manufacturing carbon dioxide emissions [16]. Because of agricultural and industrial waste as well as in-curable sewage, the water quality of the country is at risk. Healthy drinking water is available to just 85 percent of the rural areas. Approximate 80% of the nation's diseases are related to drinking unclean water [17].
Figure 2. (a) The World map and South Asia region (b) The Pakistan geographical representation
2.4 Date range filtration
The date range filtration is based on the previous five months and during five months from the starting date of Coronavirus 1st wave’s Lockdown. The timeframe of the previous six months is 21st October 2019 to 20th March 2020 while the nationwide Coronavirus Lockdown was imposed on 20th March 2020 and during the period is 21st March to 20th August 2020.
2.5 Air pollutants filtration
There are various ranges of pollutants available [18, 19] and captured by the Sentinel-5P satellite using Google Earth Engine [20] and we utilized the TROPOMI [21] instruction for our concerning data, which is a sun back-scatter instrument in the line of SCIAMACHY and OMI with four spectrometer bands and a spectral resolution of 0.25–0.5 nm, but our concern is about major atmosphere pollutants such as nitrogen dioxide, carbon monoxide, and ozone that are considered harmful to human health not for any specific geographical area but also the whole world [17].
2.6 Change of air pollutants
On preprocessed satellite imagery, applied the basic binary operation of digital image processing to measure the multi-temporal change of reduction in the pollutants of air at the level of surface [22].
2.6.1 Binary operation
At this stage measured the change of nitrogen dioxide, carbon monoxide, and ozone by utilizing the difference binary operation on preprocessed satellite imagery data. The resultant image indicates the number of losses with the help of the color spectrum that happened due to the COVID-19 lockdown [23].
2.7 Visualization
There are different techniques and tools are available to represent a series of data [24]. While the adopted one is a line chart that represents the availability of NO2, CO, and O3 at surface level. Change analysis of air pollutants due to COVID-19 Lockdown [25]. An important thing is to analyze the results into the meaningful state that extracts the positive impact of COVID-19 lockdown in Pakistan concerning the most dangerous air pollutants like nitrogen dioxide, carbon monoxide, and ozone [26].
This section provides a concise description of the results of this study to assess the outcomes of concentrated discharges throughout the stay-inside phase, due to COVID-19, on-air value in Pakistan. We compared the concentration of particulate matter nitrogen dioxide, carbon monoxide, and ozone measured during the lockdown period 21st March 2020 to 20th August 2020, with values obtained in the previous five-month period 21st October 2019 to 20th March 2020. Air pollutant gases can also be very dangerous. Carbon monoxide (CO) restricts the transfer of oxygen to tissues and can be fatal in very high concentrations. Nitrogen dioxide (NO2) is a powerful lung irritant that affects the health of people who already have respiratory diseases (asthma and chronic obstructive pulmonary disease), especially those who live and work near the source of (NO2). Nitrogen oxides (NO2) can cause a variety of effects, from respiratory tract irritation to the development of asthma and increased mortality. According to data on the global burden of disease, exposure to ozone (O3) can cause respiratory diseases and is associated with 472,000 premature deaths (IHME) in 2017.
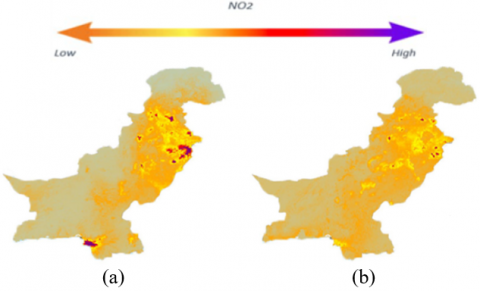
3.1 Nitrogen dioxide pollutants
The level of nitrogen dioxide is measured by satellite imagery and for the time range of 21st October 2019 to 20th March 2020 are shown in Figure 3(a) while Figure 3(b) demonstrate the existing level of nitrogen dioxide during the COVID-19 lockdown 21st March 2020 to 20th August 2020 period. The color scale bar on the right top of Figure 3 indicates the present quantity of nitrogen dioxide.
Figure 3. Level of nitrogen dioxide concentration: (a) 21st October 2019 to 20th March 2020; (b) 21st March 2020 to 20th August 2020
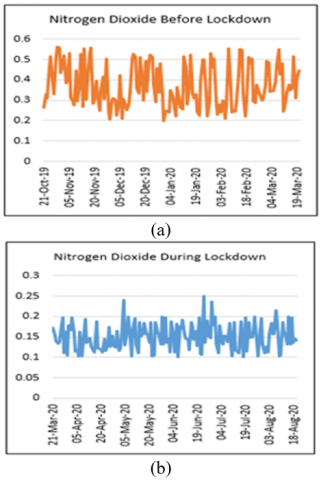
Figure 4. Indicate the existence of nitrogen dioxide: (a) 21st October 2019 to 20th March 2020; (b) 21st March 2020 to 20th August 2020
Figures 4 (a) and (b) show the graph values of Nitrogen Dioxide pollutants which are extracted on daily maximum statistical-based values for both periods. The heights indicate the available quantity of nitrogen dioxide while the horizontal axis represents the date values.
Averagev alue of $\mathrm{NO}_{2}=\sum_{i=1}^{n}\left(\frac{X_{i}}{n}\right)$ (1)
In Eq. (1) represents the following:
(a) i=1 specifying the starting date of before and during lockdown.
(b) n indicates the total number of days.
(c) Xi is the daily maximum statistical-based value for nitrogen dioxide.
The average estimated from data for the before lockdown period is 0.370138 mol/m2, and the average calculated after lockdown is 0.150316 mol/m2.
Before the lockdown period, nitrogen dioxide concentrations were at their highest point, with a value of 0.561 mol/m2 but during the lockdown period, the highest value is 0.273 mol/m2 in Pakistan.
3.1.1 Change of nitrogen dioxide
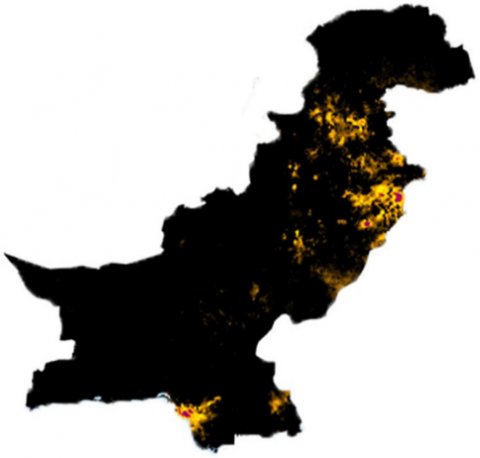
There is an extensive change of reduction in nitrogen dioxide at surface level is observed in Pakistan due to the executions of lockdown with the comparison of the pre-lockdown period. The loss of nitrogen dioxide between two-time series is shown in Figure 5 in which the presence of black color demonstrates the no change observed in the particular geographical area of Pakistan.
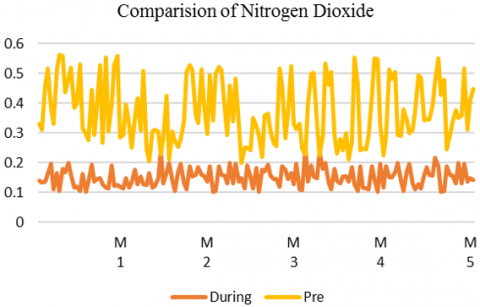
Figure 6 comparison graph contains two lines. In which 21st March to 20th August 2020 values are indicated by the orange color line and the yellow color line is for before lockdown 21st October 2019 to 20th March 2020 while the level of concentration of nitrogen dioxide is reduced and it is clearly shown. The difference between the two mentioned cycles is 0.219822 mol/m2. According to data derived from the Sentinel 5P satellite imagery, nitrogen emission in the air is 71.12% higher before the lockdown time, but it falls by 42.22% after the lockdown period, resulting in a reduction of 28.88% currently measured.
Figure 5. Change of reduction in nitrogen dioxide at the level of surface
Figure 6. Loss of nitrogen dioxide at the level of surface
3.2 Carbon monoxide and air pollutants
Sentinel 5P satellite imagery is utilized to measure the availability index of CO for the time range of October, 21st to March 2020 as shown in Figure 7(a). Figure 7(b) was utilized to determine the concentration index of ca CO during the period of lockdown due to the COVID-19 pandemic during the time ranges from 21st March 2020 to 20th August 2020. The presence quantity of carbon monoxide is expressed through the color scale bar as shown at the right top of Figure 7.
Figure 7. Indicate the existence of CO (a) 21st October 2019 to 20th March 2020; (b) 21st March 2020 to 20th August 2020
Figure 8. Indicate the existence of Carbon Monoxide: (a) 21st October 2019 to 20th March 2020; (b) 21st March 2020 to 20th August 2020
Figures 8 (a) and (b) are illustrated the histogram graph values of carbon monoxide pollutants which are extracted on daily maximum statistical-based values for both periods. The heights indicate the available quantity of carbon monoxide while the horizontal axis represents the date values. The estimated average data is 0.052678 mol/m2, before the lockdown period. After lockdown data is 0.038289 mol/m2. The concentrates of carbon monoxide were at their highest before lockdown. The value of concentration was 0.083 mol/m2. The highest value is during the lockdown 0.051 mol/m2 period in Pakistan.
3.2.1 Change of carbon monoxide
Due to the lockdown execution, an extensive change of reduction in carbon monoxide is observed. It is compared with the pre-lockdown period. In Figure 9, the loss of nitrogen dioxide is shown between two times series. In this, the presence of black color demonstrates the unchanged area of Pakistan.
Figure 9. Change of reduction in Carbon monoxide at the level of surface
Figure 10. Loss of Carbon Monoxide at the level of surface
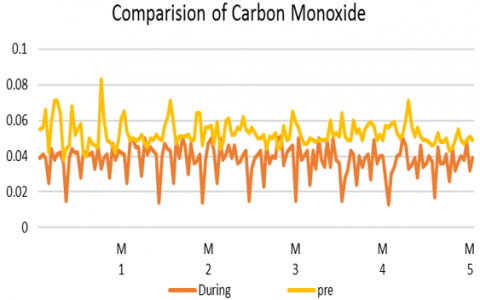
A comparison graph containing two lines is shown in Figure 10. These two lines represent values, the orange color demonstrates the availability of carbon monoxide during the period of 21st March 2020 to 20th August 2020. On the other hand, yellow color lines are used for 21st October 2019 to 20th March 2020. There is a reduction in the level of carbon monoxide. It is visible in the graph and the observed difference between these cycles is 0.014389 mol/m2.
Averagev alue of $C O=\sum_{i=1}^{n}\left(\frac{Y_{i}}{n}\right)$ (2)
In Eq. (2):
(a) i=1 specifying the starting date of before and during lockdown.
(b) n indicates the total number of days.
(c) Yi is daily maximum statistical-based values for carbon Monoxide.
The data derives from sentinel 5P satellite imagery, and it reveals facts that carbon monoxide emission is 57.90% higher before the lockdown time in the air. However, it falls by 42.09% after lockdown and results in a reduction level up to 15.81%.
3.3 Ozone air pollutants
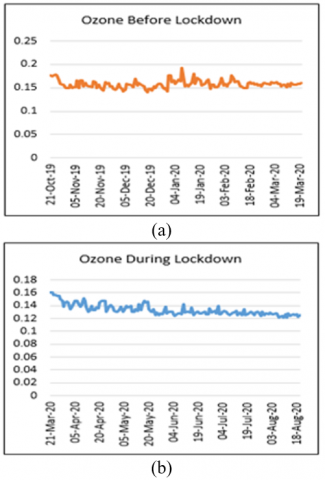
Using satellite images measure the ozone air pollutants at the level of surface in the air for the range of October, 21st to March 2020 as shown in Figure 11(a). Figure 11(b) demonstrates the surface level of ozone during the period of COVID-19 lockdown from 21st March 2020 to 20th August 2020. The availability of ozone is expressed highest to lowest through the color scale bar as shown at the right top of Figure 11.
Figure 12 (a) and Figure 12(b) are demonstrated the histogram graph values of carbon monoxide pollutants which are extracted on daily maximum statistical-based values for both periods. The heights indicate the available quantity of carbon monoxide while the horizontal axis represents the date values.
Figure 11. Indicate the existence of Ozone: (a) 21st October 2019 to 20th March 2020; (b) 21st March 2020 to 20th August 2020
Figure 12. Indicate the existence of Ozone: (a) 21st October 2019 to 20th March 2020; (b) 21st March 2020 to 20th August 2020
Averagev alue of $O_{3}=\sum_{i=1}^{n}\left(\frac{Z_{i}}{n}\right)$ (3)
In Eq. (3):
(a) i=1 specifying the starting date before and during the lockdown.
(b) n indicates the total number of days.
(c) Zi is the daily maximum statistical-based value for Ozone.
3.3.1 Change of ozone pollutants
Due to the lockdown execution, an extensive change of reduction in ozone is observed. It is compared with the pre-lockdown period. In Figure 13, the loss of ozone is shown between two times series. In this, the presence of black color demonstrates the unchanged area of Pakistan.
A comparison graph containing two lines is shown in Figure 14. These two lines represent values, the orange color demonstrates the availability of carbon monoxide during the period of 21st March 2020 to 20th August 2020. On the other hand, yellow color lines are used for 21st October 2019 to 20th March 2020.
There is a reduction in the level of carbon monoxide. It is visible in a graph and the observed difference between these cycles is 0.024496 mol/m^2. According to data derived from the Sentinel 5P satellite imagery, ozone in the air is 54.21% higher before the lockdown time, but it falls by 45.79% during the lockdown period, resulting in a reduction of 8.41% currently measured.
Figure 13. Change of reduction in Ozone at the level of surface
Figure 14. Losses of Ozone at the level of surface
3.4 Discussions
The geographical area of Pakistan is placed at the second-ranking among the most air pollutant countries list all over the world due to this we work to find out the main concerns for the air pollution. Our analysis deals with the most ambient air pollutants nitrogen dioxide, carbon monoxide, and ozone and we found an interesting correlation between the COVID-19 pandemic lockdown and change of air pollutants. Before lockdown the availability of nitrogen dioxide, carbon monoxide, and ozone at the surface level with the help of Sentinel 5P satellite imagery is shown in Figure 3(a), Figure 7(a), and Figure 11(a) respectively and the daily maximum statistical-based approach is adopted to calculate the average values of nitrogen dioxide, carbon monoxide, and ozone that are 0.370138 mol/m2, 0.052678 mol/m2, is 0.157869 mol/m2 respectively. During the lockdown period a massive change in nitrogen dioxide, carbon monoxide, and ozone air pollutants has been observed and can be seen in Figure 3(b), Figure 7(b), and Figure 11(b) while using a daily maximum statistical-based approach the average values of nitrogen dioxide, carbon monoxide, and ozone that are 0.150316 mol/m2, 0.038289 mol/m2, is 0.133373 mol/m2 respectively. The finding of this work specifies the reduction in nitrogen dioxide is 28.96%, carbon monoxide is 15.81%, and ozone is 8.42%. The massive change in these air pollutants happened due to the temporary situation of nationwide and cause to improve the quality of air and helpful for the people who are suffering from respiratory and related diseases. The COVID-19 pandemic is a crisis that affected many sectors especially education systems all around the world, causing most schools, universities, and colleges to close, it also hits the global economy the most since World War II, etc. but despite these causes, COVID19 is considered as a blessing for the perspective of the environment in terms of positive change.
The government needs to invest in capacity building to measure and monitor air pollution through the establishment of monitoring networks, and to ensure that such networks operate normally, are properly maintained, and follow procedures to ensure the quality and reliability of air quality measurement. The first step in responsible management of air pollution is to ensure that the necessary regulations, policies, and enforcement mechanisms are in place and fully supported. The government should ensure that relevant agencies have sufficient capacity to monitor and evaluate air pollution emissions. This will ensure that decision-makers know where the air pollution comes from, how large the different emission sources are, the air pollution levels in different parts of the country, the health effects, and what influential measures can be taken to reduce pollution levels and the harm caused by pollution. The government must understand the benefits and costs associated with alternative actions or interventions to improve air quality and determine the priority of actions especially controlling the excessive usage of private vehicles and such industries that contribute massively to air pollution due to their massive smoke. The health and social benefits of most air pollution reduction measures far exceed the cost of implementation. Strengthening systems and governance, promoting behavior change, building a culture conducive to clean air, improving the ability of all departments to effectively participate in and contribute to solutions, strengthening the political will, and increasing funding are also key factors for success. Companies and industries can play a key role in reducing air pollution because many of their activities are sources of various air pollutants. The private sector can cause air pollution through its cross-sectoral operations and supply chains. The private sector has a variety of sources of pollution, from burning fuel to distribution and delivery vehicles. Because air pollution also contributes to climate change, companies that promise to reduce air pollution emissions can also reduce their carbon footprint. This win-win situation of reducing air pollution and its carbon footprint can and has been a driving force for the private sector to find innovative solutions. In the past, most of these solutions were technical (for example, switching from one technology to another), but some private sectors may need to get rid of the shackles of these technical solutions. To reduce air pollution, the private sector can take the following actions:
Incorporate air quality into corporate social responsibility activities and promise to report and monitor regularly.
Identify and quantify air pollution emissions from different facilities, manufacturing processes, and supply chains.
Develop a plan to reduce air pollution for each department.
Carry out publicity activities to transparently publicize the level of emissions caused by their business activities and explain what measures they will take to reduce emissions.
The COVID-19 pandemic is spreading globally, Pakistan has adopted measures to lock down cities or provinces: public places are closed, people work from home. In this work, we found that these actions have produced quantifiable results in a short period, especially to the large-scale decline in the pollutants of air in such a wide area. Taking the average concentration of nitrogen dioxide, carbon monoxide, and ozone before the intervention in 2020 as a reference, we have observed that the level of concentration has been reduced in nitrogen dioxide, carbon monoxide, and ozone about 71.18-42.22%, 57.90-42.09%, and 54.21-45.79% respectively, which indicates that imposition of lockdown is effective for the reduction of most dangerous pollutants by a large amount from the air. This is a temporary but noticeable situation for the higher administration of Pakistan as well as for the environmental department because the reductions of air pollutants improve the quality of air which is better for the people of Pakistan. So, there is a need for a permanent solution to gain control of air pollution under sensible and competent leadership that adopts effective policies for the reduction of these pollutants.
[1] Gelencsér, A., May, B., Simpson, D., Sánchez-Ochoa, A., Kasper-Giebl, A., Puxbaum, H., Caseiro, A., Pio, C., Legrand, M. (2007). Source apportionment of PM2. 5 organic aerosol over Europe: Primary/secondary, natural/anthropogenic, and fossil/biogenic origin. Journal of Geophysical Research: Atmospheres, 112(D23): 327. https://doi.org/10.1029/2006jd008094
[2] Zhang, J.J., Wei, Y., Fang, Z. (2019). Ozone pollution: A major health hazard worldwide. Frontiers in Immunology, 10: 2518. https://doi.org/10.3389/fimmu.2019.02518
[3] Veerasingam, S., Ranjani, M., Venkatachalapathy, R., Bagaev, A., Mukhanov, V., Litvinyuk, D., Mugilarasan, M., Gurumoorthi, K., Guganathan, L., Aboobacker, V.M., Vethamony, P. (2021). Contributions of Fourier transform infrared spectroscopy in microplastic pollution research: A review. Critical Reviews in Environmental Science and Technology, 51(22): 2681-2743. https://doi.org/10.1080/10643389.2020.1807450
[4] Halkos, G., Zisiadou, A. (2020). An overview of the technological environmental hazards over the last century. Economics of Disasters and Climate Change, 4(2): 411-428. https://doi.org/10.1007/s41885-019-00053-z
[5] Coccia, M. (2021). Effects of the spread of COVID-19 on public health of polluted cities: results of the first wave for explaining the dejà vu in the second wave of COVID-19 pandemic and epidemics of future vital agents. Environmental Science and Pollution Research, 28(15): 19147-19154. https://doi.org/10.1007/s11356-020-11662-7
[6] Vasileios, S., Paraskevi, A., Athina-Maria, A., et al. (2020). Does the CD33 rs3865444 polymorphism confer susceptibility to Alzheimer’s disease? Journal of Molecular Neuroscience, 70(6): 851-860. https://doi.org/10.1007/s12031-020-01507-w
[7] Liow, Y., Loh, V.W.K., Young, D. (2020). 100 days on: the primary care response to COVID-19 in Singapore. Singapore Medical Journal, 1-8. https://doi.org/10.11622/smedj.2020162
[8] Muhammad, M.H., Idris, A.L., Fan, X., Guo, Y., Yu, Y., Jin, X., Qiu, Z., Guan, X., Huang, T. (2020). Beyond risk: Bacterial biofilms and their regulating approaches. Frontiers in Microbiology, 11: 928. https://doi.org/10.3389/fmicb.2020.00928
[9] Shafi, M., Liu, J., Ren, W. (2020). Impact of COVID-19 pandemic on micro, small, and medium-sized Enterprises operating in Pakistan. Research in Globalization, 2: 100018. https://doi.org/10.1016/j.resglo.2020.100018
[10] Tze Ming Ng, P. (2008). Globalization, nationalism, and Christian higher education in Northeast Asia. Christian Higher Education, 8(1): 54-67. https://doi.org/10.1080/15363750802319110
[11] Veefkind, J.P., Aben, I., McMullan, K., Förster, H., De Vries, J., Otter, G., Claas, J., Eskes, H.J., de Haan, J.F., Kleipool, Q., van Weele, M., Hasekamp, O., Hoogeveen, R., Landgraf, J., Snel, R., Tol, P., Ingmann, P., Voors, R., Kruizing, B., Vink, R., Visser, H., Levelt, P.F. (2012). TROPOMI on the ESA Sentinel-5 Precursor: A GMES mission for global observations of the atmospheric composition for climate, air quality and ozone layer applications. Remote Sensing of Environment, 120: 70-83. https://doi.org/10.1016/j.rse.2011.09.027
[12] Cai, L., Wang, J., Peng, J., Tan, Z., Zhan, Z., Tan, X., Chen, Q. (2017). Characteristic of microplastics in the atmospheric fallout from Dongguan city, China: preliminary research and first evidence. Environmental Science and Pollution Research, 24(32): 24928-24935. https://doi.org/10.1007/s11356-017-0116-x
[13] Abas, N., Saleem, M.S., Kalair, E., Khan, N. (2019). Cooperative control of regional transboundary air pollutants. Environmental Systems Research, 8(1): 10. https://doi.org/10.1186/s40068-019-0138-0
[14] Hanif, M., Khan, A.H., Adnan, S. (2013). Latitudinal precipitation characteristics and trends in Pakistan. Journal of Hydrology, 492: 266-272. https://doi.org/10.1016/j.jhydrol.2013.03.040
[15] Kaplan, R.D. (2010). South Asia's geography of conflict. Washington, DC: Center for a New American Security.
[16] Hassan, F., Chaudhry, M.U., Yasir, M., Asghar, M.N., Sarkodie, S.A. (2021). Monitoring the impact of COVID-19 lockdown on the production of nitrogen dioxide (NO2) pollutants using satellite imagery: A case study of South Asia. Sustainability, 13(13): 7184. https://doi.org/10.3390/su13137184
[17] Kamran, M., Malik, Z., Parveen, A., Zong, Y., Abbasi, G.H., Rafiq, M.T., Shaaban, M., Mustafa, A., Bashir, S., Rafay, M., Mehmood, S., Ali, M. (2019). Biochar alleviates Cd phytotoxicity by minimizing bioavailability and oxidative stress in pak choi (Brassica chinensis L.) cultivated in Cd-polluted soil. Journal of Environmental Management, 250: 109500. https://doi.org/10.1016/j.jenvman.2019.109500
[18] Metya, A., Dagupta, P., Halder, S., Chakraborty, S., Tiwari, Y.K. (2020). COVID-19 lockdowns improve air quality in the South-East Asian regions, as seen by the remote sensing satellites. Aerosol and Air Quality Research, 20(8): 1772-1782. https://doi.org/10.4209/aaqr.2020.05.0240
[19] Rao, B.S. (2020). Dynamic histogram equalization for contrast enhancement for digital images. Applied Soft Computing, 89: 106114. https://doi.org/10.1016/j.asoc.2020.106114
[20] Butt, O.M., Ahmad, M.S., Che, H.S., Rahim, N.A. (2021). Usage of on-demand oxyhydrogen gas as clean/renewable fuel for combustion applications: A review. International Journal of Green Energy, 18(3): 1405-1429. https://doi.org/10.1080/15435075.2021.1904944
[21] Keller, C.A., Evans, M.J., Knowland, K.E., Hasenkopf, C.A., Modekurty, S., Lucchesi, R.A., Oda, T., Franca, B.B., Mandarino, F.C., Suárez, M.V.D., Ryan, G., Fakes, L.H., Pawson, S. (2021). Global impact of COVID-19 restrictions on the surface concentrations of nitrogen dioxide and ozone. Atmospheric Chemistry and Physics, 21(5): 3555-3592. https://doi.org/10.5194/acp-21-3555-2021
[22] Mengmeng, C., Shirong, Z., Lipeng, W., Chao, F., Xiaodong, D. (2021). Organic fertilization improves the availability and adsorptive capacity of phosphorus in saline-alkaline soils. Journal of Soil Science and Plant Nutrition, 21(1): 487-496. https://doi.org/10.1007/s42729-020-00377-w
[23] Barabanov, N.E., Ungar, A.A. (2020). Differential geometry and binary operations. Symmetry, 12(9): 1525. https://doi.org/10.3390/sym12091525
[24] Manisalidis, I., Stavropoulou, E., Stavropoulos, A., Bezirtzoglou, E. (2020). Environmental and health impacts of air pollution: A review. Frontiers in Public Health, 8: 14. https://doi.org/10.3389/fpubh.2020.00014
[25] Khanan, F., Nowrin, I., Mondal, M. (2020). Data visualization and analyzation of COVID-19. J Sci Res Rep., 26(3): 42-52. https://doi.org/10.9734/jsrr/2020/v26i330234
[26] Khan, K.A., Mubbin, M., ul Haq, M.I., et al. (2020). Air quality index with particulate matter (PM2. 5) improved after national lockdown during COVID-19 outbreak across Pakistan. Open Access Journal of Biogeneric Science and Research, 3(2): 1-6. https://dx.doi.org/10.46718/JBGSR.2020.03.000065