Modeling of SO2 and CH4 Emission Distribution in the Area Mataloko Geothermal Power Plant, East Nusa Tenggara, Indonesia

Sulaiman Abdullah | Sumarno | Amin Setyo Leksono | Sudarto | Sudirman Syam*
© 2021 IIETA. This article is published by IIETA and is licensed under the CC BY 4.0 license (http://creativecommons.org/licenses/by/4.0/).
OPEN ACCESS
The Mataloko geothermal system in Ngada-Flores Regency, East Nusa Tenggara, is located in three active volcanic mountains (Inerie, Ebulobo, and Inielika). The contribution of high levels of CH4 and exhaust emissions of SO2 due to its utilization as a geothermal power plant (GPP) impacts the environment. This study aims to analyze and spatially model the distribution and impact of SO2 and CH4 gas levels in the Mataloko GPP area. The quantitative descriptive method was used through direct measurement at gas wells and laboratory testing. The results showed a tendency to increase SO2 levels in the MT-4 gas-well with levels of 8.00 ppm exceeding the quality standard, which could disturb the environment in the Mataloko-GPP area. Impact of high SO2 will experience dry sediment because it is not combustible in the air, then it will drop slowly to be absorbed by soil and plants. Droplets of acid gas blown by the wind and left on trees and buildings are even inhaled into the breath. In addition, the advantages of model with surfer 12 software can help identify the distribution of SO2 and SO4 emissions in the generating area.
sulfur dioxide, methane gas, emissions, renewable energy, geothermal wells
Nowadays, the demand for electrical energy is not proportional to the increase in electrical energy supply. In the 2018-2050 decade, it is estimated that only 50% of energy demand can be met, while industrial and population growth is increasing [1]. Most of these energy needs are met by fossil fuels, causing a detrimental impact on the environment. By burning fossil fuels, harmful gases are released into the atmosphere, which threatens human health and causes climate change due to increased levels of greenhouse gases [2]. On the other hand, the installed capacity is still fixed, while the community's needs continue to grow following the population growth and supporting activities [3]. As one of the countries with the largest population globally, Indonesia has energy needs that grow every year [4]. East Nusa Tenggara is one of Indonesia's provinces that generally use diesel power plants (DPP). This area has a fairly low level of rainfall so that it does not have the potential to build a hydropower plant (HPP). On the other hand, this area has great geothermal energy potential or geothermal power plants (GPP) due to volcanic pathways crossing this region [5].
Mataloko, Ngada City, Flores is one of East Nusa Tenggara's regencies with geothermal potential [6]. The Mataloko geothermal system is located in an active volcanic environment, including Inerie, Ebulobo, and Inielika volcanoes associated with the tectonic setting of "Banda Arc." The Mataloko geothermal system is controlled by the Wai Luja fault's main structure, which is relatively northwest-Southeast. The Mataloko geothermal system's heat source comes from young magmatic activity trapped in structures that develop as dykes and sills. According to [7], this system has an up-flow zone in the Wai Luja fault. In addition, Indonesia is geologically located at the confluence of three major tectonic plates, namely the Europe-Asia, India-Australia, and the Pacific Plate. It plays a role in the formation of volcanoes in Indonesia. Geothermal potential areas in Indonesia are generally located in volcanic mountain areas, surrounded by protected forests, conservation forests, and nature reserves, with a surface area mostly covered by vegetation [8, 9]. This condition has been described by Muraoka et al. [10]; the tectonic, volcanic, and stratigraphic geology of the Bajawa area contains a collective cinder cone called the Bajawa Cone Complex. On January 11-16, 2001, the phreatomagmatic eruption showed potential as a geothermal resource in the Indie Lika volcano, Flores Island [11]. This cinder cone is produced from volcanic processes, tectonic processes in the zone, representing the Bajawa fracture zone [10].
In this connection, geothermal is renewable and sustainable energy when it is managed properly [12]. Geothermal is a renewable energy source that can be used directly for heating and electricity production [9, 13]. However, according to the Ref. [14], geothermal energy can produce several greenhouse gases (GHG) emissions as a source of electrical energy. Geothermal energy can produce environmental impacts that are very site-specific due to the nature of the resource and its geological characteristics [15]. Geothermal steam flowing in power generation systems contains non-condensable gas (NCG). Apart from the level of emissions produced, the amount of NCG in geothermal steam also significantly affects power plants' production performance. For example, high heat transfer to the condenser creates a 'gas blanket effect, increases condenser temperature and backpressure in the turbine, and reduces output power. In practice, the gas effect can only be overcome by evacuating using a portion of the main vapor. The NCG released by geothermal power plants into the outside environment contains carbon dioxide, hydrogen sulfide, methane, and ammonia [16].
Likewise, Mataloko GPP, regarding residential areas, needs special attention. Currently, the Mataloko GPP has of 2.5 MW from the 63 MW of available energy potential. Meanwhile, the energy that has been used as electrical energy by the State Electricity Company or PLN (Indonesia language) is 1.5 MW [17]. According to [18], several GPP environmental impact elements need to be evaluated. These elements have been classified with certain thresholds, respectively, such as the value of GWP (380–1045kg CO2 eq/MWh), ACP (0.1-44.8kg SO2 e/MWh), and HTP (1.1–31,6 kg 1.4 DB eq/MWh). The main contribution of this impact is the high content of NH3, H2S, CH4, and CO2 [19]. Geothermal energy used as electrical energy will produce H2S emissions and turn into SO2 pollution after being released into the atmosphere [20]. In addition, GPP also produces CO2 and CH4 emissions. In general, GPP's carbon emissions are lower than fossil fuel power plants such as coal or gas (14-16). However, although GPP has only about 400g CO2/kWh (depending on location and technology conversion) [21], it still has an impact on the environment and contributes to climate change [22]. In some cases, it was found that the emission impact of GPP is higher than that of fossil fuel plants of the same power [18].
Particular attention is paid to CO2 and CH4 gas emissions from the PLTG Mataloko as a GHG producer. Although CO2 is the most abundant GHG, generally CH4 gas is also present, but its concentration is small. However, due to its relatively strong global warming potential, CH4 can contribute significantly to GHG emissions from GPP. CH4 emission data from GPP are not always available for all systems for which CO2 emission data are available. As a result, it is not easy to assess the contribution of CH4 to GHG emissions from GPP production [14]. Apart from work related GHG, surprisingly, there seems to be little attention paid to the Mataloko GPP impact. There is a growing awareness of the need for environmental protection, particularly a healthy ecological environment. Given the growing popularity of renewable energy sources, they must understand their environmental impact. Renewable energy sources have a smaller environmental impact when compared to the effect of conventional fuels on the environment [21]. Several mitigation measures to control pollution caused by GPP and some new technologies are discussed [22]. One of them is air pollution due to thermal power generation such as particulate matter, gas emissions - sulfur dioxide, nitrogen oxides, carbon monoxide, carbon dioxide, hydrocarbons.
Regarding the Mataloko GPP, a direct measurement strategy is needed to determine the impact of power plants on the distribution of SO2 and CH+4 levels. Several direct measurement methods have been carried out, such as the gas dispersion method [23], SIMAK Pro 2012, and CML 2002 software [18], transect method, and statistical analysis [24], and land-use regression, LUR [25]. Prediction modeling of CO2 dispersion with analog and digital measurements by observing CO2 gas concentrations [26], GIS method with the Normalized Difference Vegetation Index (NDVI) approach, and the use of GIS to explore changes in land cover dynamics [27, 28]. Furthermore, Nishar et al. [29] monitored the power plant environment using a small-scale UAV drone, equipped with a blade 350 QXD type quadcopter with a five-channel DX5e spectrum. Meanwhile, Richter et al. [30] performed volcanic gas field measurements using middle IR difference frequency laser spectroscopy. In this study, direct measurements used the Single Impinger tool to capture SO2 gas and CH4 gas in the GPP area. Laboratory testing with an Arduino microcontroller-based gas meter and pararosanilin method to measure CH4 and SO2 gas levels. In addition, a spatial model approach with ArcGIS 10.3 simulation is used to model the distribution pattern of SO2 and CH4 pollution.
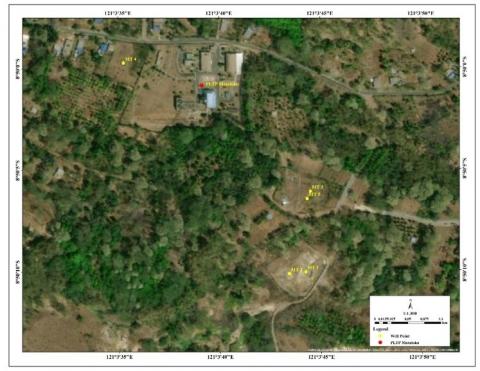
Figure 1. Administrative map of Ngada Regency
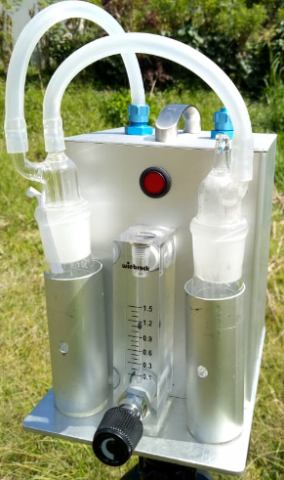
Figure 2. Single Impinger
Description: MT-1 (Gas-well of Mataloko 1); MT-2 (Gas-well of Mataloko 2); MT-3 (Gas-well of Mataloko 3); MT-4 (Gas-well of Mataloko 4); MT-5 (Gas-well of Mataloko 5)
Figure 3. Gas-well points for the Mataloko GPP area
This study was conducted in the Mataloko GPP, Ngada Regency, Flores, NTT. The Mataloko GPP area is 996.2 ha, with a population of 132,716 [31]. As shown in Figure 1, Ngada Regency stretches between 8020'24.28"S - 8057'28.39"S (South) and 120048"E - 121011"E (East). Geographically, the Nagekeo region borders Nagekeo Regency (East), East Manggarai Regency (West), Flores Sea (North), and Sawu Sea (South). Ngada Regency has of 1,776.72 km², a water area of 708.64 km², and a long beach of 102.318 km2 [32]. The quantitative descriptive method was used through direct observation and measurement at gas-wells and laboratory testing. The aim is to analyze and spatially model the distribution and impact of SO2 and CH4 gas levels in the GPP Mataloko area. Firstly, data collection for measuring SO2 gas using a single impinger tool is shown in Figure 2. Then, testing CH4 levels using a CH4 gas sensor based on the Arduino microcontroller (V3.0). The SO2 and CH4 gas measurements were carried out in three GPP with five gas wells, such as MT-1 and 2 (GPP-1), MT-3 and 5 (GPP-2), and MT-4 (GPP-3), respectively. Figure 3 shows a map of the location of the five Mataloko gas wells. Measurement of samples with a cluster system at a radius of 20m, 50m, 150m during the day with an average of 1 hour at the same time. Secondly, SO2 and CH4 gases' storage results were analyzed using a spectrophotometer with the pararosaniline method. Furthermore, linear regression analysis was carried out to obtain the effect of SO2 and CH4 gas emissions using SPSS (statistical product and service solutions) software. Finally, data analysis results are integrated into surfer 12 software to obtain SO2 and CH4 gas distribution models.
3.1 Measurement of sulfur gas (SO4) and methane gas (CH4)
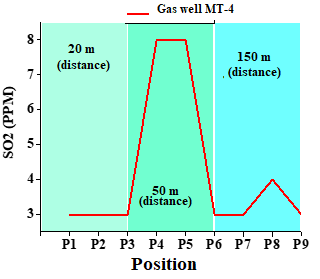
3.1.1 MT-4 gas-well
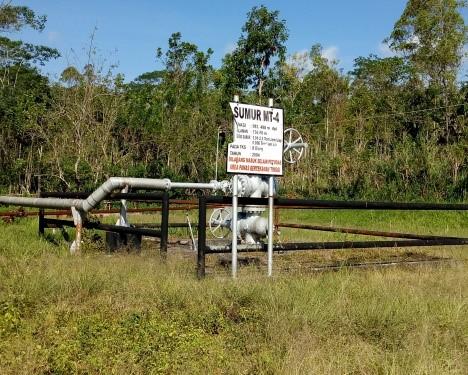
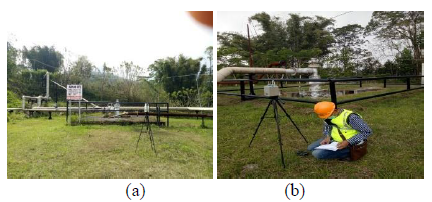
The MT-4 gas-well is located at S.08.8332° (South) and E.121.05999° (East) with about 700m from the Mataloko GPP and Maintenance Office. Sampling was carried out with a 20° -30℃ weather humidity starting at 8.00 AM – 2 PM. The land structure is flat, overgrown with grass, and surrounded by trees, as shown in Figure 4.
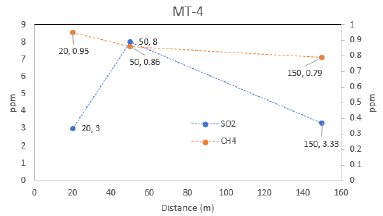
In this study, SO2 and CH4 gases were measured three times at different distances simultaneously. Figure 5 shows the measurement results of the two gases with different gas-well distances. It can be seen that at a distance of 20m, the average sulfur content is 3.00 ppm, while at 150m, the average sulfur content is 3.33 ppm. In contrast to gas wells, at a distance of 50m, the sulfur content is very high at 8.00 ppm because it is located very close to GPP. According to the Minister of Environment Regulation no. 21 of 2008 concerning immovable source emission-quality standards (ISEQS) for thermal power plant businesses (TPPB), emission testing results must be in mg/m3 units. Because the SO2 emission test data obtained are in ppm units, the SO2 emission value obtained is converted into mg/m3 units using Eq. (1) or (2) as follows:
$C\left(\mathrm{mg} / \mathrm{m}^{3}\right)=C(p p m) \frac{B m}{22400} \times \frac{273}{273+t} \times \frac{P}{760}$ (1)
(Assuming that conditions are 25℃, the pressure of 1 atmosphere is equal to 760 mmHg).
or:
$C\left(\mathrm{mg} / \mathrm{m}^{3}\right)=\frac{\text { concentration }(\mathrm{ppm}) \times \mathrm{Bm}}{24.45}$ (2)
where: Bm = molecular weight,
P = pressure in the atmosphere.
We have a molecular weight of SO2 64.066g/mol. The conversion of SO2 emissions for three different distances in the MT-4 gas well was 7.86 mg/m3 for 20m, 8.73 mg/m3 for 50m, and 20.96 mg/m3 for 150m, respectively.
On the other hand, the measurement of CH4 at a distance of 20m with the position (S.08.833260, E.121.060030) has the highest value of 1.17 ppm (0.77 mg/m3). It is the highest emission value among the three measurements because it is very close to the gas well. Meanwhile, emissions at a distance of 50m and 150m are 0.86 ppm (0.56 mg/m3) and 0.79 ppm (0.52 mg/m3). Since the two measurement positions are further away from the gas location, the value is small. Figure 6 shows the measurement curve of SO2 and CH4 levels in the MT-4 gas well.
Figure 4. MT-4 gas-well
Figure 5. SO2 and CH4 level vs gas-well distance
Figure 6. Curve measurement of SO2 levels at the MT-4 gas-well
Information:
3.1.2 MT -3 and MT-5 gas-wells
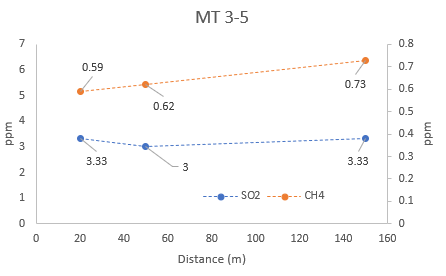
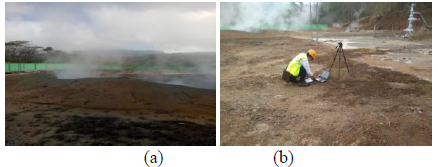
The MT-3 and MT-5 gas-wells are in the same location at S.08.834510 and E.121.06230. Both are located in a hilly area and are overgrown with grass surrounded by tall trees higher than the MT-4 gas well. Figure 7 shows MT-3 and MT-5 gas-wells position and condition.
As shown in Figure 8, the average SO2 level measurement for both gas-wells were classified as low between 3.00 ppm (7.86 mg/m3) and 3.33 ppm (8.73 mg/m3). That is the same as the SO2 levels measured in the MT-4 gas-well at a distance of 20m and 150m. Likewise, the measurement of CH4 is low for the three measurement distances. At a distance of 20m, 50m, and 150m obtained methane gas levels of 0.59 ppm (0.39 mg/m3), 0.62 ppm (0.41 mg/m3), and 0.73 (0.48 mg/m3), respectively. The position area is at S.08.835160 and E.121.062480, with the measurement curves on MT-3 and MT-5 gas-wells as shown in Figure 9.
Figure 7. Gas-wells: (a) MT-3 and, (b) MT-5
Figure 8. Measurement of SO2 and CH4 levels in MT-3 and MT-5 gas-wells
Figure 9. Curve for measuring SO2 levels in MT-3 and MT-5 gas-wells
3.1.3 MT-1 and MT-2 gas-wells
The location of the MT-1 and MT-2 gas-wells is lower than with the MT-4. Both wells are located behind the MT-4 gas-well, which is 1 km from the Mataloko GPP. Figure 10 shows the measurement conditions of both MT-1 and MT-2 gas-wells.
Measurement of SO2 and CH4 gas in the MT-1 and MT-2 gas-wells is shown in Figure 11. Similarly, for the two gas wells close to GPP, for a slightly higher distance of 50m, the SO2 gas emission is 4.67 ppm. Compared to the distance of 20m is 3.33 ppm, and 150m is 3.00 ppm. Measurements were made at positions S.08.83679° and E.121.06236°. The curves of measuring SO2 levels in MT-1 and MT-2 gas-wells are shown in Figure 12. In particular, the measurement of CH4 gas emissions at the three measurement distances shows a low level of 0.65 ppm (0.43 mg/m3), 0,61ppm (0.4 mg/m3), and 0.67 ppm (0.44 mg/m3), respectively.
Figure 10. Gas-well: (a) MT-1; (b) MT-2
Figure 11. Measurement of SO2 levels in MT-1 and MT-2 gas-wells
Figure 12. Curves for measuring SO2 levels in MT-1 and MT-2 gas-wells
3.2 Effect of gas-well distance on emission levels of SO2 and HC4
A total of 27 samples of sulfur dioxide from three GPP locations with five gas wells have been tested in the laboratory and analyzed using SPSS software. In statistics, a probability value of p < 0.05 indicates a valid instrument and a p-value > 0.05 is declared invalid. Table 1 shows a linear regression analysis of the relationship between the five gas wells and the level of SO2 emissions. Based on the table, the p-values for the gas well distances MT-4, MT 3-5, MT 1-2 are 0.694 (20 m), 0.774 (50 m), and 0.341 (150 m), respectively. It means that the p-value > 0.05 is invalid, indicating no significant relationship between the five gas wells and the level of SO2 gas emissions. Furthermore, the levels of SO2 gas emissions for each distance from the three gas-well are 4.64, 3.16, and 4.12 ppm. (Except, there is no distance variable). However, this equation reveals that for every 1 unit increase in distance, there will be a decrease in SO2 emission levels. Changes in SO2 emission levels were 0.006, 0.001, and 0.006 ppm, respectively. In addition, based on these results, it proves that the level of SO2 emissions increases at a measurement distance of 20 m due to the proximity of the MT-4 gas well and GPP. On the other hand, SO2 gas emissions are small for other gas wells because they are far from the GPP location (Figure 6).
Table 1. Relationship of well distance to SO2 levels
|
No. |
Gas-well |
Linear regression (y=ax+b) |
P- Value |
|
|
|
b |
a |
|
|
|
1. |
MT-4 |
4.64 |
- 0.006 |
0.694 |
|
2. |
MT -3 and MT-5 |
3.16 |
- 0.001 |
0.774 |
|
3. |
MT-1 and MT-2 |
4.12 |
- 0.006 |
0.341 |
3.3 Effect of gas-well distance on levels of SO2 and HC4
The same analysis (Table 2) shows that the p-values of the five gas wells are 0.266 (MT-4), 0.076 (MT-3 and MT-5), and 0.466 (MT-1 and MT-2). Here, there is no significant relationship between gas well distance and CH4 gas levels. All CH4 level measurements are p-values exceeding 0.05. The linear regression approach also shows that CH4 gas emissions will change when there is no distance variable, except for MT-1 and MT-2 gas-wells. CH4 gas level remains 0.627 ppm because there is no distance or zero variable. In particular, the MT-1 and MT-2 gas wells do not add methane gas because they are far from GPP. In contrast, both gas wells experienced a decrease (MT-4, sign (-), and an increase (MT-3 and 5, (sign (+) of CH4 gas emissions of 0.001 ppm. (There is a distance variable that influences it).
Table 2. Relationship of gas-well distance to CH4 levels
|
No. |
Gas-well |
Linear regression (y=ax+b) |
P-Value |
|
|
|
b |
A |
|
|
|
1. |
MT-4 |
0.934 |
-0.001 |
0.266 |
|
2. |
MT-3 and MT-5 |
0.572 |
0.001 |
0.076 |
|
3. |
MT-1 and MT-2 |
0.627 |
0.000 |
0.466 |
3.4 Model of SO2 gas emission distribution
Figures 13 to 15 briefly show the model of the distribution of the concentration of SO2 gas emissions in the Mataloko GPP. Surfer 12 software was used to create visualizers with 2-dimensional (2-D) and 3-dimensional models (3-D).
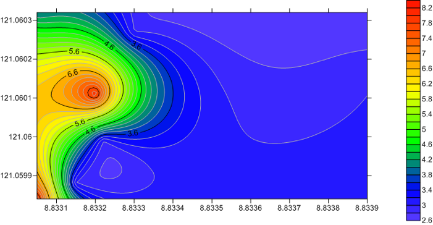
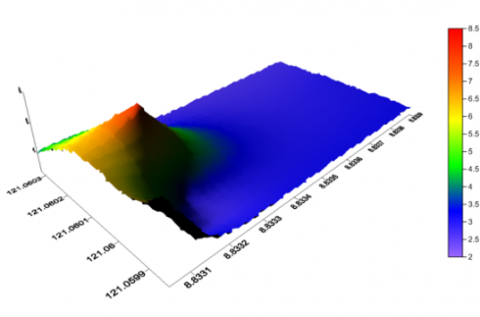
3.4.1 Distribution of SO2 gas emissions in MT-4 gas-wells
Based on Figures 13 (a) and (b), it can be seen that there are five color zones visualized both with 2-D and 3-D. The red zone indicates that the area has the highest SO2 emission concentration with a distribution value of 8.2 ppm (21.29 mg/m3). That is due to its location very close to the MT-4 gas-well and the Mataloko GPP. In addition, it can be seen that the farther from the point of observation, the smaller the value of the concentration of SO2 gas emissions. In contrast, the purple zone is the lowest emission distribution of 2.6 ppm (6.97 mg/m3).
(a)
(b)
Figure 13. Model of SO2 emission distribution in the MT-4 gas-well (a) 2-D; (b) 3-D
(a)
(b)
Figure 14. Model of SO2 emission distribution in the MT-3 and MT-5 gas-wells: (a) 2-D; (b) 3-D
(a)
(b)
Figure 15. Model of SO2 emission distribution in the MT-1 and MT-2 gas-wells: (a) 2-D; (b) 3-D
3.4.2 Distribution of SO2 gas emissions in MT-3 and MT-5 gas-wells
Figures 14 (a) and (b) show that the green color is concentrated in the two zones. They show that the two gas-well areas (MT-3 and MT-5) are adjacent to moderate SO2 emission levels. These two gas-wells located higher than the Mataloko GPP produce SO2 gas emissions of 4 ppm or 10.48 mg/m3. In addition, the level of color density with the contour lines closer to the two gas wells indicates that a lot of pollutant smoke has accumulated in the area.
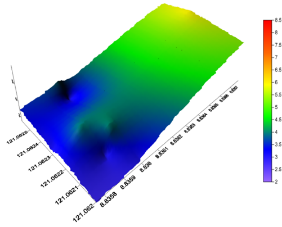
3.4.3 Distribution of SO2 gas emission in MT-1 and MT-2 gas-wells
In particular, in the MT-1 and MT-2 gas-well areas, there are large natural gas-wells. That causes a high concentration of SO2 in the area. It can be seen that the SO2 distribution model is in the form of 2-D and 3-D, as shown in Figures 15. Here, an increasingly yellow color indicates a higher distribution value of 6 ppm or 15.72 mg/m3. On the other hand, the purple zone is the lowest gas emission distribution value of 2.6 ppm (6.82 mg/m3).
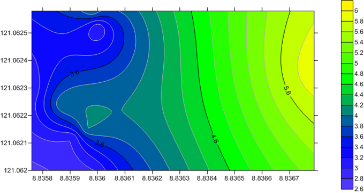
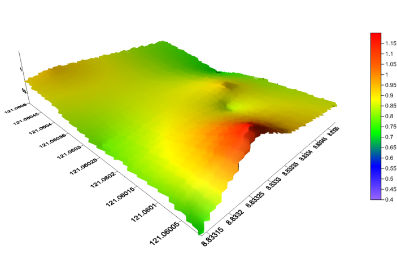
3.5 Model of CH4 gas emission distribution
Similarly, the distribution of CH4 gas levels from the Mataloko GPP is shown in Figures 16 up 19, respectively. By visualizing in the 2-D and 3-D models, the distribution of the concentration of emissions from CH4 gas can be analyzed.
3.5.1 Distribution of CH4 gas emissions in MT-4 gas-wells
The distribution of CH4, which is very clear with the contour lines, is getting closer to the MT-4 gas-well area. Figure 16 shows the distribution of CH-4 in 2-D and 3-D models. It can be seen that there are many pollutant smoke puffs in the zone which are marked by dense contour lines. Both gas-wells have the highest CH4 gas emission concentration of 1.18 ppm (0.77 mg/m3), marked red. On the other hand, the lowest concentration of CH4 emission distribution is indicated by a greener color of 0.7 ppm (0.46 mg/m3). The high distribution of CH4 gas emissions is due to the proximity of the MT-4 gas-well and the Mataloko GPP.
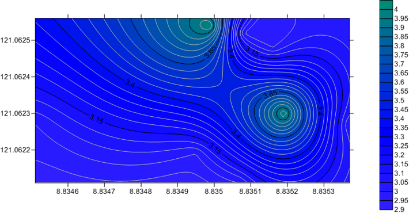
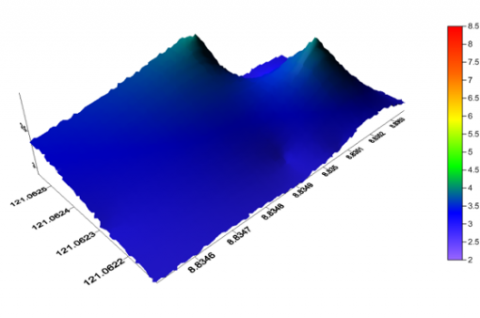
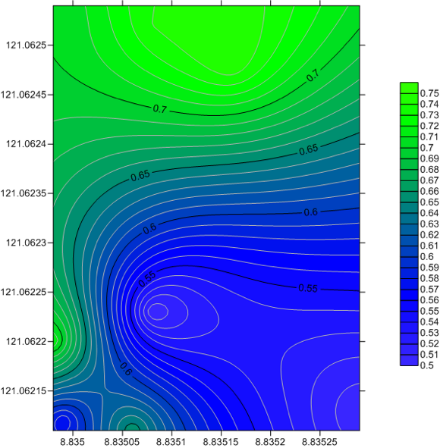
3.5.2 Distribution of CH4 gas emissions in MT-3 and MT-5 gas-wells
Based on Figure 17, the distribution of CH4 gas emissions shows a moderate level marked by a greener color of 0.75 ppm (0.49 mg/m3). The concentration of CH4 gas emissions in MT-3 and MT-5 gas wells increases because the two wells are very close together. Thus, the two of them will mutually contribute to the large concentration of CH4 gas emissions. Also, it can be seen that the contour line density also shows the concentrations of CH4 emissions accumulating in the area closest to the two gas sources.
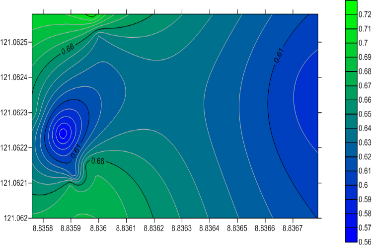
3.5.3 Distribution of CH4 gas emissions in MT-1 and MT-2 gas-wells
The same thing also happened to the MT-1 and MT-2 gas-wells, with the concentration of CH4 gas emissions classified as moderate. Figures 18 (a) and (b) show an increasingly green zone in the area of the two gas wells. The concentration value of CH2 gas emissions from the two gas wells will increase because there are large natural wells around the area. As seen in Figure 17, the highest distribution in both gas wells is 0.72 ppm or 0.47 mg/m3. Meanwhile, the farther the point of observation, the smaller the concentration of CH4 gas emissions. The blue area indicates that with the lowest distribution value of 0.56 ppm or 0.37 mg/m3.
(a)
(b)
Figure 16. Model of CH4 emission distribution in MT- 4 gas-well: (a) 2-D; (b) 3-D
(a)
(b)
Figure 17. Model of CH4 emission distribution in MT-3 and MT-5 gas-wells: (a) 2-D; (b) 3-D
(a)
(b)
Figure 18. Model of CH4 emission distribution in MT-1 ad MT-2 gas-wells: (a) 2-D; (b) 3-D
3.6 Discussion
SO2 is a non-flammable, colorless gas at concentrations from 0.1 to 1.0 ppm in air. According to [33], SO2 gas with a concentration greater than 3.00 ppm (7.86 mg/m3) has a strong odor. This paper's highest SO2 level measurement was 8,00 (20.96) mg/m3 or a value exceeding 3.00 ppm. It means that the distribution of SO2 gas in the power plant area is classified as high concentration. This condition can cause respiratory problems for children and adults, and it can form compounds that cause corrosion and damage plants [34]. In addition, the high emission of SO2 gas can damage vegetation, freshwater lakes, and ecosystem streams. The paper [35] explains that decreasing species diversity and abundance can create hazy environmental conditions. As a result, the emission of SO2 gas will enter the leaves and plant cells and convert them into sulfites. When SO2 is excessive, cells cannot oxidize sulfites to sulfates quickly, resulting in cell structure disruption. Spinach, lettuce, and other leafy vegetables are the most sensitive [36].
On the other hand, the interaction between GPP and the surrounding environment needs to be considered in one cycle. Such as the impact of power plants on the environment and vice versa the environmental impact on power plants. Environmental damage means a reduction in the carrying capacity of nature, which will reduce the quality of human life. For example, (1) surface disturbance, (2) physical impact of fluid withdrawal; (3) noise; (4) thermal effects, (5) chemical pollution; (6) biological effects; and (7) impact on the protection of natural features [37]. In addition, land clearing, groundwater table subsidence, and the effect of high temperatures in rivers, lakes, and groundwater can disrupt environmental cycles. Chemical pollution due to the emission of unconditioned atmospheric gases and saltwater discharge into surface or subsurface water bodies can disturb wildlife, plants, and the socio-economic environment around geothermal power plants. Furthermore, equipment and material degradation, corrosion, and scale in the plant and its environment must be monitored. The aim is to protect and maintain power plants and their environment [38].
Next, air pollution has several elements that need attention. These elements include dust, sulfur oxides, carbon monoxide, nitrogen oxides, and methane. Some of these elements are released by pollutants that can disrupt air quality. Ambient air is free air that is on the surface of the earth in the troposphere in several gases such as sulfur dioxide (SO2), hydrogen sulfide (H2S), and carbon monoxide (CO). These gases are always released into the air due to natural processes such as volcanic activity, decomposing plant waste, and forest fires [39]. Based on visual analysis, the highest SO2 gas emissions distribution is at the location of the MT-4 gas-well, which is adjacent to the Mataloko GPP. The value of 8.2 ppm is slightly higher or closer to the same as the measurement result with a value of 8.00 ppm.
Likewise, the distribution of CH4 gas visually obtained 1.18 ppm, while the measurement results were obtained at a temperature of 0.95 ppm. This indication shows that the distribution of SO2 and CH4 gas emissions are increasing. The amount of SO2 gas pollutants in the air varies greatly depending on the season and weather conditions. On the other hand, in Ref. [40], explained that 6 -12 ppm, SO2 is easily absorbed by the upper respiratory tract's mucous membranes. Of course, a greater concentration of SO2 occurs in mucus production in the upper respiratory tract. Because the levels increase again, it will cause a severe inflammatory reaction in the mucous membrane accompanied by ciliary paralysis and damage to the epithelial layer [41].
Furthermore, the high acid gas SO2 faces two possibilities while in the air. First, some of the SO2 will fall and be slowly absorbed by the soil and plants before both undergo a process of oxidation by sunlight known as dry deposition. That can occur around the location of the emission source or other places that are relatively very far from the emission source because SO2 is not flammable in the air. In addition, the weather conditions are sunny and cloudy, so that droplets of gas and aerosols that are acidic are blown away by the wind and allow to be left in trees, buildings, and even inhaled into the breath. With the help of sunlight energy, the acidic gases will undergo an oxidation process so that these materials in the air can form secondary pollutants.
In this study, several important conclusions were obtained as follows:
The authors would like to acknowledge the Chemical Laboratory of the University of Nusa Cendana, Kupang, and support of BUDI-LPDP scholarship from the Ministry of Research Technology and Higher Education.
|
ACP |
acidification |
|
Bm |
molecular weight |
|
DPP |
diesel power plant |
|
GWP |
global warming |
|
GPP |
geothermal power plant |
|
GHG |
greenhouse gases |
|
HPP |
hydro power plant |
|
HTP |
human toxicology |
|
ISEQS |
immovable source emission quality standards |
|
MT-1 |
Mataloko-1 |
|
MT-2 |
Mataloko-2 |
|
MT-3 |
Mataloko-3 |
|
MT-4 |
Mataloko-4 |
|
MT-5 |
Mataloko-5 |
|
NCP |
non-condensable gas |
|
ppm |
parts per million |
|
P |
pressure in the atmosphere |
|
TPPB |
thermal power plant businesses |
[1] EIA. (2019). Internaltional energy outlook 2019. U.S. Energy Inf. Adm., 9: 25-150.
[2] Turkdogan, S. (2020). Design and optimization of a solely renewable based hybrid energy system for residential electrical load and fuel cell electric vehicle. Engineering Science and Technology, an International Journal, 24(2): 397-404. https://doi.org/10.1016/j.jestch.2020.08.017
[3] Peterson, E.W.F. (2017). The role of population in economic growth. SAGE Open, 7(4). https://doi.org/10.1177/2158244017736094
[4] Gielen, D., Saygin, D., Rigter, J. (2017). Renewable energy prospects: Indonesia. ISBN 1026-1141.
[5] Aditya, A. (2017). Mataloko geothermal power plant development strategy in order to maintain the sustainability of supply and demand electric energy in Kupang, East Nusa Tenggara (A system dynamics framework). J. Geosci. Eng. Environ. Technol., 2(3): 224. https://doi.org/10.24273/jgeet.2017.2.3.488
[6] Fauziyah, Y.H., Daud, Y. (2019). Reconstruction of conceptual model in Mataloko geothermal field (Nusa Tenggara Timur). J. Phys. Conf. Ser., 1341(8). https://doi.org/10.1088/1742-6596/1341/8/082042
[7] Takahashi, H., Otake, M., Tagomori, K., Sueyoshi, Y., Futagoishi, M., Nasution, A. (2000). Geothermal geology of the Mataloko area, Central Flores, Nusa Tenggara, Timur, Indonesia. Proc. World Geotherm. Congr., pp. 1803-1806.
[8] Muraoka, H., Nasution, A., Urai, M., Takahashi, M., Takashima, I. (2002). Geochemistry of volcanic rocks in the Bajawa geothermal field, Central Flores, Indonesia, Bull. Geol. Surv. Japan, 53(2-3): 147-159. https://doi.org/10.9795/bullgsj.53.147
[9] Suharmanto, P., Fitria, A.N., Ghaliyah, S. (2015). Indonesian geothermal energy potential as source of alternative energy power plant. KnE Energy, 1(1): 119. https://doi.org/10.18502/ken.v1i1.325
[10] Muraoka, H., et al. (2002). Tectonic, volcanic and stratigraphic geology of the Bajawa geothermal field, Central Flores, Indonesia. Bull. Geol. Surv. Japan, 53(2-3): 109-138. https://doi.org/10.9795/bullgsj.53.109
[11] Muraoka, H., Yasukawa, K., Urai, M., Takahashi, M., Nasution, A., Takashima, I. (2002). 2001 fissure-forming eruption of Inie Lika volcano, Central Flores, Indonesia. Bull. Geol. Surv. Japan, 53(2-3): 175-182. https://doi.org/10.9795/bullgsj.53.175
[12] Fauzi, A., Bahri, S., Akuanbatin, H. (2000). Geothermal development in Indonesia: An overview of industry status and future growth. Proc. World Geotherm. Congr. 2000, Kyushu-Tohoku, Japan, pp. 1109-1114.
[13] Aki Suwa, A.S., Takemae, Y., Jupesta, J. (2012). Indonesia geothermal backcasting analysis: A methodological proposal for policy planning. 1-12.
[14] Fridriksson, T., Mateos, A., Audinet, P., Orucu, Y. (2016). Greenhouse gases from geothermal power production. Greenh Gases from Geotherm. Power Prod. https://doi.org/10.1596/24691
[15] Ferrara, N., Basosi, R., Parisi, M.L. (2019). Data analysis of atmospheric emission from geothermal power plants in Italy. Data Br., 25: 104339. https://doi.org/10.1016/j.dib.2019.104339
[16] Bošnjaković, M., Stojkov, M., Jurjević, M. (2019). Environmental impact of geothermal power plants. Teh. Vjesn., 26(5): 1515-1522. https://doi.org/10.17559/TV-20180829122640
[17] Sukarna, D. (2012). Development of geothermal policies, Potential Resources and Implementation Target. Indo EBTKE Conference and Exhibition Jakarta.
[18] Bravi, M., Basosi, R. (2014). Environmental impact of electricity from selected geothermal power plants in Italy. J. Clean. Prod., 66: 301-308. https://doi.org/10.1016/j.jclepro.2013.11.015
[19] Schütz, F., Spalek, E. (2013). Deliverable n° 4.6 geothermal electricity: Potential for CO2 mitigation. Available: http://www.geoelec.eu/wp-content/uploads/2014/02/D4.6.pdf.
[20] Sulaiman, A., Leksosmno, A.S. (2020). Sulfur dioxide concentration and land cover change from geothermal power plants in Mataloko, Flores Indonesia. Technology Reports of Kansai University, 62(09): 5227-5239.
[21] Niknam, P.H., Talluri, L., Fiaschi, D., Manfrida, G. (2021). Sensitivity analysis and dynamic modelling of the reinjection process in a binary cycle geothermal power plant of Larderello area. Energy, 214: 118869. https://doi.org/10.1016/j.energy.2020.118869
[22] Aguilar-Dodier, L.C., Castillo, J.E., Quintana, J.E., Montoya, D., Molina, T., Zavala, M., Almanza-Veloz, V., Rodríguez-Ventura, J.G. (2020). Spatial and temporal evaluation of H2S, SO2 and NH3 concentrations near Cerro Prieto geothermal power plant in Mexico. Atmospheric Pollution Research, 11(1): 94-104. https://doi.org/10.1016/j.apr.2019.09.019
[23] Somma, R., Granieri, D., Troise, C., Terranova, C., De Natale, G., Pedone, M. (2017). Modelling of hydrogen sulfide dispersion from the geothermal power plants of Tuscany (Italy). Sci. Total Environ., 583: 408-420. https://doi.org/10.1016/j.scitotenv.2017.01.084
[24] Mutia, T.M. (2016). The impacts of geothermal power plant emissions on terrestrial ecosystems in contrasting bio-climatic zones. https://hdl.handle.net/20.500.11815/147
[25] Chen, L., Wang, Y.M., Li, P.W., Ji, Y.Q., Kong, S.F., Li, Z.Y., Bai, Z.P. (2012). A land use regression model incorporating data on industrial point source pollution. J. Environ. Sci., 24(7): 1251-1258. https://doi.org/10.1016/S1001-0742(11)60902-9
[26] Yousefi-Sahzabi, A., Sasaki, K., Yousefi, H., Pirasteh, S., Sugai, Y. (2011). GIS aided prediction of CO2 emission dispersion from geothermal electricity production. J. Clean. Prod., 19(17-18): 1982-1993. https://doi.org/10.1016/j.jclepro.2011.06.009
[27] Mahboob, M.A., Atif, I., Riaz, A. (2016). Spatio temporal mapping and monitoring of land cover dynamics of Islamabad using multi-temporal remote sensing data. Pak. J. Sci., 68(2): 146-156.
[28] Hassan, Z., Shabbir, R., Ahmad, S.S., Malik, A.H., Aziz, N., Butt, A., Erum, S. (2016). Dynamics of land use and land cover change (LULCC) using geospatial techniques: A case study of Islamabad Pakistan. Springerplus, 5(1). https://doi.org/10.1186/s40064-016-2414-z
[29] Nishar, A., Richards, S., Breen, D., Robertson, J., Breen, B. (2016). Thermal infrared imaging of geothermal environments and by an unmanned aerial vehicle (UAV): A case study of the Wairakei - Tauhara geothermal field, Taupo, New Zealand. Renew. Energy, (86): 1256-1264. https://doi.org/10.1016/j.renene.2015.09.042
[30] Richter, D., Erdelyi, M., Curl, R.F., Tittel, F.K., Oppenheimer, C., Duffell, H.J., Burton, M. (2002). Field measurements of volcanic gases using tunable diode laser based mid-infrared and Fourier transform infrared spectrometers. Opt. Lasers Eng., 37(2-3): 171-186. https://doi.org/10.1016/S0143-8166(01)00094-X
[31] Anonim. (2021). Review of the integrated plan and investment program in Ngada district 2017-2021 (In Indonesia). https://sippa.ciptakarya.pu.go.id/sippa_online/ws_file/dokumen/rpi2jm/DOCRPIJM_1501387881Ngada_cover_daftar_isi.pdf
[32] Anonim. (2019). Regional Medium Term Development Plan 2014-2019 Ngada Regency (In Indonesia). http://portal.endekab.go.id/images/TRANSPARANSI/rpjmd2014-2019.pdf
[33] Miller, S.N., Phillip Guertin, D., Goodrich, D.C. (2007). Hydrologic modeling uncertainty resulting from land cover misclassification. J. Am. Water Resour. Assoc., 43(4): 1065-1075. https://doi.org/10.1111/j.1752-1688.2007.00088.x
[34] Gasparotto, J., Da Boit Martinello, K. (2020). Coal as an energy source and its impacts on human health. Energy Geosci., 2(2): 113-120. https://doi.org/10.1016/j.engeos.2020.07.003
[35] Binimelis, R., Myhr, A.I. (2016). Inclusion and implementation of socio-economic considerations in GMO regulations: Needs and recommendations. Sustain., 8(1): 1-24. https://doi.org/10.3390/su8010062
[36] Sanchez, L., Luan, B. (2018). The health cost of coal in Indonesia. 1-22. Available: www.iisd.org/gsi.
[37] Kristmannsdóttir, H., Ármannsson, H. (2003). Environmental aspects of geothermal energy utilization. Geothermics, 32(4-6): 451-461. https://doi.org/10.1016/S0375-6505(03)00052-X
[38] Bao, H., Wang, C.C., Han, L., Wu, S.H., Lou, L.M., Xu, B.G., Liu, Y.F. (2020). Resources and environmental pressure, carrying capacity, and governance: A case study of Yangtze River Economic Belt. Sustain., 12(4): 1576. https://doi.org/10.3390/su12041576
[39] Bodí, M.B., Martin, D.A., Balfour, V.N., Santín, C., Doerr, S.H., Pereira, P., Cerdà, A., Mataix-Solera, J. (2014). Wildland fire ash: Production, composition and eco-hydro-geomorphic effects. Earth-Science Rev., 130: 103-127. https://doi.org/10.1016/j.earscirev.2013.12.007
[40] Ministry of the Environment and Climate Change. (2016). Science discussion document on the development of air standards for sulphur dioxide (SO2). Stand. Dev. Branch.
[41] Hecq, P., van Aalst, R., Barnes, R., Bauman, R., Edwards, L., van den Hout, D., de Freitas, C., van Leeuwen, R., Rea, J., De Saeger, E. (1997). SO2, position paper. Eur. Comm., 3: 1-72.